Thin Film Sensors for High-temperature Market Overview and Analysis

In the year 2024, the Global Thin Film Sensor Market was valued at USD 4.98 billion. The size of this market is expected to increase to USD 7.9 billion by the year 2032, while growing at a Compounded Annual Growth Rate (CAGR) of 9.2% from 2025-2032.

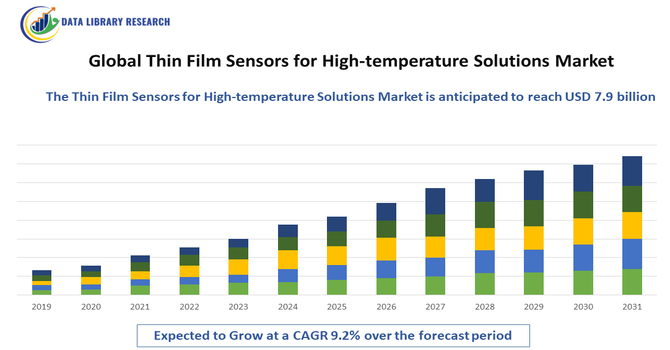
The growth of the Global Thin-Film Sensors for High-Temperature Market is primarily driven by rising demand for reliable and precise sensing solutions in extreme industrial environments such as aerospace engines, gas turbines, metal processing plants, and advanced power systems. Increasing adoption of high-efficiency industrial furnaces, expanding aerospace and defense programs, and stringent safety and performance standards across oil & gas, chemical processing, and energy sectors are accelerating market expansion. Additionally, advancements in thin-film coating technologies, micro-fabrication techniques, and high-temperature-resistant materials are enabling improved durability and accuracy, boosting adoption. The growing shift toward smart manufacturing, predictive maintenance, and Industry 4.0 also supports demand, as industries increasingly integrate high-temperature sensors for real-time monitoring, operational optimization, and early failure detection.

Thin Film Sensors for High-temperature Market Latest Trends

The Global Thin Film Sensors for High-Temperature Market is witnessing a surge in innovation as industries demand highly durable, precise, and compact sensing solutions for extreme operating environments. A key trend is the rapid development of advanced thin-film materials and substrates—such as platinum, metal-oxide coatings, and silicon carbide—that enable sensors to withstand temperatures exceeding 800°C to 1,000°C while maintaining stability and accuracy. Flexible and conformal thin-film sensor designs are also gaining traction, enabling direct integration on curved engine components, turbine blades, and industrial furnace surfaces, supporting next-generation aerospace, power generation, and high-temperature semiconductor equipment. Additionally, miniaturization and integration with IoT and Industry 4.0 platforms are accelerating adoption, as real-time monitoring and predictive maintenance become central to industrial digitalization.

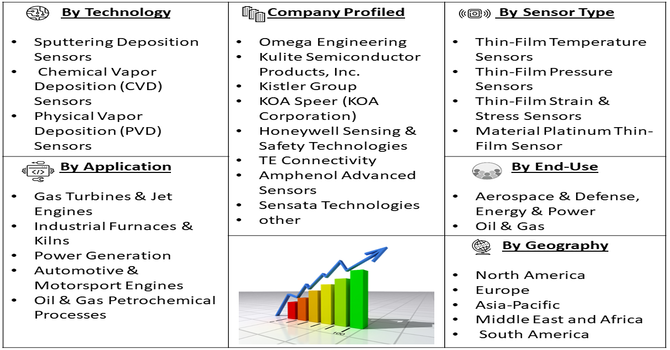
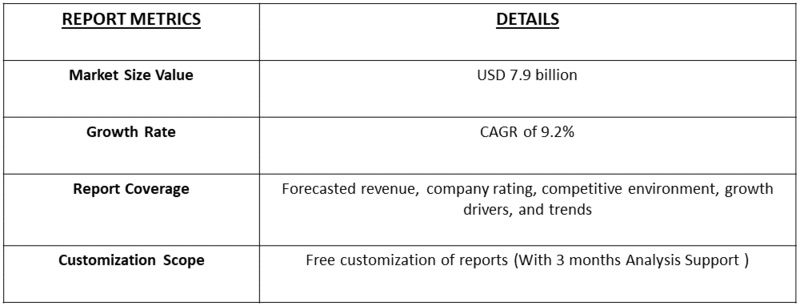
Segmentation: Global Thin Film Sensors for High-temperature Market is segmented By Sensor Type (Thin-Film Temperature Sensors, Thin-Film Pressure Sensors, Thin-Film Strain & Stress Sensors), Material Platinum Thin-Film Sensors, Nickel-Based Thin-Film Sensors, Metal-Oxide Thin-Film Sensors), Technology (Sputtering Deposition Sensors, Chemical Vapor Deposition (CVD) Sensors, Physical Vapor Deposition (PVD) Sensors), Application (Gas Turbines & Jet Engines, Industrial Furnaces & Kilns, Power Generation, Automotive & Motorsport Engines, Oil & Gas & Petrochemical Processes), End-Use Industry (Aerospace & Defense, Energy & Power, Oil & Gas), and Geography (North America, Europe, Asia-Pacific, Middle East and Africa, and South America). The report provides the value (in USD million) for the above segments.

Market Drivers:

  • Rising Demand for Advanced Monitoring in Extreme-Temperature Industries

Industries such as aerospace, power generation, metal processing, and oil & gas increasingly require precise and durable sensors capable of operating in harsh, high-temperature environments. Thin-film sensors provide superior thermal stability, fast response times, and long service life, making them ideal for gas turbines, jet engines, industrial furnaces, and high-performance automotive engines. As these sectors push for higher efficiency, safety, and performance, the need for robust sensing technology continues to accelerate, directly boosting market growth.

  • Advancements in Thin-Film Materials and Micro-Fabrication Technologies

Continuous innovations in high-temperature-resistant materials—such as platinum thin films, ceramic composites, and silicon carbide—along with advanced deposition techniques like sputtering, PVD, and CVD, are significantly improving sensor accuracy, temperature tolerance, and reliability. These technological advancements are enabling the deployment of thin-film sensors in next-generation aircraft propulsion, nuclear and concentrated solar power systems, hydrogen combustion platforms, and industrial IoT ecosystems.

In November 2025, Researchers at Queen Mary University of London engineered a new “self-tuning” ferroelectric thin film that demonstrated exceptional responsiveness and efficiency, achieving about 74% tunability at microwave frequencies with minimal voltage. This breakthrough overcame the traditional trade-off between tunability and energy efficiency, making the material ideal for applications in 5G, 6G, radar, and medical imaging. The innovation positively impacted the global thin film sensors for high-temperature market by enabling more energy-efficient, high-performance sensors capable of reliable operation in extreme environments. As manufacturing techniques evolve and costs gradually decline, adoption of thin-film sensors across high-tech and energy-intensive applications is rapidly expanding.

Market Restraints:

  • High Cost of Advanced Thin-Film Materials and Fabrication Processes

One major restraint is the high cost of advanced thin-film materials and fabrication processes, particularly platinum-based and ceramic-based films, which increases overall production expenses and limits adoption in cost-sensitive industries. Additionally, the technical complexity involved in manufacturing sensors that can sustain extreme temperatures, thermal cycling, and harsh chemical environments often requires specialized equipment and expertise, creating barriers for new entrants and smaller manufacturers. Another significant challenge is ensuring long-term stability and accuracy at temperatures above 800–1,000°C, as material degradation, diffusion, oxidation, and calibration drift can impact sensor performance over time. Furthermore, limited standardization and testing protocols for ultra-high-temperature sensing technologies reduce user confidence in emerging solutions, slowing commercialization. Collectively, these factors create cost, durability, and reliability challenges that can hinder widespread adoption despite rising industrial demand.

Socio Economic Impact on Thin Film Sensors for High-temperature Market

The global thin film sensors for high-temperature market has significant socioeconomic implications, driven by its critical role in aerospace, automotive, energy, and industrial applications. These sensors enable precise monitoring and control in extreme environments, enhancing operational safety, efficiency, and product reliability. Their adoption supports technological innovation and fuels growth in advanced manufacturing, creating high-skilled employment opportunities in engineering, materials science, and sensor design. Additionally, they contribute to energy efficiency and reduced emissions, aligning with global sustainability goals. However, high production costs and limited access to advanced fabrication technologies can restrict market penetration in developing economies. Thus, the market promotes industrial modernization, fosters sustainable innovation, and strengthens economic competitiveness across key high-tech and energy-intensive sectors worldwide.

Segmental Analysis

  • Thin-Film Temperature Sensors segment is expected to witness highest growth over the forecast period

Thin-film temperature sensors are expected to lead growth as industries demand ultra-precise thermal monitoring in extreme environments such as jet engines, gas turbines, industrial furnaces, and nuclear systems. These sensors offer rapid response, high accuracy, and superior thermal cycling endurance compared to conventional thermocouples, making them indispensable for next-generation aerospace propulsion, advanced automotive engines, and high-efficiency energy systems.

  • Platinum Thin-Film Sensors segment is expected to witness highest growth over the forecast period

Platinum-based thin-film sensors will dominate due to their exceptional thermal stability, chemical resistance, and accuracy at temperatures exceeding 800°C. Their strength under oxidation and corrosive conditions supports usage in defense aviation, petrochemical reactors, and metal smelting operations. Growing advancements in platinum micro-coating and adhesion technologies further enhance performance, driving wider industrial adoption.

  • Gas Turbines & Jet Engines segment is expected to witness highest growth over the forecast period

The gas turbine and aerospace engine sector represents a major growth driver as manufacturers push toward higher combustion temperatures for efficiency and reduced emissions. Thin-film sensors are increasingly embedded on turbine blades and combustion chambers for real-time temperature and strain monitoring, enabling predictive maintenance, fuel optimization, and ensuring structural integrity under extreme heat loads.

  • Aerospace & Defense segment is expected to witness highest growth over the forecast period

Aerospace & defense is poised for the fastest adoption due to critical need for ultra-reliable high-temperature sensing in hypersonic vehicles, missile propulsion, aircraft engines, and space systems. Continuous defense modernization and space missions are boosting demand for thin-film sensor technologies capable of surviving extreme thermal stress, vibration, radiation, and corrosive exhaust environments.

  • North America is expected to witness highest growth over the forecast period

North America will witness the highest regional growth supported by major aerospace R&D programs, advanced gas turbine manufacturers, and strong investments in clean energy and next-gen propulsion technologies. The region’s leadership in aviation innovation, defense spending, and industrial digitization accel.

In November 2025, Quantum Computing Inc. secured a contract from the National Institute of Standards and Technology (NIST) to design and fabricate thin-film lithium niobate (TFLN) photonic integrated circuits (PICs) and received a chip order from a Fortune 500 technology company serving defense, intelligence, and commercial markets. These developments advanced U.S. capabilities in high-precision photonics and thin-film technologies, positively impacting the country’s thin film sensors for high-temperature market by driving innovation, enhancing sensor performance, and supporting applications in extreme and mission-critical environments.

Similarly, in October 2025, MetaOptics Ltd, expanding its presence in semiconductor optics and metalens technology. This move strengthened cross-border collaborations in integrated photonics, nanophotonics, and semiconductor manufacturing. By extending its metalens design and production expertise to North American clients in 5G, data communications, AI semiconductors, and consumer electronics, MetaOptics advanced innovation in precision optical components. The expansion positively impacted the U.S. thin film sensors for high-temperature market by enabling the development of more compact, efficient, and high-performance sensors for extreme and high-frequency applications.

Thin Film Sensors for High-temperature Market Competitive Landscape

The Global Thin-Film Sensors for High-Temperature market is competitive and fragmented, with specialist thin-film and high-temperature sensor firms competing alongside large, diversified sensor and industrial-instrumentation corporations. Key competitive factors include materials expertise (e.g., platinum, SiC, ceramic films), micro-fabrication and deposition capabilities, high-temperature qualification (thermal cycling, oxidation resistance), system-level integration for Industry 4.0, and regional manufacturing/service footprints. Niche suppliers that focus on thin-film RTDs/thermocouples and heat-flux/pressure thin-film devices coexist with major sensor OEMs that bundle sensors into broader instrumentation and control solutions.

Key Players:

  • Omega Engineering
  • Kulite Semiconductor Products, Inc.
  • Kistler Group
  • Variohm EuroSensor
  • IST (Innovative Sensor Technology / IST AG)
  • Yageo Nexensos
  • SEMITEC Corporation
  • Murata Manufacturing Co., Ltd.
  • KOA Speer (KOA Corporation)
  • Honeywell Sensing & Safety Technologies
  • TE Connectivity
  • Amphenol Advanced Sensors
  • Sensata Technologies
  • First Sensor AG
  • Baumer Group
  • Keyence Corporation
  • KELLER AG für Druckmesstechnik
  • MKS Instruments
  • Ametek, Inc.
  • ABB Measurement & Analytics

Recent Development

  • In October 2025, xMEMS Labs, Inc., the inventor of the world’s first piezoelectric MEMS (piezoMEMS) µCooling fan-on-a-chip and leader in solid-state silicon speakers, closed a $21 million Series D funding round. Led by Boardman Bay Capital Management with participation from multiple strategic investors, the funding supported continued innovation in compact thermal management and precision MEMS technologies. This development positively impacted the global thin film sensors for high-temperature market by accelerating the adoption of thermally stable, miniaturized sensor solutions capable of operating reliably in extreme environments.


  • In December 2024, TDK Corporation introduced its PLE856C Series of compact thin-film power inductors for wearable devices, featuring inductances from 470 nH to 1.5 µH. The series offered a 40% smaller mounted area and 50% reduced volume compared to earlier models, enabling more compact, lightweight designs. This advancement positively impacted the global thin film sensors for high-temperature market by driving innovation in miniaturization, enhancing fabrication precision, and promoting the development of durable, thermally stable thin-film technologies for advanced electronics.


Frequently Asked Questions (FAQ) :

Q1. What are the main growth driving factors for this market?

The market is primarily driven by the increasing demand for precise and reliable monitoring in extremely harsh industrial environments, particularly in aerospace, gas turbines, and advanced manufacturing. The continuous global push towards industrial automation (Industry 4.0) and the rise of electric vehicles (EVs) require high-accuracy sensors for thermal management. Thin film technology is favored as it offers a superior combination of stability, miniaturization, and faster response times in critical, high-temperature applications.

Q2. What are the main restraining factors for this market?

Major restraining factors include the high complexity and specialized capital investment required for the precision deposition technologies (like sputtering) used in manufacturing these sensors. A key technical challenge is the coupling of temperature and strain signals at extreme temperatures, which can compromise measurement accuracy. Furthermore, long-term material degradation, oxidation, and resistance drift of the thin films under prolonged high-heat exposure remain significant hurdles that limit their lifetime and widespread adoption.

Q3. Which segment is expected to witness high growth?

The Automotive application segment is expected to witness the highest growth, specifically driven by the electrification trend. Thin film sensors are essential for the accurate thermal management and diagnostic monitoring of high-voltage battery packs and power electronics in EVs, where temperatures are critical for safety and efficiency. By sensor type, the Thin-Film Platinum Resistance Temperature Detector (RTD) segment is projected to dominate due to its recognized stability and high accuracy in industrial and demanding temperature ranges.

Q4. Who are the top major players for this market?

The market is led by companies specializing in high-performance sensing technology and industrial automation. Top major players include Heraeus Sensor Technology, Honeywell International Inc., TE Connectivity, and Innovative Sensor Technology (IST AG). These companies maintain their leadership by investing heavily in specialized thin-film deposition techniques, creating highly durable platinum and metal-alloy sensors, and integrating them into smart, predictive maintenance solutions for high-value industrial and aerospace systems.

Q5. Which country is the largest player?

North America, specifically the United States, is generally the largest market player by revenue share. This is attributed to the presence of large aerospace and defense contractors, high R&D spending on advanced propulsion systems, and a mature industrial base requiring high-precision sensors. However, the Asia Pacific region, particularly China, is strongly positioned to be the fastest-growing market due to massive investments in electronics manufacturing, rapid expansion of the domestic EV sector, and increasing automation in its industrial base.

Thin Film Sensors for High-temperature MARKET STUDY GLOBAL MARKET ANALYSIS, INSIGHTS AND FORECAST, 2022-2029

    1. Introduction

    • 1.1. Research Scope
    • 1.2. Market Segmentation
    • 1.3. Research Methodology
    • 1.4. Definitions and Assumptions

    2. Executive Summary

      3. Market Dynamics

      • 3.1. Market Drivers
      • 3.2. Market Restraints
      • 3.3. Market Opportunities

      4. Key Insights

      • 4.1. Key Emerging Trends – For Major Countries
      • 4.2. Latest Technological Advancement
      • 4.3. Regulatory Landscape
      • 4.4. Industry SWOT Analysis
      • 4.5. Porters Five Forces Analysis

      5. Global Thin Film Sensors for High-temperature Market Analysis (USD Billion), Insights and Forecast, 2018-2029

      • 5.1. Key Findings / Summary
      • 5.2. Market Analysis, Insights and Forecast – By Segment 1
        • 5.2.1. Sub-Segment 1
        • 5.2.2. Sub-Segment 2
      • 5.3. Market Analysis, Insights and Forecast – By Segment 2
        • 5.3.1. Sub-Segment 1
        • 5.3.2. Sub-Segment 2
        • 5.3.3. Sub-Segment 3
        • 5.3.4. Others
      • 5.4. Market Analysis, Insights and Forecast – By Segment 3
        • 5.4.1. Sub-Segment 1
        • 5.4.2. Sub-Segment 2
        • 5.4.3. Sub-Segment 3
        • 5.4.4. Others
      • 5.5. Market Analysis, Insights and Forecast – By Region
        • 5.5.1. North America
        • 5.5.2. Latin America
        • 5.5.3. Europe
        • 5.5.4. Asia Pacific
        • 5.5.5. Middle East and Africa

      6. North America Thin Film Sensors for High-temperature Market Analysis (USD Billion), Insights and Forecast, 2018-2029

      • 6.1. Key Findings / Summary
      • 6.2. Market Analysis, Insights and Forecast – By Segment 1
        • 6.2.1. Sub-Segment 1
        • 6.2.2. Sub-Segment 2
      • 6.3. Market Analysis, Insights and Forecast – By Segment 2
        • 6.3.1. Sub-Segment 1
        • 6.3.2. Sub-Segment 2
        • 6.3.3. Sub-Segment 3
        • 6.3.4. Others
      • 6.4. Market Analysis, Insights and Forecast – By Segment 3
        • 6.4.1. Sub-Segment 1
        • 6.4.2. Sub-Segment 2
        • 6.4.3. Sub-Segment 3
        • 6.4.4. Others
      • 6.5. Market Analysis, Insights and Forecast – By Country
        • 6.5.1. U.S.
        • 6.5.2. Canada

      7. Latin America Thin Film Sensors for High-temperature Market Analysis (USD Billion), Insights and Forecast, 2018-2029

      • 7.1. Key Findings / Summary
      • 7.2. Market Analysis, Insights and Forecast – By Segment 1
        • 7.2.1. Sub-Segment 1
        • 7.2.2. Sub-Segment 2
      • 7.3. Market Analysis, Insights and Forecast – By Segment 2
        • 7.3.1. Sub-Segment 1
        • 7.3.2. Sub-Segment 2
        • 7.3.3. Sub-Segment 3
        • 7.3.4. Others
      • 7.4. Market Analysis, Insights and Forecast – By Segment 3
        • 7.4.1. Sub-Segment 1
        • 7.4.2. Sub-Segment 2
        • 7.4.3. Sub-Segment 3
        • 7.4.4. Others
      • 7.5. Insights and Forecast – By Country
        • 7.5.1. Brazil
        • 7.5.2. Mexico
        • 7.5.3. Rest of Latin America

      8. Europe Thin Film Sensors for High-temperature Market Analysis (USD Billion), Insights and Forecast, 2018-2029

      • 8.1. Key Findings / Summary
      • 8.2. Market Analysis, Insights and Forecast – By Segment 1
        • 8.2.1. Sub-Segment 1
        • 8.2.2. Sub-Segment 2
      • 8.3. Market Analysis, Insights and Forecast – By Segment 2
        • 8.3.1. Sub-Segment 1
        • 8.3.2. Sub-Segment 2
        • 8.3.3. Sub-Segment 3
        • 8.3.4. Others
      • 8.4. Market Analysis, Insights and Forecast – By Segment 3
        • 8.4.1. Sub-Segment 1
        • 8.4.2. Sub-Segment 2
        • 8.4.3. Sub-Segment 3
        • 8.4.4. Others
      • 8.5. Market Analysis, Insights and Forecast – By Country
        • 8.5.1. UK
        • 8.5.2. Germany
        • 8.5.3. France
        • 8.5.4. Italy
        • 8.5.5. Spain
        • 8.5.6. Russia
        • 8.5.7. Rest of Europe

      9. Asia Pacific Thin Film Sensors for High-temperature Market Analysis (USD Billion), Insights and Forecast, 2018-2029

      • 9.1. Key Findings / Summary
      • 9.2. Market Analysis, Insights and Forecast – By Segment 1
        • 9.2.1. Sub-Segment 1
        • 9.2.2. Sub-Segment 2
      • 9.3. Market Analysis, Insights and Forecast – By Segment 2
        • 9.3.1. Sub-Segment 1
        • 9.3.2. Sub-Segment 2
        • 9.3.3. Sub-Segment 3
        • 9.3.4. Others
      • 9.4. Market Analysis, Insights and Forecast – By Segment 3
        • 9.4.1. Sub-Segment 1
        • 9.4.2. Sub-Segment 2
        • 9.4.3. Sub-Segment 3
        • 9.4.4. Others
      • 9.5. Market Analysis, Insights and Forecast – By Country
        • 9.5.1. China
        • 9.5.2. India
        • 9.5.3. Japan
        • 9.5.4. Australia
        • 9.5.5. South East Asia
        • 9.5.6. Rest of Asia Pacific

      10. Middle East & Africa Thin Film Sensors for High-temperature Market Analysis (USD Billion), Insights and Forecast, 2018-2029

      • 10.1. Key Findings / Summary
      • 10.2. Market Analysis, Insights and Forecast – By Segment 1
        • 10.2.1. Sub-Segment 1
        • 10.2.2. Sub-Segment 2
      • 10.3. Market Analysis, Insights and Forecast – By Segment 2
        • 10.3.1. Sub-Segment 1
        • 10.3.2. Sub-Segment 2
        • 10.3.3. Sub-Segment 3
        • 10.3.4. Others
      • 10.4. Market Analysis, Insights and Forecast – By Segment 3
        • 10.4.1. Sub-Segment 1
        • 10.4.2. Sub-Segment 2
        • 10.4.3. Sub-Segment 3
        • 10.4.4. Others
      • 10.5. Market Analysis, Insights and Forecast – By Country
        • 10.5.1. GCC
        • 10.5.2. South Africa
        • 10.5.3. Rest of Middle East & Africa

      11. Competitive Analysis

      • 11.1. Company Market Share Analysis, 2018
      • 11.2. Key Industry Developments
      • 11.3. Company Profile
        • 11.3.1. Company 1
          • 11.3.1.1. Business Overview
          • 11.3.1.2. Segment 1 & Service Offering
          • 11.3.1.3. Overall Revenue
          • 11.3.1.4. Geographic Presence
          • 11.3.1.5. Recent Development
        *Similar details will be provided for the following companies
        • 11.3.2. Company 2
        • 11.3.3. Company 3
        • 11.3.4. Company 4
        • 11.3.5. Company 5
        • 11.3.6. Company 6
        • 11.3.7. Company 7
        • 11.3.8. Company 8
        • 11.3.9. Company 9
        • 11.3.10. Company 10
        • 11.3.11. Company 11
        • 11.3.12. Company 12
      List of Figures

      Figure 1: Global Thin Film Sensors for High-temperature Market Revenue Breakdown (USD Billion, %) by Region, 2022 & 2029
      Figure 2: Global Thin Film Sensors for High-temperature Market Value Share (%), By Segment 1, 2022 & 2029
      Figure 3: Global Thin Film Sensors for High-temperature Market Forecast (USD Billion), by Sub-Segment 1, 2018-2029
      Figure 4: Global Thin Film Sensors for High-temperature Market Forecast (USD Billion), by Sub-Segment 2, 2018-2029
      Figure 5: Global Thin Film Sensors for High-temperature Market Value Share (%), By Segment 2, 2022 & 2029
      Figure 6: Global Thin Film Sensors for High-temperature Market Forecast (USD Billion), by Sub-Segment 1, 2018-2029
      Figure 7: Global Thin Film Sensors for High-temperature Market Forecast (USD Billion), by Sub-Segment 2, 2018-2029
      Figure 8: Global Thin Film Sensors for High-temperature Market Forecast (USD Billion), by Sub-Segment 3, 2018-2029
      Figure 9: Global Thin Film Sensors for High-temperature Market Forecast (USD Billion), by Others, 2018-2029
      Figure 10: Global Thin Film Sensors for High-temperature Market Value Share (%), By Segment 3, 2022 & 2029
      Figure 11: Global Thin Film Sensors for High-temperature Market Forecast (USD Billion), by Sub-Segment 1, 2018-2029
      Figure 12: Global Thin Film Sensors for High-temperature Market Forecast (USD Billion), by Sub-Segment 2, 2018-2029
      Figure 13: Global Thin Film Sensors for High-temperature Market Forecast (USD Billion), by Sub-Segment 3, 2018-2029
      Figure 14: Global Thin Film Sensors for High-temperature Market Forecast (USD Billion), by Others, 2018-2029
      Figure 15: Global Thin Film Sensors for High-temperature Market Value (USD Billion), by Region, 2022 & 2029
      Figure 16: North America Thin Film Sensors for High-temperature Market Value Share (%), By Segment 1, 2022 & 2029
      Figure 17: North America Thin Film Sensors for High-temperature Market Forecast (USD Billion), by Sub-Segment 1, 2018-2029
      Figure 18: North America Thin Film Sensors for High-temperature Market Forecast (USD Billion), by Sub-Segment 2, 2018-2029
      Figure 19: North America Thin Film Sensors for High-temperature Market Value Share (%), By Segment 2, 2022 & 2029
      Figure 20: North America Thin Film Sensors for High-temperature Market Forecast (USD Billion), by Sub-Segment 1, 2018-2029
      Figure 21: North America Thin Film Sensors for High-temperature Market Forecast (USD Billion), by Sub-Segment 2, 2018-2029
      Figure 22: North America Thin Film Sensors for High-temperature Market Forecast (USD Billion), by Sub-Segment 3, 2018-2029
      Figure 23: North America Thin Film Sensors for High-temperature Market Forecast (USD Billion), by Others, 2018-2029
      Figure 24: North America Thin Film Sensors for High-temperature Market Value Share (%), By Segment 3, 2022 & 2029
      Figure 25: North America Thin Film Sensors for High-temperature Market Forecast (USD Billion), by Sub-Segment 1, 2018-2029
      Figure 26: North America Thin Film Sensors for High-temperature Market Forecast (USD Billion), by Sub-Segment 2, 2018-2029
      Figure 27: North America Thin Film Sensors for High-temperature Market Forecast (USD Billion), by Sub-Segment 3, 2018-2029
      Figure 28: North America Thin Film Sensors for High-temperature Market Forecast (USD Billion), by Others, 2018-2029
      Figure 29: North America Thin Film Sensors for High-temperature Market Forecast (USD Billion), by U.S., 2018-2029
      Figure 30: North America Thin Film Sensors for High-temperature Market Forecast (USD Billion), by Canada, 2018-2029
      Figure 31: Latin America Thin Film Sensors for High-temperature Market Value Share (%), By Segment 1, 2022 & 2029
      Figure 32: Latin America Thin Film Sensors for High-temperature Market Forecast (USD Billion), by Sub-Segment 1, 2018-2029
      Figure 33: Latin America Thin Film Sensors for High-temperature Market Forecast (USD Billion), by Sub-Segment 2, 2018-2029
      Figure 34: Latin America Thin Film Sensors for High-temperature Market Value Share (%), By Segment 2, 2022 & 2029
      Figure 35: Latin America Thin Film Sensors for High-temperature Market Forecast (USD Billion), by Sub-Segment 1, 2018-2029
      Figure 36: Latin America Thin Film Sensors for High-temperature Market Forecast (USD Billion), by Sub-Segment 2, 2018-2029
      Figure 37: Latin America Thin Film Sensors for High-temperature Market Forecast (USD Billion), by Sub-Segment 3, 2018-2029
      Figure 38: Latin America Thin Film Sensors for High-temperature Market Forecast (USD Billion), by Others, 2018-2029
      Figure 39: Latin America Thin Film Sensors for High-temperature Market Value Share (%), By Segment 3, 2022 & 2029
      Figure 40: Latin America Thin Film Sensors for High-temperature Market Forecast (USD Billion), by Sub-Segment 1, 2018-2029
      Figure 41: Latin America Thin Film Sensors for High-temperature Market Forecast (USD Billion), by Sub-Segment 2, 2018-2029
      Figure 42: Latin America Thin Film Sensors for High-temperature Market Forecast (USD Billion), by Sub-Segment 3, 2018-2029
      Figure 43: Latin America Thin Film Sensors for High-temperature Market Forecast (USD Billion), by Others, 2018-2029
      Figure 44: Latin America Thin Film Sensors for High-temperature Market Forecast (USD Billion), by Brazil, 2018-2029
      Figure 45: Latin America Thin Film Sensors for High-temperature Market Forecast (USD Billion), by Mexico, 2018-2029
      Figure 46: Latin America Thin Film Sensors for High-temperature Market Forecast (USD Billion), by Rest of Latin America, 2018-2029
      Figure 47: Europe Thin Film Sensors for High-temperature Market Value Share (%), By Segment 1, 2022 & 2029
      Figure 48: Europe Thin Film Sensors for High-temperature Market Forecast (USD Billion), by Sub-Segment 1, 2018-2029
      Figure 49: Europe Thin Film Sensors for High-temperature Market Forecast (USD Billion), by Sub-Segment 2, 2018-2029
      Figure 50: Europe Thin Film Sensors for High-temperature Market Value Share (%), By Segment 2, 2022 & 2029
      Figure 51: Europe Thin Film Sensors for High-temperature Market Forecast (USD Billion), by Sub-Segment 1, 2018-2029
      Figure 52: Europe Thin Film Sensors for High-temperature Market Forecast (USD Billion), by Sub-Segment 2, 2018-2029
      Figure 53: Europe Thin Film Sensors for High-temperature Market Forecast (USD Billion), by Sub-Segment 3, 2018-2029
      Figure 54: Europe Thin Film Sensors for High-temperature Market Forecast (USD Billion), by Others, 2018-2029
      Figure 55: Europe Thin Film Sensors for High-temperature Market Value Share (%), By Segment 3, 2022 & 2029
      Figure 56: Europe Thin Film Sensors for High-temperature Market Forecast (USD Billion), by Sub-Segment 1, 2018-2029
      Figure 57: Europe Thin Film Sensors for High-temperature Market Forecast (USD Billion), by Sub-Segment 2, 2018-2029
      Figure 58: Europe Thin Film Sensors for High-temperature Market Forecast (USD Billion), by Sub-Segment 3, 2018-2029
      Figure 59: Europe Thin Film Sensors for High-temperature Market Forecast (USD Billion), by Others, 2018-2029
      Figure 60: Europe Thin Film Sensors for High-temperature Market Forecast (USD Billion), by U.K., 2018-2029
      Figure 61: Europe Thin Film Sensors for High-temperature Market Forecast (USD Billion), by Germany, 2018-2029
      Figure 62: Europe Thin Film Sensors for High-temperature Market Forecast (USD Billion), by France, 2018-2029
      Figure 63: Europe Thin Film Sensors for High-temperature Market Forecast (USD Billion), by Italy, 2018-2029
      Figure 64: Europe Thin Film Sensors for High-temperature Market Forecast (USD Billion), by Spain, 2018-2029
      Figure 65: Europe Thin Film Sensors for High-temperature Market Forecast (USD Billion), by Russia, 2018-2029
      Figure 66: Europe Thin Film Sensors for High-temperature Market Forecast (USD Billion), by Rest of Europe, 2018-2029
      Figure 67: Asia Pacific Thin Film Sensors for High-temperature Market Value Share (%), By Segment 1, 2022 & 2029
      Figure 68: Asia Pacific Thin Film Sensors for High-temperature Market Forecast (USD Billion), by Sub-Segment 1, 2018-2029
      Figure 69: Asia Pacific Thin Film Sensors for High-temperature Market Forecast (USD Billion), by Sub-Segment 2, 2018-2029
      Figure 70: Asia Pacific Thin Film Sensors for High-temperature Market Value Share (%), By Segment 2, 2022 & 2029
      Figure 71: Asia Pacific Thin Film Sensors for High-temperature Market Forecast (USD Billion), by Sub-Segment 1, 2018-2029
      Figure 72: Asia Pacific Thin Film Sensors for High-temperature Market Forecast (USD Billion), by Sub-Segment 2, 2018-2029
      Figure 73: Asia Pacific Thin Film Sensors for High-temperature Market Forecast (USD Billion), by Sub-Segment 3, 2018-2029
      Figure 74: Asia Pacific Thin Film Sensors for High-temperature Market Forecast (USD Billion), by Others, 2018-2029
      Figure 75: Asia Pacific Thin Film Sensors for High-temperature Market Value Share (%), By Segment 3, 2022 & 2029
      Figure 76: Asia Pacific Thin Film Sensors for High-temperature Market Forecast (USD Billion), by Sub-Segment 1, 2018-2029
      Figure 77: Asia Pacific Thin Film Sensors for High-temperature Market Forecast (USD Billion), by Sub-Segment 2, 2018-2029
      Figure 78: Asia Pacific Thin Film Sensors for High-temperature Market Forecast (USD Billion), by Sub-Segment 3, 2018-2029
      Figure 79: Asia Pacific Thin Film Sensors for High-temperature Market Forecast (USD Billion), by Others, 2018-2029
      Figure 80: Asia Pacific Thin Film Sensors for High-temperature Market Forecast (USD Billion), by China, 2018-2029
      Figure 81: Asia Pacific Thin Film Sensors for High-temperature Market Forecast (USD Billion), by India, 2018-2029
      Figure 82: Asia Pacific Thin Film Sensors for High-temperature Market Forecast (USD Billion), by Japan, 2018-2029
      Figure 83: Asia Pacific Thin Film Sensors for High-temperature Market Forecast (USD Billion), by Australia, 2018-2029
      Figure 84: Asia Pacific Thin Film Sensors for High-temperature Market Forecast (USD Billion), by Southeast Asia, 2018-2029
      Figure 85: Asia Pacific Thin Film Sensors for High-temperature Market Forecast (USD Billion), by Rest of Asia Pacific, 2018-2029
      Figure 86: Middle East & Africa Thin Film Sensors for High-temperature Market Value Share (%), By Segment 1, 2022 & 2029
      Figure 87: Middle East & Africa Thin Film Sensors for High-temperature Market Forecast (USD Billion), by Sub-Segment 1, 2018-2029
      Figure 88: Middle East & Africa Thin Film Sensors for High-temperature Market Forecast (USD Billion), by Sub-Segment 2, 2018-2029
      Figure 89: Middle East & Africa Thin Film Sensors for High-temperature Market Value Share (%), By Segment 2, 2022 & 2029
      Figure 90: Middle East & Africa Thin Film Sensors for High-temperature Market Forecast (USD Billion), by Sub-Segment 1, 2018-2029
      Figure 91: Middle East & Africa Thin Film Sensors for High-temperature Market Forecast (USD Billion), by Sub-Segment 2, 2018-2029
      Figure 92: Middle East & Africa Thin Film Sensors for High-temperature Market Forecast (USD Billion), by Sub-Segment 3, 2018-2029
      Figure 93: Middle East & Africa Thin Film Sensors for High-temperature Market Forecast (USD Billion), by Others, 2018-2029
      Figure 94: Middle East & Africa Thin Film Sensors for High-temperature Market Value Share (%), By Segment 3, 2022 & 2029
      Figure 95: Middle East & Africa Thin Film Sensors for High-temperature Market Forecast (USD Billion), by Sub-Segment 1, 2018-2029
      Figure 96: Middle East & Africa Thin Film Sensors for High-temperature Market Forecast (USD Billion), by Sub-Segment 2, 2018-2029
      Figure 97: Middle East & Africa Thin Film Sensors for High-temperature Market Forecast (USD Billion), by Sub-Segment 3, 2018-2029
      Figure 98: Middle East & Africa Thin Film Sensors for High-temperature Market Forecast (USD Billion), by Others, 2018-2029
      Figure 99: Middle East & Africa Thin Film Sensors for High-temperature Market Forecast (USD Billion), by GCC, 2018-2029
      Figure 100: Middle East & Africa Thin Film Sensors for High-temperature Market Forecast (USD Billion), by South Africa, 2018-2029
      Figure 101: Middle East & Africa Thin Film Sensors for High-temperature Market Forecast (USD Billion), by Rest of Middle East & Africa, 2018-2029 
      List of Tables
      Table 1: Global Thin Film Sensors for High-temperature Market Revenue (USD Billion) Forecast, by Segment 1, 2018-2029
      Table 2: Global Thin Film Sensors for High-temperature Market Revenue (USD Billion) Forecast, by Segment 2, 2018-2029
      Table 3: Global Thin Film Sensors for High-temperature Market Revenue (USD Billion) Forecast, by Segment 3, 2018-2029
      Table 4: Global Thin Film Sensors for High-temperature Market Revenue (USD Billion) Forecast, by Region, 2018-2029
      Table 5: North America Thin Film Sensors for High-temperature Market Revenue (USD Billion) Forecast, by Segment 1, 2018-2029
      Table 6: North America Thin Film Sensors for High-temperature Market Revenue (USD Billion) Forecast, by Segment 2, 2018-2029
      Table 7: North America Thin Film Sensors for High-temperature Market Revenue (USD Billion) Forecast, by Segment 3, 2018-2029
      Table 8: North America Thin Film Sensors for High-temperature Market Revenue (USD Billion) Forecast, by Country, 2018-2029
      Table 9: Europe Thin Film Sensors for High-temperature Market Revenue (USD Billion) Forecast, by Segment 1, 2018-2029
      Table 10: Europe Thin Film Sensors for High-temperature Market Revenue (USD Billion) Forecast, by Segment 2, 2018-2029
      Table 11: Europe Thin Film Sensors for High-temperature Market Revenue (USD Billion) Forecast, by Segment 3, 2018-2029
      Table 12: Europe Thin Film Sensors for High-temperature Market Revenue (USD Billion) Forecast, by Country, 2018-2029
      Table 13: Latin America Thin Film Sensors for High-temperature Market Revenue (USD Billion) Forecast, by Segment 1, 2018-2029
      Table 14: Latin America Thin Film Sensors for High-temperature Market Revenue (USD Billion) Forecast, by Segment 2, 2018-2029
      Table 15: Latin America Thin Film Sensors for High-temperature Market Revenue (USD Billion) Forecast, by Segment 3, 2018-2029
      Table 16: Latin America Thin Film Sensors for High-temperature Market Revenue (USD Billion) Forecast, by Country, 2018-2029
      Table 17: Asia Pacific Thin Film Sensors for High-temperature Market Revenue (USD Billion) Forecast, by Segment 1, 2018-2029
      Table 18: Asia Pacific Thin Film Sensors for High-temperature Market Revenue (USD Billion) Forecast, by Segment 2, 2018-2029
      Table 19: Asia Pacific Thin Film Sensors for High-temperature Market Revenue (USD Billion) Forecast, by Segment 3, 2018-2029
      Table 20: Asia Pacific Thin Film Sensors for High-temperature Market Revenue (USD Billion) Forecast, by Country, 2018-2029
      Table 21: Middle East & Africa Thin Film Sensors for High-temperature Market Revenue (USD Billion) Forecast, by Segment 1, 2018-2029
      Table 22: Middle East & Africa Thin Film Sensors for High-temperature Market Revenue (USD Billion) Forecast, by Segment 2, 2018-2029
      Table 23: Middle East & Africa Thin Film Sensors for High-temperature Market Revenue (USD Billion) Forecast, by Segment 3, 2018-2029
      Table 24: Middle East & Africa Thin Film Sensors for High-temperature Market Revenue (USD Billion) Forecast, by Country, 2018-2029
      Research Process

      Data Library Research are conducted by industry experts who offer insight on industry structure, market segmentations technology assessment and competitive landscape (CL), and penetration, as well as on emerging trends. Their analysis is based on primary interviews (~ 80%) and secondary research (~ 20%) as well as years of professional expertise in their respective industries. Adding to this, by analysing historical trends and current market positions, our analysts predict where the market will be headed for the next five years. Furthermore, the varying trends of segment & categories geographically presented are also studied and the estimated based on the primary & secondary research.

      In this particular report from the supply side Data Library Research has conducted primary surveys (interviews) with the key level executives (VP, CEO’s, Marketing Director, Business Development Manager and SOFT) of the companies that active & prominent as well as the midsized organization

      FIGURE 1: DLR RESEARH PROCESS

      research-methodology1

      Primary Research

      Extensive primary research was conducted to gain a deeper insight of the market and industry performance. The analysis is based on both primary and secondary research as well as years of professional expertise in the respective industries.

      In addition to analysing current and historical trends, our analysts predict where the market is headed over the next five years.

      It varies by segment for these categories geographically presented in the list of market tables. Speaking about this particular report we have conducted primary surveys (interviews) with the key level executives (VP, CEO’s, Marketing Director, Business Development Manager and many more) of the major players active in the market.

      Secondary Research

      Secondary research was mainly used to collect and identify information useful for the extensive, technical, market-oriented, and Friend’s study of the Global Extra Neutral Alcohol. It was also used to obtain key information about major players, market classification and segmentation according to the industry trends, geographical markets, and developments related to the market and technology perspectives. For this study, analysts have gathered information from various credible sources, such as annual reports, sec filings, journals, white papers, SOFT presentations, and company web sites.

      Market Size Estimation

      Both, top-down and bottom-up approaches were used to estimate and validate the size of the Global market and to estimate the size of various other dependent submarkets in the overall Extra Neutral Alcohol. The key players in the market were identified through secondary research and their market contributions in the respective geographies were determined through primary and secondary research.

      Forecast Model

      research-methodology2

      Happy to Assist You

      If you have a question?

      info@datalibraryresearch.com

      IND : +91 955 279 0357

      Browse Related Reports