Toy Drones Market Overview
Toy drones are significantly observing innovations and advancements in the current state, despite all of the previous technical development. Some toy drones already fly without the aid of a controller, thanks to the expanding acceptance of autonomous flight technology. Toy drone demand will be boosted by system failure responses, dynamic routing, and handoffs between human and machine operators. As a result, toy drones are making inroads into the military as military-developed technology. Drones have recently become a vital part of US military reconnaissance and striking missions. The US Army has accomplished various key missions because of this technology adoption. Simultaneously, the agriculture industry is experiencing a surge in demand for toy drones for development and expansion.
Toy drones assist farmers with increasing output and lowering expenses by enabling more efficient precision crop spraying and efficient land mapping. Government investments are steadily increasing due to the expanding use of toy drones in a variety of industries. The government is pouring money into the private sector to expand cyberspace. In light of the aforementioned factors, the toy drones market is expected to grow significantly throughout the forecast period.
| Report Metric |
Details |
| Market size available for years |
2023–2030 |
| Base year considered |
2023 |
| Forecast period |
2024–2030 |
| Forecast unit |
Value (USD Million) |
| Segments covered |
Product Type, Application, and Region. |
| Regions covered |
North America (the U.S. and Canada), Europe (UK, Germany, France, Italy, Spain, Russia, Rest of Europe), Asia-Pacific (China, India, Japan, Australia, South East Asia, Rest of Asia Pacific), Latin America and the Middle East and Africa (Brazil, Saudi Arabia, UAE, Rest of LAMEA) |
| Companies covered |
Aerix Drones, AeroVironment, Inc., DJI, Drona Aviation Pvt. Ltd, Extreme Fliers, Guangdong Cheerson Hobby Technology Co., Ltd, Horizon Hobby LLC, Jianjian Technology Co., Ltd, Parrot Drones SAS, Shenzhen Hubsan Technology Company Limited, Skyrocket LLC, Syma, TRNDlabs, Udirc Technology Co., Ltd, Weili Toys, XK Industrial Co., Ltd. |
Covid-19 Impact on Toy Drones Market
Like many other industries, COVID-19 badly knocked the electronic and semiconductor industries. This unprecedented event has impacted nearly 230 countries in just a few weeks, resulting in the forced shutdown of manufacturing and transportation activities within and across the countries. This has directly affected the overall sector's growth. It is estimated that COVID-19 to leave more than USD 30 billion impacts on the electronics and semiconductor industry. The sector is majorly affected due to transport restrictions on major electronics and semiconductor raw material providers. However, the emerging need for semiconductors in several industries will offer rapid market recovery over the future period.
Toy Drones Market Segment Overview
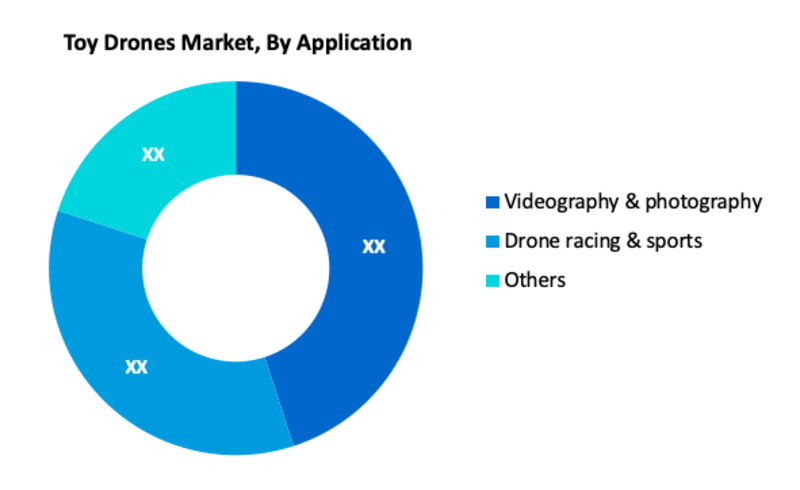
Based on Application, Videography & Photography is one of the most prominent segments in the global Toy Drones market. Currently, the majority of players are focusing on developing drones for consumer use. Recreational videography and photography, wildlife and hunting surveillance, and fishing are all typical uses for drones and cameras. Consumer drones of the next generation are now frequently employed in drone sports and racing. Furthermore, as the popularity of drones grows, so will the number of drone-related service providers. Additionally, in some areas, the military is employing toy drones as a primary tool for gathering vital information.
Toy Drones Market, By Product Type
· Fixed Wing Type
· Rotor Type
· Flapping Wing Type
Toy Drones Market, By Application
· Videography & photography
· Drone racing & sports
· Others
Toy Drones Market Regional Overview
In terms of region, North America is expected to dominate the toy drone market. This trend is expected to continue over the projected period, owing to supportive government measures in combination with the advancement of drone technology, as well as rising business demand for drone-acquired data. On the other hand, the market in the Asia Pacific is expected to grow at a rapid rate as China and Japan use new technology and automation to combat rising labour costs. The toy drone market is growing due to the increased manufacture of lightweight drones and the availability of low-cost drones in countries like China. Moreover, due to regulatory limitations, toy drone sales in Europe are at a standstill. Companies in the toy drones market are experimenting with new ways to change by utilizing the advantages of UAVs.
Toy Drones Market, By Geography
· North America (US & Canada)
· Europe (UK, Germany, France, Italy, Spain, Russia & Rest of Europe)
· Asia-Pacific (Japan, China, India, Australia, & South Korea, & Rest of Asia-Pacific)
· LAMEA (Brazil, Saudi Arabia, UAE & Rest of LAMEA)
Toy Drones Market, Key Players
· Aerix Drones
· AeroVironment, Inc.
· DJI
· Drona Aviation Pvt. Ltd
· Extreme Fliers
· Guangdong Cheerson Hobby Technology Co., Ltd
· Horizon Hobby LLC
· Jianjian Technology Co., Ltd
· Parrot Drones SAS
· Shenzhen Hubsan Technology Company Limited
· Skyrocket LLC
· Syma
· TRNDlabs
· Udirc Technology Co., Ltd
· Weili Toys
· XK Industrial Co., Ltd.
Frequently Asked Questions (FAQ) :
Q1. What are the driving factors for the Toy Drones market?
Government investments are steadily increasing due to the expanding use of toy drones in a variety of industries. This is one of the key factors that boost the growth of the global Toy Drones market
Q2. Which Segments are covered in the Toy Drones Market report?
Product Type, Application, and Region. these segments are covered in the Toy Drones market report.
Q3. Which segment is projected to hold the largest share in the Toy Drones Market?
Videography & photography segment is projected to hold the largest share in the Toy Drones Market.
Q4. Which region is holds largest share in the Toy Drones market?
North America held largest share in the global Toy Drones market
Q5. Which are the prominent players in the Toy Drones Market?
Aerix Drones, AeroVironment, Inc., DJI, Drona Aviation Pvt. Ltd, Extreme Fliers, Guangdong Cheerson Hobby Technology Co., Ltd, Horizon Hobby LLC, Jianjian Technology Co., Ltd, Parrot Drones SAS, Shenzhen Hubsan Technology Company Limited, Skyrocket LLC, Syma, TRNDlabs, Udirc Technology Co., Ltd, Weili Toys, XK Industrial Co., Ltd. are some key players in the Toy Drones Market
List of Figures
Figure 1: Global Toy Drones Market Revenue Breakdown (USD Billion, %) by Region, 2019 & 2027
Figure 2: Global Market Value Share (%), By Segment 1, 2019 & 2027
Figure 3: Global Market Forecast (USD Billion), by Sub-Segment 1, 2016-2027
Figure 4: Global Market Forecast (USD Billion), by Sub-Segment 2, 2016-2027
Figure 5: Global Market Value Share (%), By Segment 2, 2019 & 2027
Figure 6: Global Market Forecast (USD Billion), by Sub-Segment 1, 2016-2027
Figure 7: Global Market Forecast (USD Billion), by Sub-Segment 2, 2016-2027
Figure 8: Global Market Forecast (USD Billion), by Sub-Segment 3, 2016-2027
Figure 9: Global Toy Drones Market Forecast (USD Billion), by Others, 2016-2027
Figure 10: Global Market Value Share (%), By Segment 3, 2019 & 2027
Figure 11: Global Market Forecast (USD Billion), by Sub-Segment 1, 2016-2027
Figure 12: Global Market Forecast (USD Billion), by Sub-Segment 2, 2016-2027
Figure 13: Global Market Forecast (USD Billion), by Sub-Segment 3, 2016-2027
Figure 14: Global Market Forecast (USD Billion), by Others, 2016-2027
Figure 15: Global Market Value (USD Billion), by Region, 2019 & 2027
Figure 16: North America Toy Drones Market Value Share (%), By Segment 1, 2019 & 2027
Figure 17: North America Market Forecast (USD Billion), by Sub-Segment 1, 2016-2027
Figure 18: North America Market Forecast (USD Billion), by Sub-Segment 2, 2016-2027
Figure 19: North America Market Value Share (%), By Segment 2, 2019 & 2027
Figure 20: North America Market Forecast (USD Billion), by Sub-Segment 1, 2016-2027
Figure 21: North America Market Forecast (USD Billion), by Sub-Segment 2, 2016-2027
Figure 22: North America Market Forecast (USD Billion), by Sub-Segment 3, 2016-2027
Figure 23: North America Market Forecast (USD Billion), by Others, 2016-2027
Figure 24: North America Market Value Share (%), By Segment 3, 2019 & 2027
Figure 25: North America Market Forecast (USD Billion), by Sub-Segment 1, 2016-2027
Figure 26: North America Market Forecast (USD Billion), by Sub-Segment 2, 2016-2027
Figure 27: North America Market Forecast (USD Billion), by Sub-Segment 3, 2016-2027
Figure 28: North America Market Forecast (USD Billion), by Others, 2016-2027
Figure 29: North America Market Forecast (USD Billion), by U.S., 2016-2027
Figure 30: North America Market Forecast (USD Billion), by Canada, 2016-2027
Figure 31: Latin America Toy Drones Market Value Share (%), By Segment 1, 2019 & 2027
Figure 32: Latin America Market Forecast (USD Billion), by Sub-Segment 1, 2016-2027
Figure 33: Latin America Market Forecast (USD Billion), by Sub-Segment 2, 2016-2027
Figure 34: Latin America Market Value Share (%), By Segment 2, 2019 & 2027
Figure 35: Latin America Market Forecast (USD Billion), by Sub-Segment 1, 2016-2027
Figure 36: Latin America Market Forecast (USD Billion), by Sub-Segment 2, 2016-2027
Figure 37: Latin America Market Forecast (USD Billion), by Sub-Segment 3, 2016-2027
Figure 38: Latin America Market Forecast (USD Billion), by Others, 2016-2027
Figure 39: Latin America Market Value Share (%), By Segment 3, 2019 & 2027
Figure 40: Latin America Market Forecast (USD Billion), by Sub-Segment 1, 2016-2027
Figure 41: Latin America Market Forecast (USD Billion), by Sub-Segment 2, 2016-2027
Figure 42: Latin America Market Forecast (USD Billion), by Sub-Segment 3, 2016-2027
Figure 43: Latin America Market Forecast (USD Billion), by Others, 2016-2027
Figure 44: Latin America Market Forecast (USD Billion), by Brazil, 2016-2027
Figure 45: Latin America Market Forecast (USD Billion), by Mexico, 2016-2027
Figure 46: Latin America Market Forecast (USD Billion), by Rest of Latin America, 2016-2027
Figure 47: Europe Toy Drones Market Value Share (%), By Segment 1, 2019 & 2027
Figure 48: Europe Market Forecast (USD Billion), by Sub-Segment 1, 2016-2027
Figure 49: Europe Market Forecast (USD Billion), by Sub-Segment 2, 2016-2027
Figure 50: Europe Market Value Share (%), By Segment 2, 2019 & 2027
Figure 51: Europe Market Forecast (USD Billion), by Sub-Segment 1, 2016-2027
Figure 52: Europe Market Forecast (USD Billion), by Sub-Segment 2, 2016-2027
Figure 53: Europe Market Forecast (USD Billion), by Sub-Segment 3, 2016-2027
Figure 54: Europe Market Forecast (USD Billion), by Others, 2016-2027
Figure 55: Europe Market Value Share (%), By Segment 3, 2019 & 2027
Figure 56: Europe Market Forecast (USD Billion), by Sub-Segment 1, 2016-2027
Figure 57: Europe Market Forecast (USD Billion), by Sub-Segment 2, 2016-2027
Figure 58: Europe Market Forecast (USD Billion), by Sub-Segment 3, 2016-2027
Figure 59: Europe Market Forecast (USD Billion), by Others, 2016-2027
Figure 60: Europe Market Forecast (USD Billion), by U.K., 2016-2027
Figure 61: Europe Market Forecast (USD Billion), by Germany, 2016-2027
Figure 62: Europe Market Forecast (USD Billion), by France, 2016-2027
Figure 63: Europe Market Forecast (USD Billion), by Italy, 2016-2027
Figure 64: Europe Market Forecast (USD Billion), by Spain, 2016-2027
Figure 65: Europe Market Forecast (USD Billion), by Russia, 2016-2027
Figure 66: Europe Market Forecast (USD Billion), by Rest of Europe, 2016-2027
Figure 67: Asia Pacific Toy Drones Market Value Share (%), By Segment 1, 2019 & 2027
Figure 68: Asia Pacific Market Forecast (USD Billion), by Sub-Segment 1, 2016-2027
Figure 69: Asia Pacific Market Forecast (USD Billion), by Sub-Segment 2, 2016-2027
Figure 70: Asia Pacific Market Value Share (%), By Segment 2, 2019 & 2027
Figure 71: Asia Pacific Market Forecast (USD Billion), by Sub-Segment 1, 2016-2027
Figure 72: Asia Pacific Market Forecast (USD Billion), by Sub-Segment 2, 2016-2027
Figure 73: Asia Pacific Market Forecast (USD Billion), by Sub-Segment 3, 2016-2027
Figure 74: Asia Pacific Market Forecast (USD Billion), by Others, 2016-2027
Figure 75: Asia Pacific Market Value Share (%), By Segment 3, 2019 & 2027
Figure 76: Asia Pacific Market Forecast (USD Billion), by Sub-Segment 1, 2016-2027
Figure 77: Asia Pacific Market Forecast (USD Billion), by Sub-Segment 2, 2016-2027
Figure 78: Asia Pacific Market Forecast (USD Billion), by Sub-Segment 3, 2016-2027
Figure 79: Asia Pacific Market Forecast (USD Billion), by Others, 2016-2027
Figure 80: Asia Pacific Market Forecast (USD Billion), by China, 2016-2027
Figure 81: Asia Pacific Market Forecast (USD Billion), by India, 2016-2027
Figure 82: Asia Pacific Market Forecast (USD Billion), by Japan, 2016-2027
Figure 83: Asia Pacific Market Forecast (USD Billion), by Australia, 2016-2027
Figure 84: Asia Pacific Market Forecast (USD Billion), by Southeast Asia, 2016-2027
Figure 85: Asia Pacific Market Forecast (USD Billion), by Rest of Asia Pacific, 2016-2027
Figure 86: Middle East & Africa Toy Drones Market Value Share (%), By Segment 1, 2019 & 2027
Figure 87: Middle East & Africa Market Forecast (USD Billion), by Sub-Segment 1, 2016-2027
Figure 88: Middle East & Africa Market Forecast (USD Billion), by Sub-Segment 2, 2016-2027
Figure 89: Middle East & Africa Market Value Share (%), By Segment 2, 2019 & 2027
Figure 90: Middle East & Africa Market Forecast (USD Billion), by Sub-Segment 1, 2016-2027
Figure 91: Middle East & Africa Market Forecast (USD Billion), by Sub-Segment 2, 2016-2027
Figure 92: Middle East & Africa Market Forecast (USD Billion), by Sub-Segment 3, 2016-2027
Figure 93: Middle East & Africa Market Forecast (USD Billion), by Others, 2016-2027
Figure 94: Middle East & Africa Market Value Share (%), By Segment 3, 2019 & 2027
Figure 95: Middle East & Africa Market Forecast (USD Billion), by Sub-Segment 1, 2016-2027
Figure 96: Middle East & Africa Market Forecast (USD Billion), by Sub-Segment 2, 2016-2027
Figure 97: Middle East & Africa Market Forecast (USD Billion), by Sub-Segment 3, 2016-2027
Figure 98: Middle East & Africa Market Forecast (USD Billion), by Others, 2016-2027
Figure 99: Middle East & Africa Market Forecast (USD Billion), by GCC, 2016-2027
Figure 100: Middle East & Africa Market Forecast (USD Billion), by South Africa, 2016-2027
Figure 101: Middle East & Africa Market Forecast (USD Billion), by Rest of Middle East & Africa, 2016-2027
List of Tables
Table 1: Global Toy Drones Market Revenue (USD Billion) Forecast, by Segment 1, 2016-2027
Table 2: Global Market Revenue (USD Billion) Forecast, by Segment 2, 2016-2027
Table 3: Global Market Revenue (USD Billion) Forecast, by Segment 3, 2016-2027
Table 4: Global Market Revenue (USD Billion) Forecast, by Region, 2016-2027
Table 5: North America Toy Drones Market Revenue (USD Billion) Forecast, by Segment 1, 2016-2027
Table 6: North America Market Revenue (USD Billion) Forecast, by Segment 2, 2016-2027
Table 7: North America Market Revenue (USD Billion) Forecast, by Segment 3, 2016-2027
Table 8: North America Market Revenue (USD Billion) Forecast, by Country, 2016-2027
Table 9: Europe Toy Drones Market Revenue (USD Billion) Forecast, by Segment 1, 2016-2027
Table 10: Europe Market Revenue (USD Billion) Forecast, by Segment 2, 2016-2027
Table 11: Europe Market Revenue (USD Billion) Forecast, by Segment 3, 2016-2027
Table 12: Europe Market Revenue (USD Billion) Forecast, by Country, 2016-2027
Table 13: Latin America Toy Drones Market Revenue (USD Billion) Forecast, by Segment 1, 2016-2027
Table 14: Latin America Market Revenue (USD Billion) Forecast, by Segment 2, 2016-2027
Table 15: Latin America Market Revenue (USD Billion) Forecast, by Segment 3, 2016-2027
Table 16: Latin America Market Revenue (USD Billion) Forecast, by Country, 2016-2027
Table 17: Asia Pacific Toy Drones Market Revenue (USD Billion) Forecast, by Segment 1, 2016-2027
Table 18: Asia Pacific Market Revenue (USD Billion) Forecast, by Segment 2, 2016-2027
Table 19: Asia Pacific Market Revenue (USD Billion) Forecast, by Segment 3, 2016-2027
Table 20: Asia Pacific Market Revenue (USD Billion) Forecast, by Country, 2016-2027
Table 21: Middle East & Africa Toy Drones Market Revenue (USD Billion) Forecast, by Segment 1, 2016-2027
Table 22: Middle East & Africa Market Revenue (USD Billion) Forecast, by Segment 2, 2016-2027
Table 23: Middle East & Africa Market Revenue (USD Billion) Forecast, by Segment 3, 2016-2027
Table 24: Middle East & Africa Market Revenue (USD Billion) Forecast, by Country, 2016-2027
Research Process
Data Library Research are conducted by industry experts who offer insight on
industry structure, market segmentations technology assessment and competitive landscape (CL), and penetration, as well as on emerging trends. Their analysis is based on primary interviews (~ 80%) and secondary research (~ 20%) as well as years of professional expertise in their respective industries. Adding to this, by analysing historical trends and current market positions, our analysts predict where the market will be headed for the next five years. Furthermore, the varying trends of segment & categories geographically presented are also studied and the estimated based on the primary & secondary research.
In this particular report from the supply side Data Library Research has conducted primary surveys (interviews) with the key level executives (VP, CEO’s, Marketing Director, Business Development Manager
and SOFT) of the companies that active & prominent as well as the midsized organization
FIGURE 1: DLR RESEARH PROCESS
![research-methodology1]()
Primary Research
Extensive primary research was conducted to gain a deeper insight of the market and industry performance. The analysis is based on both primary and secondary research as well as years of professional expertise in the respective industries.
In addition to analysing current and historical trends, our analysts predict where the market is headed over the next five years.
It varies by segment for these categories geographically presented in the list of market tables. Speaking about this particular report we have conducted primary surveys (interviews) with the key level executives (VP, CEO’s, Marketing Director, Business Development Manager and many more) of the major players active in the market.
Secondary Research
Secondary research was mainly used to collect and identify information useful for the extensive, technical, market-oriented, and Friend’s study of the Global Extra Neutral Alcohol. It was also used to obtain key information about major players, market classification and segmentation according to the industry trends, geographical markets, and developments related to the market and technology perspectives. For this study, analysts have gathered information from various credible sources, such as annual reports, sec filings, journals, white papers, SOFT presentations, and company web sites.
Market Size Estimation
Both, top-down and bottom-up approaches were used to estimate and validate the size of the Global market and to estimate the size of various other dependent submarkets in the overall Extra Neutral Alcohol. The key players in the market were identified through secondary research and their market contributions in the respective geographies were determined through primary and secondary research.
Forecast Model
![research-methodology2]()