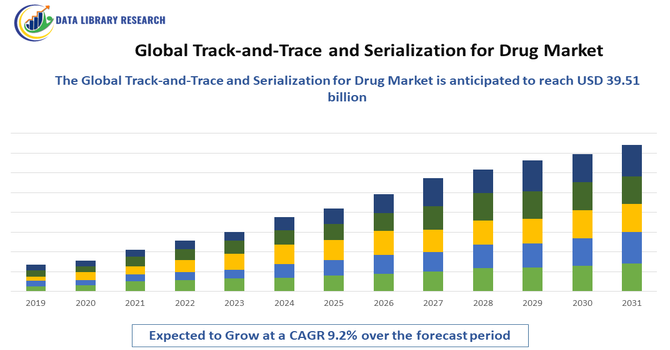
Track-and-Trace and Serialization for Drug Market Overview and Analysis
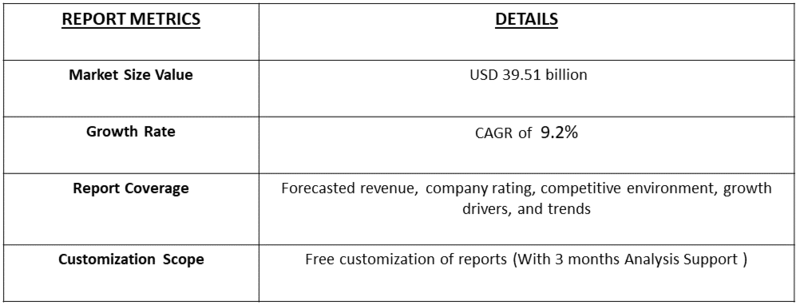
- The Global Track-and-Trace and Serialization for Drug size is calculated at USD 8.34 billion in 2025 and is forecasted to reach around USD 39.51 billion by 2034, growing with a CAGR of 9.2% from 2025 to 2032.
Get Complete Analysis Of The Report - Download Updated Free Sample PDF
The Global Track-and-Trace and Serialization for Drug Market is witnessing strong growth driven by increasing regulatory mandates aimed at combating counterfeit medicines and ensuring drug safety across the pharmaceutical supply chain. Governments and regulatory authorities worldwide are enforcing strict serialization and traceability requirements to enhance transparency, patient safety, and supply chain integrity. Rising incidents of counterfeit and substandard drugs are compelling pharmaceutical manufacturers to adopt advanced track-and-trace solutions. Additionally, the growing complexity of global pharmaceutical supply chains, coupled with the expansion of biologics and specialty drugs, is accelerating demand for robust serialization systems.
Track-and-Trace and Serialization for the Drug Market: Latest Trends
The Global Track-and-Trace and Serialization for Drug Market is evolving rapidly with several key trends shaping its future. A major trend is the integration of blockchain technology to create immutable, decentralized records that enhance transparency and prevent data tampering across the pharmaceutical supply chain. This is complemented by the growing use of RFID and IoT-enabled sensors, which enable real-time tracking of drug products from manufacturing facilities to end-users, improving visibility and reducing loss or diversion. Cloud-based serialization platforms are gaining traction for their scalability and ability to support global compliance with evolving regulatory standards. AI and data analytics are increasingly being deployed to detect anomalies, forecast risks, and optimize supply chain operations.
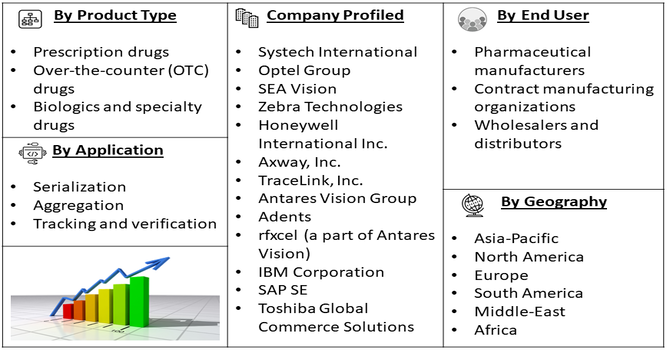
Segmentation: Global Track-and-Trace and Serialization for Drug Market is segmented By Technology (Barcode and 2D Data Matrix systems, Radio Frequency Identification, Blockchain-based traceability solutions), Component (Software solutions, Hardware, Services), Application (Serialization, Aggregation, Tracking and verification), End User (Pharmaceutical manufacturers, Contract manufacturing organizations, Wholesalers and distributors), Drug Type (Prescription drugs, Over-the-counter (OTC) drugs, Biologics and specialty drugs), and Geography (North America, Europe, Asia-Pacific, Middle East and Africa, and South America). The report provides the value (in USD million) for the above segments.
For Detailed Market Segmentation - Get a Free Sample PDF
Market Drivers:
- Increasing Regulatory Mandates for Drug Safety and Anti-Counterfeiting
One of the primary drivers of the Global Track-and-Trace and Serialization for Drug Market is the growing emphasis on regulatory compliance to combat counterfeit and substandard drugs. Governments and health authorities worldwide, including the U.S. FDA’s Drug Supply Chain Security Act (DSCSA) and the EU Falsified Medicines Directive (FMD), are mandating serialization and traceability measures to ensure drug safety and integrity throughout the supply chain.
These regulations require pharmaceutical manufacturers, distributors, and pharmacies to adopt track-and-trace solutions that provide unique identification codes, aggregation, and real-time verification capabilities. The increasing enforcement of penalties for non-compliance, coupled with rising consumer awareness about drug authenticity, is compelling pharmaceutical companies to invest in advanced serialization systems, driving sustained market growth globally.
- Rising Incidence of Counterfeit and Substandard Drugs
The proliferation of counterfeit and substandard drugs in the global pharmaceutical market is a significant driver for the adoption of track-and-trace and serialization solutions. Counterfeit medications not only pose severe health risks to patients but also result in financial losses for pharmaceutical companies. Increasing complexity and globalization of supply chains, with multiple intermediaries and cross-border shipments, make it challenging to monitor product authenticity effectively. Track-and-trace solutions, including barcode scanning, RFID tagging, and blockchain-enabled systems, allow real-time verification and monitoring of drugs from manufacturing to end-users. Growing awareness among manufacturers, healthcare providers, and regulators about patient safety and brand protection is accelerating the deployment of these technologies across the pharmaceutical industry.
Market Restraints:
- High Implementation and Maintenance Costs
The key restraints for the Global Track-and-Trace and Serialization for Drug Market is the high cost associated with deploying and maintaining these systems. Implementing serialization requires investments in specialized hardware, such as printers, scanners, and RFID tags, along with software platforms capable of handling massive volumes of data. Additionally, integration with existing enterprise resource planning (ERP) systems, supply chain management tools, and cloud infrastructure can be expensive and complex. Ongoing maintenance, system updates, staff training, and compliance auditing further add to operational costs. Smaller pharmaceutical companies or those operating in cost-sensitive markets may find these expenses prohibitive, limiting widespread adoption and slowing overall market growth.
Socioeconomic Impact on Track-and-Trace and Serialization for the Drug Market
The Global Track-and-Trace and Serialization for Drug Market has had significant socioeconomic impacts by enhancing pharmaceutical safety, regulatory compliance, and supply chain transparency. By preventing counterfeit drugs and ensuring authenticity, it protects public health and reduces healthcare costs associated with substandard medications. The market has created employment opportunities in technology development, software solutions, packaging, and regulatory consulting, stimulating economic activity across multiple sectors. Improved traceability strengthens patient trust, supports efficient inventory management, and minimizes drug shortages. However, implementation costs can challenge smaller manufacturers, highlighting the need for equitable access to serialization technologies. Thus, the market advances healthcare security, operational efficiency, and global pharmaceutical accountability.
Segmental Analysis:
- Barcode and 2D Data Matrix Systems segment is expected to witness the highest growth over the forecast period
Barcode and 2D Data Matrix systems represent a core technology segment in the Global Track-and-Trace and Serialization for Drug Market. These systems provide unique identifiers for individual drug packages, enabling accurate tracking and verification throughout the supply chain. 2D Data Matrix codes are particularly favored due to their high data density, ability to store multiple data points, and resistance to scanning errors in complex packaging environments. They support serialization, aggregation, and authentication of pharmaceutical products, helping manufacturers and regulators prevent counterfeit drugs. The widespread adoption of barcode technology is driven by its cost-effectiveness, ease of implementation, and compatibility with existing scanning infrastructure, making it a critical tool for compliance with global regulatory mandates.
- Software Solutions segment is expected to witness the highest growth over the forecast period
Software solutions are essential for managing serialization and track-and-trace operations effectively. These platforms allow pharmaceutical companies to generate unique identifiers, maintain databases of serialized products, and monitor the movement of drugs across the supply chain. Advanced software integrates with enterprise resource planning (ERP) systems, supports reporting to regulatory authorities, and facilitates real-time verification and recall management. Cloud-based solutions are increasingly adopted for scalability, data security, and remote accessibility. By providing analytics, alerts, and compliance management features, software solutions enhance operational efficiency and ensure adherence to stringent regulatory standards. The growing complexity of pharmaceutical supply chains drives the strong demand for robust serialization software globally.
- Serialization segment is expected to witness the highest growth over the forecast period
Serialization is the primary application of track-and-trace technologies, involving the assignment of a unique identification code to each pharmaceutical product. This process enables verification of authenticity, tracking throughout distribution, and prevention of counterfeiting or diversion. Serialization also facilitates regulatory reporting and compliance with global standards such as the EU Falsified Medicines Directive and U.S. DSCSA. It enhances patient safety by ensuring that only verified medications reach end-users. Rising adoption of serialization across prescription drugs, biologics, and specialty medications is driven by increasing regulatory enforcement, growing global pharmaceutical trade, and the need for greater supply chain transparency, making it a key growth driver for the market.
- Pharmaceutical Manufacturers segment is expected to witness the highest growth over the forecast period
Pharmaceutical manufacturers represent the largest end-user segment in the global track-and-trace and serialization market. These companies are responsible for producing, labeling, and distributing serialized products to comply with regulatory standards and protect their brand from counterfeiting. Manufacturers implement end-to-end track-and-trace solutions, integrating software, hardware, and services to monitor each stage of the supply chain, from production to distribution. Investments in automated serialization lines, aggregation tools, and real-time verification systems enable manufacturers to meet compliance deadlines efficiently. The increasing complexity of global supply chains, expansion of biologics and specialty drugs, and rising regulatory pressures are driving robust adoption among pharmaceutical manufacturers worldwide.
- Prescription Drugs segment is expected to witness the highest growth over the forecast period
Prescription drugs form the dominant segment of the Global Track-and-Trace and Serialization for Drug Market, owing to their high regulatory scrutiny and critical importance to patient safety. These drugs require stringent monitoring to prevent counterfeiting, ensure proper storage, and maintain traceability throughout the supply chain. Serialization and track-and-trace solutions provide unique identifiers for each package, enabling verification at multiple checkpoints. As the volume of prescription drug consumption rises globally and regulatory frameworks tighten, pharmaceutical manufacturers are increasingly deploying advanced technologies such as barcode systems, RFID, and blockchain to secure distribution. This segment continues to drive significant market growth due to its regulatory significance and volume.
- North America segment is expected to witness the highest growth over the forecast period
North America is expected to hold a leading position in the Global Track-and-Trace and Serialization for Drug Market due to stringent regulatory frameworks and high adoption of advanced technologies. The U.S. Drug Supply Chain Security Act (DSCSA) mandates end-to-end serialization and verification, compelling manufacturers, distributors, and pharmacies to implement robust track-and-trace solutions.
In November 2023, Unicommerce, launched UniShip, an end-to-end post-order journey solution. UniShip streamlines shipment tracking, optimizes courier partner allocation, and efficiently manages orders en route to buyers, returns, and undelivered shipments, providing D2C brands and online merchants with enhanced operational efficiency and customer satisfaction.
The region’s well-established pharmaceutical industry, high healthcare expenditure, and presence of leading technology providers support rapid adoption. Integration of IoT, blockchain, and cloud-based platforms for real-time monitoring enhances supply chain efficiency and security. Growing awareness of counterfeit drug risks and the need for regulatory compliance continue to drive market expansion in North America.
To Learn More About This Report - Request a Free Sample Copy
Track-and-Trace and Serialization for Drug Market Competitive Landscape:
The competitive landscape of the Global Track and Trace and Serialization for Drug Market is marked by the presence of global technology providers, specialized supply chain solution vendors, and pharmaceutical compliance service firms. Competition is primarily driven by product innovation, regulatory compliance capabilities, integration flexibility with existing enterprise systems, and regional service reach. Additionally, mergers and acquisitions, geographic expansion, product portfolio enhancements, and tailored service offerings remain key strategies to gain competitive edge. Demand for interoperable and scalable solutions that support global serialization mandates is further intensifying competition, making solution reliability and global regulatory knowledge significant differentiators in the market.
The major players for above market:
- Systech International
- Optel Group
- SEA Vision
- Zebra Technologies
- Honeywell International Inc.
- Axway, Inc.
- TraceLink, Inc.
- Antares Vision Group
- Adents
- rfxcel (a part of Antares Vision)
- IBM Corporation
- SAP SE
- Toshiba Global Commerce Solutions
- ENGAGE Healthcare Communications
- Adisys
- Rockwell Automation
- NICE Systems Ltd.
- Berlinger & Co. AG
- Codesoft (TEKLYNX)
- Veratad Technologies
Recent Development
- In October 2024, Multi-Color Corporation (MCC), a leading global label manufacturer, acquired Starport Technologies, a Kansas City-based provider of smart labeling solutions. The acquisition aimed to enhance MCC’s RFID capabilities and expand its portfolio of intelligent packaging solutions, strengthening its position in the growing market for advanced, technology-driven labeling and product tracking.
- In July 2023, ID TECH, a leading RFID solutions provider, launched the IDT 87 IN RFID Integrated Reader. Designed and manufactured domestically, this advanced device delivers cutting-edge performance, a sleek design, and enhanced functionality, establishing a new standard for track-and-trace solutions and reinforcing ID TECH’s leadership in the RFID technology market.
Frequently Asked Questions (FAQ) :
Q1. What are the main growth-driving factors for this market?
The primary driver is the urgent need to combat counterfeit medicines, which pose a massive threat to patient safety worldwide. Governments are implementing strict laws, like the DSCSA in the U.S., requiring every pill bottle to have a unique code. Additionally, the shift toward digital supply chains allows for better inventory management.
Q2. What are the main restraining factors for this market?
Growth is limited by the high cost of installing complex scanning hardware and software on existing production lines. Small pharmaceutical companies often struggle with the technical expertise required to manage massive amounts of data. Furthermore, a lack of unified global standards makes it difficult for companies to trade across different borders.
Q3. Which segment is expected to witness high growth?
The Software Solutions segment is expected to see the highest growth. While hardware is necessary to print codes, sophisticated software is needed to track that data from the factory to the pharmacy. As cloud-based platforms become more popular, they offer scalable ways for companies to manage real-time tracking and regulatory reporting.
Q4. Who are the top major players for this market?
The market is led by global technology leaders and specialized packaging firms. Key players include TraceLink, SAP SE, Körber Medipak Systems, OPTEL Group, and Antares Vision. These companies dominate by providing "end-to-end" platforms that connect manufacturers, distributors, and hospitals into a single, secure network to ensure medicine authenticity.
Q5. Which country is the largest player?
The United States is the largest player in the track-and-trace and serialization market. This dominance is due to the strict enforcement of the Drug Supply Chain Security Act (DSCSA) and a highly advanced pharmaceutical sector. The presence of major software innovators and a massive domestic drug market keep the U.S. ahead.
List of Figures
Figure 1: Global Track-and-Trace and Serialization for Drug Market Revenue Breakdown (USD Billion, %) by Region, 2022 & 2029
Figure 2: Global Track-and-Trace and Serialization for Drug Market Value Share (%), By Segment 1, 2022 & 2029
Figure 3: Global Track-and-Trace and Serialization for Drug Market Forecast (USD Billion), by Sub-Segment 1, 2018-2029
Figure 4: Global Track-and-Trace and Serialization for Drug Market Forecast (USD Billion), by Sub-Segment 2, 2018-2029
Figure 5: Global Track-and-Trace and Serialization for Drug Market Value Share (%), By Segment 2, 2022 & 2029
Figure 6: Global Track-and-Trace and Serialization for Drug Market Forecast (USD Billion), by Sub-Segment 1, 2018-2029
Figure 7: Global Track-and-Trace and Serialization for Drug Market Forecast (USD Billion), by Sub-Segment 2, 2018-2029
Figure 8: Global Track-and-Trace and Serialization for Drug Market Forecast (USD Billion), by Sub-Segment 3, 2018-2029
Figure 9: Global Track-and-Trace and Serialization for Drug Market Forecast (USD Billion), by Others, 2018-2029
Figure 10: Global Track-and-Trace and Serialization for Drug Market Value Share (%), By Segment 3, 2022 & 2029
Figure 11: Global Track-and-Trace and Serialization for Drug Market Forecast (USD Billion), by Sub-Segment 1, 2018-2029
Figure 12: Global Track-and-Trace and Serialization for Drug Market Forecast (USD Billion), by Sub-Segment 2, 2018-2029
Figure 13: Global Track-and-Trace and Serialization for Drug Market Forecast (USD Billion), by Sub-Segment 3, 2018-2029
Figure 14: Global Track-and-Trace and Serialization for Drug Market Forecast (USD Billion), by Others, 2018-2029
Figure 15: Global Track-and-Trace and Serialization for Drug Market Value (USD Billion), by Region, 2022 & 2029
Figure 16: North America Track-and-Trace and Serialization for Drug Market Value Share (%), By Segment 1, 2022 & 2029
Figure 17: North America Track-and-Trace and Serialization for Drug Market Forecast (USD Billion), by Sub-Segment 1, 2018-2029
Figure 18: North America Track-and-Trace and Serialization for Drug Market Forecast (USD Billion), by Sub-Segment 2, 2018-2029
Figure 19: North America Track-and-Trace and Serialization for Drug Market Value Share (%), By Segment 2, 2022 & 2029
Figure 20: North America Track-and-Trace and Serialization for Drug Market Forecast (USD Billion), by Sub-Segment 1, 2018-2029
Figure 21: North America Track-and-Trace and Serialization for Drug Market Forecast (USD Billion), by Sub-Segment 2, 2018-2029
Figure 22: North America Track-and-Trace and Serialization for Drug Market Forecast (USD Billion), by Sub-Segment 3, 2018-2029
Figure 23: North America Track-and-Trace and Serialization for Drug Market Forecast (USD Billion), by Others, 2018-2029
Figure 24: North America Track-and-Trace and Serialization for Drug Market Value Share (%), By Segment 3, 2022 & 2029
Figure 25: North America Track-and-Trace and Serialization for Drug Market Forecast (USD Billion), by Sub-Segment 1, 2018-2029
Figure 26: North America Track-and-Trace and Serialization for Drug Market Forecast (USD Billion), by Sub-Segment 2, 2018-2029
Figure 27: North America Track-and-Trace and Serialization for Drug Market Forecast (USD Billion), by Sub-Segment 3, 2018-2029
Figure 28: North America Track-and-Trace and Serialization for Drug Market Forecast (USD Billion), by Others, 2018-2029
Figure 29: North America Track-and-Trace and Serialization for Drug Market Forecast (USD Billion), by U.S., 2018-2029
Figure 30: North America Track-and-Trace and Serialization for Drug Market Forecast (USD Billion), by Canada, 2018-2029
Figure 31: Latin America Track-and-Trace and Serialization for Drug Market Value Share (%), By Segment 1, 2022 & 2029
Figure 32: Latin America Track-and-Trace and Serialization for Drug Market Forecast (USD Billion), by Sub-Segment 1, 2018-2029
Figure 33: Latin America Track-and-Trace and Serialization for Drug Market Forecast (USD Billion), by Sub-Segment 2, 2018-2029
Figure 34: Latin America Track-and-Trace and Serialization for Drug Market Value Share (%), By Segment 2, 2022 & 2029
Figure 35: Latin America Track-and-Trace and Serialization for Drug Market Forecast (USD Billion), by Sub-Segment 1, 2018-2029
Figure 36: Latin America Track-and-Trace and Serialization for Drug Market Forecast (USD Billion), by Sub-Segment 2, 2018-2029
Figure 37: Latin America Track-and-Trace and Serialization for Drug Market Forecast (USD Billion), by Sub-Segment 3, 2018-2029
Figure 38: Latin America Track-and-Trace and Serialization for Drug Market Forecast (USD Billion), by Others, 2018-2029
Figure 39: Latin America Track-and-Trace and Serialization for Drug Market Value Share (%), By Segment 3, 2022 & 2029
Figure 40: Latin America Track-and-Trace and Serialization for Drug Market Forecast (USD Billion), by Sub-Segment 1, 2018-2029
Figure 41: Latin America Track-and-Trace and Serialization for Drug Market Forecast (USD Billion), by Sub-Segment 2, 2018-2029
Figure 42: Latin America Track-and-Trace and Serialization for Drug Market Forecast (USD Billion), by Sub-Segment 3, 2018-2029
Figure 43: Latin America Track-and-Trace and Serialization for Drug Market Forecast (USD Billion), by Others, 2018-2029
Figure 44: Latin America Track-and-Trace and Serialization for Drug Market Forecast (USD Billion), by Brazil, 2018-2029
Figure 45: Latin America Track-and-Trace and Serialization for Drug Market Forecast (USD Billion), by Mexico, 2018-2029
Figure 46: Latin America Track-and-Trace and Serialization for Drug Market Forecast (USD Billion), by Rest of Latin America, 2018-2029
Figure 47: Europe Track-and-Trace and Serialization for Drug Market Value Share (%), By Segment 1, 2022 & 2029
Figure 48: Europe Track-and-Trace and Serialization for Drug Market Forecast (USD Billion), by Sub-Segment 1, 2018-2029
Figure 49: Europe Track-and-Trace and Serialization for Drug Market Forecast (USD Billion), by Sub-Segment 2, 2018-2029
Figure 50: Europe Track-and-Trace and Serialization for Drug Market Value Share (%), By Segment 2, 2022 & 2029
Figure 51: Europe Track-and-Trace and Serialization for Drug Market Forecast (USD Billion), by Sub-Segment 1, 2018-2029
Figure 52: Europe Track-and-Trace and Serialization for Drug Market Forecast (USD Billion), by Sub-Segment 2, 2018-2029
Figure 53: Europe Track-and-Trace and Serialization for Drug Market Forecast (USD Billion), by Sub-Segment 3, 2018-2029
Figure 54: Europe Track-and-Trace and Serialization for Drug Market Forecast (USD Billion), by Others, 2018-2029
Figure 55: Europe Track-and-Trace and Serialization for Drug Market Value Share (%), By Segment 3, 2022 & 2029
Figure 56: Europe Track-and-Trace and Serialization for Drug Market Forecast (USD Billion), by Sub-Segment 1, 2018-2029
Figure 57: Europe Track-and-Trace and Serialization for Drug Market Forecast (USD Billion), by Sub-Segment 2, 2018-2029
Figure 58: Europe Track-and-Trace and Serialization for Drug Market Forecast (USD Billion), by Sub-Segment 3, 2018-2029
Figure 59: Europe Track-and-Trace and Serialization for Drug Market Forecast (USD Billion), by Others, 2018-2029
Figure 60: Europe Track-and-Trace and Serialization for Drug Market Forecast (USD Billion), by U.K., 2018-2029
Figure 61: Europe Track-and-Trace and Serialization for Drug Market Forecast (USD Billion), by Germany, 2018-2029
Figure 62: Europe Track-and-Trace and Serialization for Drug Market Forecast (USD Billion), by France, 2018-2029
Figure 63: Europe Track-and-Trace and Serialization for Drug Market Forecast (USD Billion), by Italy, 2018-2029
Figure 64: Europe Track-and-Trace and Serialization for Drug Market Forecast (USD Billion), by Spain, 2018-2029
Figure 65: Europe Track-and-Trace and Serialization for Drug Market Forecast (USD Billion), by Russia, 2018-2029
Figure 66: Europe Track-and-Trace and Serialization for Drug Market Forecast (USD Billion), by Rest of Europe, 2018-2029
Figure 67: Asia Pacific Track-and-Trace and Serialization for Drug Market Value Share (%), By Segment 1, 2022 & 2029
Figure 68: Asia Pacific Track-and-Trace and Serialization for Drug Market Forecast (USD Billion), by Sub-Segment 1, 2018-2029
Figure 69: Asia Pacific Track-and-Trace and Serialization for Drug Market Forecast (USD Billion), by Sub-Segment 2, 2018-2029
Figure 70: Asia Pacific Track-and-Trace and Serialization for Drug Market Value Share (%), By Segment 2, 2022 & 2029
Figure 71: Asia Pacific Track-and-Trace and Serialization for Drug Market Forecast (USD Billion), by Sub-Segment 1, 2018-2029
Figure 72: Asia Pacific Track-and-Trace and Serialization for Drug Market Forecast (USD Billion), by Sub-Segment 2, 2018-2029
Figure 73: Asia Pacific Track-and-Trace and Serialization for Drug Market Forecast (USD Billion), by Sub-Segment 3, 2018-2029
Figure 74: Asia Pacific Track-and-Trace and Serialization for Drug Market Forecast (USD Billion), by Others, 2018-2029
Figure 75: Asia Pacific Track-and-Trace and Serialization for Drug Market Value Share (%), By Segment 3, 2022 & 2029
Figure 76: Asia Pacific Track-and-Trace and Serialization for Drug Market Forecast (USD Billion), by Sub-Segment 1, 2018-2029
Figure 77: Asia Pacific Track-and-Trace and Serialization for Drug Market Forecast (USD Billion), by Sub-Segment 2, 2018-2029
Figure 78: Asia Pacific Track-and-Trace and Serialization for Drug Market Forecast (USD Billion), by Sub-Segment 3, 2018-2029
Figure 79: Asia Pacific Track-and-Trace and Serialization for Drug Market Forecast (USD Billion), by Others, 2018-2029
Figure 80: Asia Pacific Track-and-Trace and Serialization for Drug Market Forecast (USD Billion), by China, 2018-2029
Figure 81: Asia Pacific Track-and-Trace and Serialization for Drug Market Forecast (USD Billion), by India, 2018-2029
Figure 82: Asia Pacific Track-and-Trace and Serialization for Drug Market Forecast (USD Billion), by Japan, 2018-2029
Figure 83: Asia Pacific Track-and-Trace and Serialization for Drug Market Forecast (USD Billion), by Australia, 2018-2029
Figure 84: Asia Pacific Track-and-Trace and Serialization for Drug Market Forecast (USD Billion), by Southeast Asia, 2018-2029
Figure 85: Asia Pacific Track-and-Trace and Serialization for Drug Market Forecast (USD Billion), by Rest of Asia Pacific, 2018-2029
Figure 86: Middle East & Africa Track-and-Trace and Serialization for Drug Market Value Share (%), By Segment 1, 2022 & 2029
Figure 87: Middle East & Africa Track-and-Trace and Serialization for Drug Market Forecast (USD Billion), by Sub-Segment 1, 2018-2029
Figure 88: Middle East & Africa Track-and-Trace and Serialization for Drug Market Forecast (USD Billion), by Sub-Segment 2, 2018-2029
Figure 89: Middle East & Africa Track-and-Trace and Serialization for Drug Market Value Share (%), By Segment 2, 2022 & 2029
Figure 90: Middle East & Africa Track-and-Trace and Serialization for Drug Market Forecast (USD Billion), by Sub-Segment 1, 2018-2029
Figure 91: Middle East & Africa Track-and-Trace and Serialization for Drug Market Forecast (USD Billion), by Sub-Segment 2, 2018-2029
Figure 92: Middle East & Africa Track-and-Trace and Serialization for Drug Market Forecast (USD Billion), by Sub-Segment 3, 2018-2029
Figure 93: Middle East & Africa Track-and-Trace and Serialization for Drug Market Forecast (USD Billion), by Others, 2018-2029
Figure 94: Middle East & Africa Track-and-Trace and Serialization for Drug Market Value Share (%), By Segment 3, 2022 & 2029
Figure 95: Middle East & Africa Track-and-Trace and Serialization for Drug Market Forecast (USD Billion), by Sub-Segment 1, 2018-2029
Figure 96: Middle East & Africa Track-and-Trace and Serialization for Drug Market Forecast (USD Billion), by Sub-Segment 2, 2018-2029
Figure 97: Middle East & Africa Track-and-Trace and Serialization for Drug Market Forecast (USD Billion), by Sub-Segment 3, 2018-2029
Figure 98: Middle East & Africa Track-and-Trace and Serialization for Drug Market Forecast (USD Billion), by Others, 2018-2029
Figure 99: Middle East & Africa Track-and-Trace and Serialization for Drug Market Forecast (USD Billion), by GCC, 2018-2029
Figure 100: Middle East & Africa Track-and-Trace and Serialization for Drug Market Forecast (USD Billion), by South Africa, 2018-2029
Figure 101: Middle East & Africa Track-and-Trace and Serialization for Drug Market Forecast (USD Billion), by Rest of Middle East & Africa, 2018-2029
List of Tables
Table 1: Global Track-and-Trace and Serialization for Drug Market Revenue (USD Billion) Forecast, by Segment 1, 2018-2029
Table 2: Global Track-and-Trace and Serialization for Drug Market Revenue (USD Billion) Forecast, by Segment 2, 2018-2029
Table 3: Global Track-and-Trace and Serialization for Drug Market Revenue (USD Billion) Forecast, by Segment 3, 2018-2029
Table 4: Global Track-and-Trace and Serialization for Drug Market Revenue (USD Billion) Forecast, by Region, 2018-2029
Table 5: North America Track-and-Trace and Serialization for Drug Market Revenue (USD Billion) Forecast, by Segment 1, 2018-2029
Table 6: North America Track-and-Trace and Serialization for Drug Market Revenue (USD Billion) Forecast, by Segment 2, 2018-2029
Table 7: North America Track-and-Trace and Serialization for Drug Market Revenue (USD Billion) Forecast, by Segment 3, 2018-2029
Table 8: North America Track-and-Trace and Serialization for Drug Market Revenue (USD Billion) Forecast, by Country, 2018-2029
Table 9: Europe Track-and-Trace and Serialization for Drug Market Revenue (USD Billion) Forecast, by Segment 1, 2018-2029
Table 10: Europe Track-and-Trace and Serialization for Drug Market Revenue (USD Billion) Forecast, by Segment 2, 2018-2029
Table 11: Europe Track-and-Trace and Serialization for Drug Market Revenue (USD Billion) Forecast, by Segment 3, 2018-2029
Table 12: Europe Track-and-Trace and Serialization for Drug Market Revenue (USD Billion) Forecast, by Country, 2018-2029
Table 13: Latin America Track-and-Trace and Serialization for Drug Market Revenue (USD Billion) Forecast, by Segment 1, 2018-2029
Table 14: Latin America Track-and-Trace and Serialization for Drug Market Revenue (USD Billion) Forecast, by Segment 2, 2018-2029
Table 15: Latin America Track-and-Trace and Serialization for Drug Market Revenue (USD Billion) Forecast, by Segment 3, 2018-2029
Table 16: Latin America Track-and-Trace and Serialization for Drug Market Revenue (USD Billion) Forecast, by Country, 2018-2029
Table 17: Asia Pacific Track-and-Trace and Serialization for Drug Market Revenue (USD Billion) Forecast, by Segment 1, 2018-2029
Table 18: Asia Pacific Track-and-Trace and Serialization for Drug Market Revenue (USD Billion) Forecast, by Segment 2, 2018-2029
Table 19: Asia Pacific Track-and-Trace and Serialization for Drug Market Revenue (USD Billion) Forecast, by Segment 3, 2018-2029
Table 20: Asia Pacific Track-and-Trace and Serialization for Drug Market Revenue (USD Billion) Forecast, by Country, 2018-2029
Table 21: Middle East & Africa Track-and-Trace and Serialization for Drug Market Revenue (USD Billion) Forecast, by Segment 1, 2018-2029
Table 22: Middle East & Africa Track-and-Trace and Serialization for Drug Market Revenue (USD Billion) Forecast, by Segment 2, 2018-2029
Table 23: Middle East & Africa Track-and-Trace and Serialization for Drug Market Revenue (USD Billion) Forecast, by Segment 3, 2018-2029
Table 24: Middle East & Africa Track-and-Trace and Serialization for Drug Market Revenue (USD Billion) Forecast, by Country, 2018-2029
Research Process
Data Library Research are conducted by industry experts who offer insight on
industry structure, market segmentations technology assessment and competitive landscape (CL), and penetration, as well as on emerging trends. Their analysis is based on primary interviews (~ 80%) and secondary research (~ 20%) as well as years of professional expertise in their respective industries. Adding to this, by analysing historical trends and current market positions, our analysts predict where the market will be headed for the next five years. Furthermore, the varying trends of segment & categories geographically presented are also studied and the estimated based on the primary & secondary research.
In this particular report from the supply side Data Library Research has conducted primary surveys (interviews) with the key level executives (VP, CEO’s, Marketing Director, Business Development Manager
and SOFT) of the companies that active & prominent as well as the midsized organization
FIGURE 1: DLR RESEARH PROCESS
![research-methodology1]()
Primary Research
Extensive primary research was conducted to gain a deeper insight of the market and industry performance. The analysis is based on both primary and secondary research as well as years of professional expertise in the respective industries.
In addition to analysing current and historical trends, our analysts predict where the market is headed over the next five years.
It varies by segment for these categories geographically presented in the list of market tables. Speaking about this particular report we have conducted primary surveys (interviews) with the key level executives (VP, CEO’s, Marketing Director, Business Development Manager and many more) of the major players active in the market.
Secondary Research
Secondary research was mainly used to collect and identify information useful for the extensive, technical, market-oriented, and Friend’s study of the Global Extra Neutral Alcohol. It was also used to obtain key information about major players, market classification and segmentation according to the industry trends, geographical markets, and developments related to the market and technology perspectives. For this study, analysts have gathered information from various credible sources, such as annual reports, sec filings, journals, white papers, SOFT presentations, and company web sites.
Market Size Estimation
Both, top-down and bottom-up approaches were used to estimate and validate the size of the Global market and to estimate the size of various other dependent submarkets in the overall Extra Neutral Alcohol. The key players in the market were identified through secondary research and their market contributions in the respective geographies were determined through primary and secondary research.
Forecast Model
![research-methodology2]()