Urothelial Cancer Treatment Market Overview and Analysis

  • The Global Urothelial Cancer Treatment Market size was valued at over USD 4.01 billion in 2025 and is expected to expand at a CAGR of around 18.5%, surpassing USD 23.21 billion revenue by 2032.

Urothelial Cancer Treatment Market

Get Complete Analysis Of The Report - Download Updated Free Sample PDF

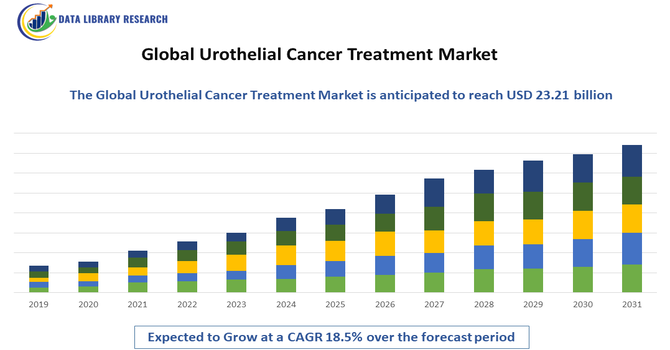
The Global Urothelial Cancer Treatment Market refers to the worldwide industry focused on developing, manufacturing, and distributing therapies for urothelial cancers, primarily affecting the bladder, ureters, and renal pelvis. It encompasses chemotherapy, immunotherapy, targeted therapy, and surgical interventions. Market growth is driven by rising cancer prevalence, advancements in personalized medicine, and innovative treatment options. Increasing healthcare infrastructure, clinical research, and awareness programs further expand the adoption of effective urothelial cancer treatments globally.

Urothelial Cancer Treatment Market Latest Trends

The Global Urothelial Cancer Treatment Market is expanding steadily due to the rising incidence of urothelial cancers, particularly bladder cancer, driven by aging populations, smoking, and environmental exposures. Adoption of immunotherapies and targeted therapies like PD 1/PD L1 inhibitors and FGFR inhibitors has transformed treatment paradigms, offering improved survival and patient outcomes. Personalized medicine and genomic profiling are guiding therapy selection, further bolstering demand. Regulatory support, such as fast track approvals, accelerates innovative drug introductions.

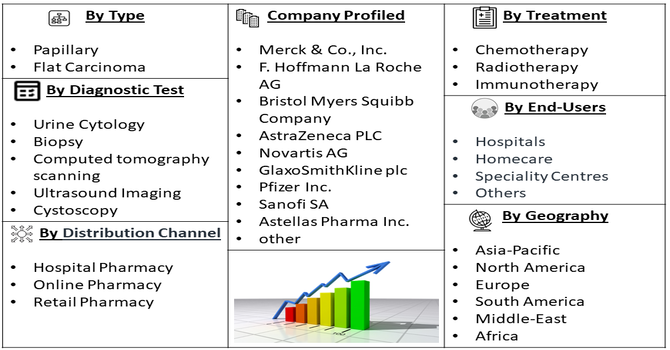
Segmentation: The Global Urothelial Cancer Treatment Market is segmented by Type (Papillary and Flat Carcinoma), Treatment (Chemotherapy, Radiotherapy and Immunotherapy), Diagnostic Test (Urine Cytology, Biopsy, Computed tomography scanning, Ultrasound Imaging, Cystoscopy and Others), End-Users (Hospitals, Homecare, Speciality Centres, Others), Distribution Channel (Hospital Pharmacy, Online Pharmacy, Retail Pharmacy) and Geography (North America, Europe, Asia-Pacific, Middle East and Africa, and South America). The report provides the value (in USD million) for the above segments.

Urothelial Cancer Treatment Market Segment

For Detailed Market Segmentation - Get a Free Sample PDF

Market Drivers:

  • Rising Incidence of Urothelial Cancer

The growing prevalence of urothelial cancers, particularly bladder cancer, is a primary driver of market growth. Factors such as aging populations, smoking, occupational exposure to carcinogens, and environmental pollution have increased disease incidence worldwide. For instance, Cancer Globaocan, reported that, new data estimated that 614,298 people were diagnosed with bladder cancer in 2022 around the world, marking a 7.1% increase from the data reported in 2020. The rising global bladder cancer incidence, reaching 614,298 cases in 2022, increases demand for effective treatments and advanced diagnostics. This surge directly fuels growth in the urothelial cancer treatment market by expanding the patient pool for therapies and supporting adoption of innovative treatment options. Consequently, the increasing patient population and heightened awareness about effective therapies have significantly propelled the global urothelial cancer treatment market over recent years.

  • Advancements in Targeted and Immunotherapies

Rapid innovation in targeted therapies and immunotherapies is driving growth in the urothelial cancer treatment market. Introduction of PD 1/PD L1 inhibitors, FGFR inhibitors, and antibody-drug conjugates has transformed treatment paradigms, offering higher efficacy and improved patient outcomes. Personalized medicine approaches, including genomic profiling, enable tailored therapies, optimizing treatment effectiveness.

Ongoing clinical trials and regulatory support for breakthrough therapies accelerate market adoption. Pharmaceutical companies continue investing in research and development to expand pipeline products. These technological advancements enhance treatment accessibility, reduce recurrence rates, and provide alternatives to conventional chemotherapy, collectively strengthening the global urothelial cancer treatment market.

Market Restraints:

  • High Treatment Costs and Limited Accessibility

High costs associated with advanced urothelial cancer therapies pose a significant restraint to market growth. Immunotherapies, targeted drugs, and combination treatments are expensive, limiting access for patients in low- and middle-income regions. Additionally, healthcare infrastructure constraints, insurance coverage gaps, and reimbursement challenges restrict widespread adoption. The financial burden on both patients and healthcare systems can delay treatment initiation or reduce therapy compliance. These economic barriers are particularly pronounced in emerging markets, slowing overall market expansion despite rising disease prevalence.

Socioeconomic Impact on Urothelial Cancer Treatment Market

The urothelial cancer treatment market has substantial socioeconomic effects by improving patient survival and quality of life, particularly for older populations disproportionately affected by bladder cancer. Advances in therapies reduce hospitalizations and long term care costs through more effective disease management. However, high treatment costs and advanced therapies create financial strain on healthcare systems and patients, especially in low and middle income regions. Investments in research and clinical infrastructure stimulate economic activity, generating jobs and innovation. Expanded access to novel treatments enhances equity in healthcare, though disparities persist.

Segmental Analysis:

  • Papillary Carcinoma segment is expected to witness highest growth over the forecast period

The papillary carcinoma segment is projected to experience the highest growth due to its high prevalence among urothelial cancer cases. Characterized by finger-like projections in the bladder lining, this cancer type often requires frequent monitoring and targeted treatment. Advancements in minimally invasive therapies and intravesical treatments, including immunotherapy and chemotherapy, are increasing patient survival rates. Growing awareness and early diagnosis, aided by improved imaging and molecular profiling, further drive demand. The increasing number of clinical trials and development of novel therapies for papillary carcinoma are expected to sustain strong market growth over the forecast period.

  • Immunotherapy segment is expected to witness highest growth over the forecast period

The immunotherapy segment is anticipated to grow rapidly as immune checkpoint inhibitors, including PD-1 and PD-L1 inhibitors, become standard treatments for urothelial cancers. Immunotherapy provides durable responses, particularly in advanced and metastatic cases, improving patient outcomes compared to conventional chemotherapy. Increased adoption of personalized medicine and ongoing research in combination therapies enhance efficacy. Rising regulatory approvals for new immunotherapeutic agents and clinical trial expansions globally support growth. Hospitals, oncology centers, and specialized clinics are increasingly incorporating immunotherapy into treatment regimens, driving strong demand. These trends position immunotherapy as the fastest-growing segment within the urothelial cancer treatment market.

  • Computed tomography scanning segment is expected to witness highest growth over the forecast period

The computed tomography (CT) scanning segment is expected to see the highest growth in urothelial cancer diagnostics due to its precision in detecting tumor size, stage, and metastasis. CT imaging is widely used for initial diagnosis, treatment planning, and post-therapy monitoring. Advancements in high-resolution, low-dose CT and integration with AI-based image analysis enhance detection accuracy and reduce radiation exposure. Rising adoption in hospitals, diagnostic centers, and research institutions, coupled with increasing cancer prevalence, supports segment growth. The ability to provide detailed cross-sectional images quickly and non-invasively makes CT scanning a critical tool for managing urothelial cancer globally.

  • Hospitals segment is expected to witness highest growth over the forecast period

The hospital segment is projected to witness the highest growth in urothelial cancer treatment due to their role as primary care centers for diagnosis, treatment, and follow-up care. Hospitals provide comprehensive oncology services, including surgery, chemotherapy, immunotherapy, and diagnostic imaging. Growing patient preference for hospital-based treatment due to access to advanced equipment and specialized oncologists drives demand. Expansion of healthcare infrastructure and increased government funding in hospitals, especially in North America and Europe, further supports growth. Hospitals’ capacity to handle complex cases and provide multidisciplinary care ensures they remain the dominant end-user segment in the urothelial cancer treatment market over the forecast period.

  • Hospital Pharmacy segment is expected to witness highest growth over the forecast period

The hospital pharmacy segment is expected to grow rapidly as hospitals increasingly dispense advanced urothelial cancer therapies, including immunotherapies, targeted therapies, and combination regimens. Centralized hospital pharmacies ensure accurate dosing, patient safety, and timely availability of expensive medications. Integration with hospital electronic medical records facilitates treatment management and reduces medication errors. Rising incidence of bladder and urothelial cancers increases demand for hospital-administered therapies. Moreover, hospitals expanding oncology services and specialized infusion centers contribute to segment growth. As more therapies receive regulatory approval and enter hospital formularies, hospital pharmacies are becoming a critical distribution and administration channel for urothelial cancer treatments.

  • North American Region is expected to witness highest growth over the forecast period

North America is projected to lead the global urothelial cancer treatment market due to advanced healthcare infrastructure, high adoption of innovative therapies, and strong research and development investments. The presence of major pharmaceutical companies, well-established oncology centers, and supportive regulatory frameworks accelerates the introduction of novel immunotherapies and targeted drugs. For instance, In April 2022, Pfizer invested USD 25 million in Zentalis Pharmaceuticals, aiming to enhance its global development capabilities and accelerate innovative oncology therapies. Similarly in June 2022, Roche launched a human papillomavirus (HPV) self-sampling solution, allowing patients to perform HPV screening under professional supervision, expanding its cancer screening portfolio.

These developments strengthened North America’s urothelial cancer treatment market by fostering innovation and research in oncology therapeutics and diagnostics. Pfizer’s investment supports pipeline expansion, while Roche’s advanced screening solutions improve early detection, enhancing patient outcomes and driving demand for advanced urothelial cancer treatments across the region.

High awareness, early diagnosis programs, and government initiatives promoting cancer care further drive market growth. Additionally, increasing incidence of bladder and urothelial cancers, coupled with rising healthcare expenditure and access to advanced diagnostics and treatment modalities, positions North America as the fastest-growing regional market for urothelial cancer treatment over the forecast period.

Urothelial Cancer Treatment Market Table

To Learn More About This Report - Request a Free Sample Copy

Urothelial Cancer Treatment Market Competitive Landscape

The competitive landscape of the Global Urothelial Cancer Treatment Market is moderately concentrated, with major pharmaceutical companies dominating through robust immuno oncology and targeted therapy portfolios. Leading players focus on innovation, clinical trial expansion, and strategic collaborations to enhance treatment options. Emerging biotechs contribute dynamic competition with novel modalities like antibody drug conjugates and gene targeted therapies. Partnerships, licensing deals, and co development agreements help diversify pipelines and share development risks. While established firms hold significant market share, smaller innovators drive niche advancements and specialized therapies. Market competition emphasizes R&D investment, regulatory approvals, and global commercialization strategies to address diverse patient needs and sustain long term growth.

The major players for this market are:

  • Merck & Co., Inc.
  • F. Hoffmann La Roche AG
  • Bristol Myers Squibb Company
  • AstraZeneca PLC
  • Novartis AG
  • GlaxoSmithKline plc
  • Pfizer Inc.
  • Sanofi SA
  • Astellas Pharma Inc.
  • UroGen Pharma Ltd.
  • Johnson & Johnson (Janssen Pharmaceuticals)
  • Genentech, Inc.
  • Sesen Bio Inc.
  • Seagen Inc.
  • Eisai Co., Ltd.
  • Eli Lilly and Company
  • Agensys, Inc.
  • ImmunityBio, Inc.
  • Taiho Pharmaceutical Co., Ltd.
  • Q BioMed Inc.

Recent Development

  • In December 2025, Merck announced positive Phase 3 KEYNOTE-B15 trial results showing that KEYTRUDA combined with Padcev significantly improved event-free survival, overall survival, and pathologic complete response in muscle-invasive bladder cancer patients. This advancement strengthened the global urothelial cancer treatment market by validating effective combination therapies, enhancing clinical outcomes, and driving demand for novel immunotherapy-based treatment regimens worldwide.


  • In October 2025, Roche reported positive Phase III IMvigor011 results showing Tecentriq® significantly reduced overall survival and disease recurrence risks in muscle-invasive bladder cancer patients with detectable ctDNA. This ctDNA-guided approach enhanced the global urothelial cancer treatment market by supporting precision therapy, minimizing unnecessary treatments, improving patient outcomes, and driving adoption of biomarker-based immunotherapies worldwide.


Frequently Asked Questions (FAQ) :

Q1. What are the main growth-driving factors for this market?

The market is primarily driven by the rising global incidence of bladder cancer, particularly among the aging population and smokers. Significant advancements in immunotherapy and targeted therapies have revolutionized treatment options, offering hope for advanced-stage patients. Increased government funding for oncology research and faster drug approval processes are also accelerating market growth and patient access.

Q2. What are the main restraining factors for this market?

Growth is limited by the high cost of new-generation treatments like biologics and immunotherapies, which can be unaffordable for many patients. Severe side effects associated with chemotherapy and some newer drugs often lead to treatment discontinuation. Additionally, a lack of awareness and early screening programs in developing countries prevents timely diagnosis and effective intervention.

Q3. Which segment is expected to witness high growth?

The Immunotherapy segment is expected to witness the highest growth. These drugs, specifically checkpoint inhibitors, help the immune system recognize and destroy cancer cells with greater precision than traditional chemotherapy. Because they offer improved survival rates and are increasingly used as first-line treatments for advanced urothelial carcinoma, their adoption is surging worldwide.

Q4. Who are the top major players for this market?

The market is led by global pharmaceutical giants specializing in oncology and biotechnology. Key players include Merck & Co., Bristol-Myers Squibb, Roche (Genentech), AstraZeneca, and Pfizer. These companies dominate by investing billions in clinical trials to expand the use of their drugs and by developing combination therapies that increase treatment success.

Q5. Which country is the largest player?

The United States is the largest player in the urothelial cancer treatment market. This is due to its high healthcare expenditure, advanced medical infrastructure, and early access to the latest FDA-approved therapies. The presence of leading research institutions and a high prevalence of bladder cancer cases further drive the demand for sophisticated treatments.

Urothelial Cancer Treatment MARKET STUDY GLOBAL MARKET ANALYSIS, INSIGHTS AND FORECAST, 2020-2027

    1. Introduction

    • 1.1. Research Scope
    • 1.2. Market Segmentation
    • 1.3. Research Methodology
    • 1.4. Definitions and Assumptions

    2. Executive Summary

      3. Market Dynamics

      • 3.1. Market Drivers
      • 3.2. Market Restraints
      • 3.3. Market Opportunities

      4. Key Insights

      • 4.1. Key Emerging Trends – For Major Countries
      • 4.2. Latest Technological Advancement
      • 4.3. Regulatory Landscape
      • 4.4. Industry SWOT Analysis
      • 4.5. Porters Five Forces Analysis

      5. Global Urothelial Cancer Treatment Market Analysis (USD Billion), Insights and Forecast, 2016-2027

      • 5.1. Key Findings / Summary
      • 5.2. Market Analysis, Insights and Forecast – By Segment 1
        • 5.2.1. Sub-Segment 1
        • 5.2.2. Sub-Segment 2
      • 5.3. Market Analysis, Insights and Forecast – By Segment 2
        • 5.3.1. Sub-Segment 1
        • 5.3.2. Sub-Segment 2
        • 5.3.3. Sub-Segment 3
        • 5.3.4. Others
      • 5.4. Market Analysis, Insights and Forecast – By Segment 3
        • 5.4.1. Sub-Segment 1
        • 5.4.2. Sub-Segment 2
        • 5.4.3. Sub-Segment 3
        • 5.4.4. Others
      • 5.5. Market Analysis, Insights and Forecast – By Region
        • 5.5.1. North America
        • 5.5.2. Latin America
        • 5.5.3. Europe
        • 5.5.4. Asia Pacific
        • 5.5.5. Middle East and Africa

      6. North America Urothelial Cancer Treatment Market Analysis (USD Billion), Insights and Forecast, 2016-2027

      • 6.1. Key Findings / Summary
      • 6.2. Market Analysis, Insights and Forecast – By Segment 1
        • 6.2.1. Sub-Segment 1
        • 6.2.2. Sub-Segment 2
      • 6.3. Market Analysis, Insights and Forecast – By Segment 2
        • 6.3.1. Sub-Segment 1
        • 6.3.2. Sub-Segment 2
        • 6.3.3. Sub-Segment 3
        • 6.3.4. Others
      • 6.4. Market Analysis, Insights and Forecast – By Segment 3
        • 6.4.1. Sub-Segment 1
        • 6.4.2. Sub-Segment 2
        • 6.4.3. Sub-Segment 3
        • 6.4.4. Others
      • 6.5. Market Analysis, Insights and Forecast – By Country
        • 6.5.1. U.S.
        • 6.5.2. Canada

      7. Latin America Urothelial Cancer Treatment Market Analysis (USD Billion), Insights and Forecast, 2016-2027

      • 7.1. Key Findings / Summary
      • 7.2. Market Analysis, Insights and Forecast – By Segment 1
        • 7.2.1. Sub-Segment 1
        • 7.2.2. Sub-Segment 2
      • 7.3. Market Analysis, Insights and Forecast – By Segment 2
        • 7.3.1. Sub-Segment 1
        • 7.3.2. Sub-Segment 2
        • 7.3.3. Sub-Segment 3
        • 7.3.4. Others
      • 7.4. Market Analysis, Insights and Forecast – By Segment 3
        • 7.4.1. Sub-Segment 1
        • 7.4.2. Sub-Segment 2
        • 7.4.3. Sub-Segment 3
        • 7.4.4. Others
      • 7.5. Insights and Forecast – By Country
        • 7.5.1. Brazil
        • 7.5.2. Mexico
        • 7.5.3. Rest of Latin America

      8. Europe Urothelial Cancer Treatment Market Analysis (USD Billion), Insights and Forecast, 2016-2027

      • 8.1. Key Findings / Summary
      • 8.2. Market Analysis, Insights and Forecast – By Segment 1
        • 8.2.1. Sub-Segment 1
        • 8.2.2. Sub-Segment 2
      • 8.3. Market Analysis, Insights and Forecast – By Segment 2
        • 8.3.1. Sub-Segment 1
        • 8.3.2. Sub-Segment 2
        • 8.3.3. Sub-Segment 3
        • 8.3.4. Others
      • 8.4. Market Analysis, Insights and Forecast – By Segment 3
        • 8.4.1. Sub-Segment 1
        • 8.4.2. Sub-Segment 2
        • 8.4.3. Sub-Segment 3
        • 8.4.4. Others
      • 8.5. Market Analysis, Insights and Forecast – By Country
        • 8.5.1. UK
        • 8.5.2. Germany
        • 8.5.3. France
        • 8.5.4. Italy
        • 8.5.5. Spain
        • 8.5.6. Russia
        • 8.5.7. Rest of Europe

      9. Asia Pacific Urothelial Cancer Treatment Market Analysis (USD Billion), Insights and Forecast, 2016-2027

      • 9.1. Key Findings / Summary
      • 9.2. Market Analysis, Insights and Forecast – By Segment 1
        • 9.2.1. Sub-Segment 1
        • 9.2.2. Sub-Segment 2
      • 9.3. Market Analysis, Insights and Forecast – By Segment 2
        • 9.3.1. Sub-Segment 1
        • 9.3.2. Sub-Segment 2
        • 9.3.3. Sub-Segment 3
        • 9.3.4. Others
      • 9.4. Market Analysis, Insights and Forecast – By Segment 3
        • 9.4.1. Sub-Segment 1
        • 9.4.2. Sub-Segment 2
        • 9.4.3. Sub-Segment 3
        • 9.4.4. Others
      • 9.5. Market Analysis, Insights and Forecast – By Country
        • 9.5.1. China
        • 9.5.2. India
        • 9.5.3. Japan
        • 9.5.4. Australia
        • 9.5.5. South East Asia
        • 9.5.6. Rest of Asia Pacific

      10. Middle East & Africa Urothelial Cancer Treatment Market Analysis (USD Billion), Insights and Forecast, 2016-2027

      • 10.1. Key Findings / Summary
      • 10.2. Market Analysis, Insights and Forecast – By Segment 1
        • 10.2.1. Sub-Segment 1
        • 10.2.2. Sub-Segment 2
      • 10.3. Market Analysis, Insights and Forecast – By Segment 2
        • 10.3.1. Sub-Segment 1
        • 10.3.2. Sub-Segment 2
        • 10.3.3. Sub-Segment 3
        • 10.3.4. Others
      • 10.4. Market Analysis, Insights and Forecast – By Segment 3
        • 10.4.1. Sub-Segment 1
        • 10.4.2. Sub-Segment 2
        • 10.4.3. Sub-Segment 3
        • 10.4.4. Others
      • 10.5. Market Analysis, Insights and Forecast – By Country
        • 10.5.1. GCC
        • 10.5.2. South Africa
        • 10.5.3. Rest of Middle East & Africa

      11. Competitive Analysis

      • 11.1. Company Market Share Analysis, 2018
      • 11.2. Key Industry Developments
      • 11.3. Company Profile
        • 11.3.1. Company 1
          • 11.3.1.1. Business Overview
          • 11.3.1.2. Segment 1 & Service Offering
          • 11.3.1.3. Overall Revenue
          • 11.3.1.4. Geographic Presence
          • 11.3.1.5. Recent Development
        *Similar details will be provided for the following companies
        • 11.3.2. Company 2
        • 11.3.3. Company 3
        • 11.3.4. Company 4
        • 11.3.5. Company 5
        • 11.3.6. Company 6
        • 11.3.7. Company 7
        • 11.3.8. Company 8
        • 11.3.9. Company 9
        • 11.3.10. Company 10
        • 11.3.11. Company 11
        • 11.3.12. Company 12
      List of Figures

      Figure 1: Global Urothelial Cancer Treatment Market Revenue Breakdown (USD Billion, %) by Region, 2019 & 2027
      Figure 2: Global Urothelial Cancer Treatment Market Value Share (%), By Segment 1, 2019 & 2027
      Figure 3: Global Urothelial Cancer Treatment Market Forecast (USD Billion), by Sub-Segment 1, 2016-2027
      Figure 4: Global Urothelial Cancer Treatment Market Forecast (USD Billion), by Sub-Segment 2, 2016-2027
      Figure 5: Global Urothelial Cancer Treatment Market Value Share (%), By Segment 2, 2019 & 2027
      Figure 6: Global Urothelial Cancer Treatment Market Forecast (USD Billion), by Sub-Segment 1, 2016-2027
      Figure 7: Global Urothelial Cancer Treatment Market Forecast (USD Billion), by Sub-Segment 2, 2016-2027
      Figure 8: Global Urothelial Cancer Treatment Market Forecast (USD Billion), by Sub-Segment 3, 2016-2027
      Figure 9: Global Urothelial Cancer Treatment Market Forecast (USD Billion), by Others, 2016-2027
      Figure 10: Global Urothelial Cancer Treatment Market Value Share (%), By Segment 3, 2019 & 2027
      Figure 11: Global Urothelial Cancer Treatment Market Forecast (USD Billion), by Sub-Segment 1, 2016-2027
      Figure 12: Global Urothelial Cancer Treatment Market Forecast (USD Billion), by Sub-Segment 2, 2016-2027
      Figure 13: Global Urothelial Cancer Treatment Market Forecast (USD Billion), by Sub-Segment 3, 2016-2027
      Figure 14: Global Urothelial Cancer Treatment Market Forecast (USD Billion), by Others, 2016-2027
      Figure 15: Global Urothelial Cancer Treatment Market Value (USD Billion), by Region, 2019 & 2027
      Figure 16: North America Urothelial Cancer Treatment Market Value Share (%), By Segment 1, 2019 & 2027
      Figure 17: North America Urothelial Cancer Treatment Market Forecast (USD Billion), by Sub-Segment 1, 2016-2027
      Figure 18: North America Urothelial Cancer Treatment Market Forecast (USD Billion), by Sub-Segment 2, 2016-2027
      Figure 19: North America Urothelial Cancer Treatment Market Value Share (%), By Segment 2, 2019 & 2027
      Figure 20: North America Urothelial Cancer Treatment Market Forecast (USD Billion), by Sub-Segment 1, 2016-2027
      Figure 21: North America Urothelial Cancer Treatment Market Forecast (USD Billion), by Sub-Segment 2, 2016-2027
      Figure 22: North America Urothelial Cancer Treatment Market Forecast (USD Billion), by Sub-Segment 3, 2016-2027
      Figure 23: North America Urothelial Cancer Treatment Market Forecast (USD Billion), by Others, 2016-2027
      Figure 24: North America Urothelial Cancer Treatment Market Value Share (%), By Segment 3, 2019 & 2027
      Figure 25: North America Urothelial Cancer Treatment Market Forecast (USD Billion), by Sub-Segment 1, 2016-2027
      Figure 26: North America Urothelial Cancer Treatment Market Forecast (USD Billion), by Sub-Segment 2, 2016-2027
      Figure 27: North America Urothelial Cancer Treatment Market Forecast (USD Billion), by Sub-Segment 3, 2016-2027
      Figure 28: North America Urothelial Cancer Treatment Market Forecast (USD Billion), by Others, 2016-2027
      Figure 29: North America Urothelial Cancer Treatment Market Forecast (USD Billion), by U.S., 2016-2027
      Figure 30: North America Urothelial Cancer Treatment Market Forecast (USD Billion), by Canada, 2016-2027
      Figure 31: Latin America Urothelial Cancer Treatment Market Value Share (%), By Segment 1, 2019 & 2027
      Figure 32: Latin America Urothelial Cancer Treatment Market Forecast (USD Billion), by Sub-Segment 1, 2016-2027
      Figure 33: Latin America Urothelial Cancer Treatment Market Forecast (USD Billion), by Sub-Segment 2, 2016-2027
      Figure 34: Latin America Urothelial Cancer Treatment Market Value Share (%), By Segment 2, 2019 & 2027
      Figure 35: Latin America Urothelial Cancer Treatment Market Forecast (USD Billion), by Sub-Segment 1, 2016-2027
      Figure 36: Latin America Urothelial Cancer Treatment Market Forecast (USD Billion), by Sub-Segment 2, 2016-2027
      Figure 37: Latin America Urothelial Cancer Treatment Market Forecast (USD Billion), by Sub-Segment 3, 2016-2027
      Figure 38: Latin America Urothelial Cancer Treatment Market Forecast (USD Billion), by Others, 2016-2027
      Figure 39: Latin America Urothelial Cancer Treatment Market Value Share (%), By Segment 3, 2019 & 2027
      Figure 40: Latin America Urothelial Cancer Treatment Market Forecast (USD Billion), by Sub-Segment 1, 2016-2027
      Figure 41: Latin America Urothelial Cancer Treatment Market Forecast (USD Billion), by Sub-Segment 2, 2016-2027
      Figure 42: Latin America Urothelial Cancer Treatment Market Forecast (USD Billion), by Sub-Segment 3, 2016-2027
      Figure 43: Latin America Urothelial Cancer Treatment Market Forecast (USD Billion), by Others, 2016-2027
      Figure 44: Latin America Urothelial Cancer Treatment Market Forecast (USD Billion), by Brazil, 2016-2027
      Figure 45: Latin America Urothelial Cancer Treatment Market Forecast (USD Billion), by Mexico, 2016-2027
      Figure 46: Latin America Urothelial Cancer Treatment Market Forecast (USD Billion), by Rest of Latin America, 2016-2027
      Figure 47: Europe Urothelial Cancer Treatment Market Value Share (%), By Segment 1, 2019 & 2027
      Figure 48: Europe Urothelial Cancer Treatment Market Forecast (USD Billion), by Sub-Segment 1, 2016-2027
      Figure 49: Europe Urothelial Cancer Treatment Market Forecast (USD Billion), by Sub-Segment 2, 2016-2027
      Figure 50: Europe Urothelial Cancer Treatment Market Value Share (%), By Segment 2, 2019 & 2027
      Figure 51: Europe Urothelial Cancer Treatment Market Forecast (USD Billion), by Sub-Segment 1, 2016-2027
      Figure 52: Europe Urothelial Cancer Treatment Market Forecast (USD Billion), by Sub-Segment 2, 2016-2027
      Figure 53: Europe Urothelial Cancer Treatment Market Forecast (USD Billion), by Sub-Segment 3, 2016-2027
      Figure 54: Europe Urothelial Cancer Treatment Market Forecast (USD Billion), by Others, 2016-2027
      Figure 55: Europe Urothelial Cancer Treatment Market Value Share (%), By Segment 3, 2019 & 2027
      Figure 56: Europe Urothelial Cancer Treatment Market Forecast (USD Billion), by Sub-Segment 1, 2016-2027
      Figure 57: Europe Urothelial Cancer Treatment Market Forecast (USD Billion), by Sub-Segment 2, 2016-2027
      Figure 58: Europe Urothelial Cancer Treatment Market Forecast (USD Billion), by Sub-Segment 3, 2016-2027
      Figure 59: Europe Urothelial Cancer Treatment Market Forecast (USD Billion), by Others, 2016-2027
      Figure 60: Europe Urothelial Cancer Treatment Market Forecast (USD Billion), by U.K., 2016-2027
      Figure 61: Europe Urothelial Cancer Treatment Market Forecast (USD Billion), by Germany, 2016-2027
      Figure 62: Europe Urothelial Cancer Treatment Market Forecast (USD Billion), by France, 2016-2027
      Figure 63: Europe Urothelial Cancer Treatment Market Forecast (USD Billion), by Italy, 2016-2027
      Figure 64: Europe Urothelial Cancer Treatment Market Forecast (USD Billion), by Spain, 2016-2027
      Figure 65: Europe Urothelial Cancer Treatment Market Forecast (USD Billion), by Russia, 2016-2027
      Figure 66: Europe Urothelial Cancer Treatment Market Forecast (USD Billion), by Rest of Europe, 2016-2027
      Figure 67: Asia Pacific Urothelial Cancer Treatment Market Value Share (%), By Segment 1, 2019 & 2027
      Figure 68: Asia Pacific Urothelial Cancer Treatment Market Forecast (USD Billion), by Sub-Segment 1, 2016-2027
      Figure 69: Asia Pacific Urothelial Cancer Treatment Market Forecast (USD Billion), by Sub-Segment 2, 2016-2027
      Figure 70: Asia Pacific Urothelial Cancer Treatment Market Value Share (%), By Segment 2, 2019 & 2027
      Figure 71: Asia Pacific Urothelial Cancer Treatment Market Forecast (USD Billion), by Sub-Segment 1, 2016-2027
      Figure 72: Asia Pacific Urothelial Cancer Treatment Market Forecast (USD Billion), by Sub-Segment 2, 2016-2027
      Figure 73: Asia Pacific Urothelial Cancer Treatment Market Forecast (USD Billion), by Sub-Segment 3, 2016-2027
      Figure 74: Asia Pacific Urothelial Cancer Treatment Market Forecast (USD Billion), by Others, 2016-2027
      Figure 75: Asia Pacific Urothelial Cancer Treatment Market Value Share (%), By Segment 3, 2019 & 2027
      Figure 76: Asia Pacific Urothelial Cancer Treatment Market Forecast (USD Billion), by Sub-Segment 1, 2016-2027
      Figure 77: Asia Pacific Urothelial Cancer Treatment Market Forecast (USD Billion), by Sub-Segment 2, 2016-2027
      Figure 78: Asia Pacific Urothelial Cancer Treatment Market Forecast (USD Billion), by Sub-Segment 3, 2016-2027
      Figure 79: Asia Pacific Urothelial Cancer Treatment Market Forecast (USD Billion), by Others, 2016-2027
      Figure 80: Asia Pacific Urothelial Cancer Treatment Market Forecast (USD Billion), by China, 2016-2027
      Figure 81: Asia Pacific Urothelial Cancer Treatment Market Forecast (USD Billion), by India, 2016-2027
      Figure 82: Asia Pacific Urothelial Cancer Treatment Market Forecast (USD Billion), by Japan, 2016-2027
      Figure 83: Asia Pacific Urothelial Cancer Treatment Market Forecast (USD Billion), by Australia, 2016-2027
      Figure 84: Asia Pacific Urothelial Cancer Treatment Market Forecast (USD Billion), by Southeast Asia, 2016-2027
      Figure 85: Asia Pacific Urothelial Cancer Treatment Market Forecast (USD Billion), by Rest of Asia Pacific, 2016-2027
      Figure 86: Middle East & Africa Urothelial Cancer Treatment Market Value Share (%), By Segment 1, 2019 & 2027
      Figure 87: Middle East & Africa Urothelial Cancer Treatment Market Forecast (USD Billion), by Sub-Segment 1, 2016-2027
      Figure 88: Middle East & Africa Urothelial Cancer Treatment Market Forecast (USD Billion), by Sub-Segment 2, 2016-2027
      Figure 89: Middle East & Africa Urothelial Cancer Treatment Market Value Share (%), By Segment 2, 2019 & 2027
      Figure 90: Middle East & Africa Urothelial Cancer Treatment Market Forecast (USD Billion), by Sub-Segment 1, 2016-2027
      Figure 91: Middle East & Africa Urothelial Cancer Treatment Market Forecast (USD Billion), by Sub-Segment 2, 2016-2027
      Figure 92: Middle East & Africa Urothelial Cancer Treatment Market Forecast (USD Billion), by Sub-Segment 3, 2016-2027
      Figure 93: Middle East & Africa Urothelial Cancer Treatment Market Forecast (USD Billion), by Others, 2016-2027
      Figure 94: Middle East & Africa Urothelial Cancer Treatment Market Value Share (%), By Segment 3, 2019 & 2027
      Figure 95: Middle East & Africa Urothelial Cancer Treatment Market Forecast (USD Billion), by Sub-Segment 1, 2016-2027
      Figure 96: Middle East & Africa Urothelial Cancer Treatment Market Forecast (USD Billion), by Sub-Segment 2, 2016-2027
      Figure 97: Middle East & Africa Urothelial Cancer Treatment Market Forecast (USD Billion), by Sub-Segment 3, 2016-2027
      Figure 98: Middle East & Africa Urothelial Cancer Treatment Market Forecast (USD Billion), by Others, 2016-2027
      Figure 99: Middle East & Africa Urothelial Cancer Treatment Market Forecast (USD Billion), by GCC, 2016-2027
      Figure 100: Middle East & Africa Urothelial Cancer Treatment Market Forecast (USD Billion), by South Africa, 2016-2027
      Figure 101: Middle East & Africa Urothelial Cancer Treatment Market Forecast (USD Billion), by Rest of Middle East & Africa, 2016-2027 
      List of Tables
      Table 1: Global Urothelial Cancer Treatment Market Revenue (USD Billion) Forecast, by Segment 1, 2016-2027
      Table 2: Global Urothelial Cancer Treatment Market Revenue (USD Billion) Forecast, by Segment 2, 2016-2027
      Table 3: Global Urothelial Cancer Treatment Market Revenue (USD Billion) Forecast, by Segment 3, 2016-2027
      Table 4: Global Urothelial Cancer Treatment Market Revenue (USD Billion) Forecast, by Region, 2016-2027
      Table 5: North America Urothelial Cancer Treatment Market Revenue (USD Billion) Forecast, by Segment 1, 2016-2027
      Table 6: North America Urothelial Cancer Treatment Market Revenue (USD Billion) Forecast, by Segment 2, 2016-2027
      Table 7: North America Urothelial Cancer Treatment Market Revenue (USD Billion) Forecast, by Segment 3, 2016-2027
      Table 8: North America Urothelial Cancer Treatment Market Revenue (USD Billion) Forecast, by Country, 2016-2027
      Table 9: Europe Urothelial Cancer Treatment Market Revenue (USD Billion) Forecast, by Segment 1, 2016-2027
      Table 10: Europe Urothelial Cancer Treatment Market Revenue (USD Billion) Forecast, by Segment 2, 2016-2027
      Table 11: Europe Urothelial Cancer Treatment Market Revenue (USD Billion) Forecast, by Segment 3, 2016-2027
      Table 12: Europe Urothelial Cancer Treatment Market Revenue (USD Billion) Forecast, by Country, 2016-2027
      Table 13: Latin America Urothelial Cancer Treatment Market Revenue (USD Billion) Forecast, by Segment 1, 2016-2027
      Table 14: Latin America Urothelial Cancer Treatment Market Revenue (USD Billion) Forecast, by Segment 2, 2016-2027
      Table 15: Latin America Urothelial Cancer Treatment Market Revenue (USD Billion) Forecast, by Segment 3, 2016-2027
      Table 16: Latin America Urothelial Cancer Treatment Market Revenue (USD Billion) Forecast, by Country, 2016-2027
      Table 17: Asia Pacific Urothelial Cancer Treatment Market Revenue (USD Billion) Forecast, by Segment 1, 2016-2027
      Table 18: Asia Pacific Urothelial Cancer Treatment Market Revenue (USD Billion) Forecast, by Segment 2, 2016-2027
      Table 19: Asia Pacific Urothelial Cancer Treatment Market Revenue (USD Billion) Forecast, by Segment 3, 2016-2027
      Table 20: Asia Pacific Urothelial Cancer Treatment Market Revenue (USD Billion) Forecast, by Country, 2016-2027
      Table 21: Middle East & Africa Urothelial Cancer Treatment Market Revenue (USD Billion) Forecast, by Segment 1, 2016-2027
      Table 22: Middle East & Africa Urothelial Cancer Treatment Market Revenue (USD Billion) Forecast, by Segment 2, 2016-2027
      Table 23: Middle East & Africa Urothelial Cancer Treatment Market Revenue (USD Billion) Forecast, by Segment 3, 2016-2027
      Table 24: Middle East & Africa Urothelial Cancer Treatment Market Revenue (USD Billion) Forecast, by Country, 2016-2027
      Research Process

      Data Library Research are conducted by industry experts who offer insight on industry structure, market segmentations technology assessment and competitive landscape (CL), and penetration, as well as on emerging trends. Their analysis is based on primary interviews (~ 80%) and secondary research (~ 20%) as well as years of professional expertise in their respective industries. Adding to this, by analysing historical trends and current market positions, our analysts predict where the market will be headed for the next five years. Furthermore, the varying trends of segment & categories geographically presented are also studied and the estimated based on the primary & secondary research.

      In this particular report from the supply side Data Library Research has conducted primary surveys (interviews) with the key level executives (VP, CEO’s, Marketing Director, Business Development Manager and SOFT) of the companies that active & prominent as well as the midsized organization

      FIGURE 1: DLR RESEARH PROCESS

      research-methodology1

      Primary Research

      Extensive primary research was conducted to gain a deeper insight of the market and industry performance. The analysis is based on both primary and secondary research as well as years of professional expertise in the respective industries.

      In addition to analysing current and historical trends, our analysts predict where the market is headed over the next five years.

      It varies by segment for these categories geographically presented in the list of market tables. Speaking about this particular report we have conducted primary surveys (interviews) with the key level executives (VP, CEO’s, Marketing Director, Business Development Manager and many more) of the major players active in the market.

      Secondary Research

      Secondary research was mainly used to collect and identify information useful for the extensive, technical, market-oriented, and Friend’s study of the Global Extra Neutral Alcohol. It was also used to obtain key information about major players, market classification and segmentation according to the industry trends, geographical markets, and developments related to the market and technology perspectives. For this study, analysts have gathered information from various credible sources, such as annual reports, sec filings, journals, white papers, SOFT presentations, and company web sites.

      Market Size Estimation

      Both, top-down and bottom-up approaches were used to estimate and validate the size of the Global market and to estimate the size of various other dependent submarkets in the overall Extra Neutral Alcohol. The key players in the market were identified through secondary research and their market contributions in the respective geographies were determined through primary and secondary research.

      Forecast Model

      research-methodology2