Get Complete Analysis Of The Report - Download Updated Free Sample PDF
The global intratumoral cancer therapy market is primarily driven by the rising incidence of cancer worldwide and the increasing demand for more effective targeted treatment options that deliver therapeutic agents directly into tumor sites, thereby enhancing local efficacy while minimizing systemic toxicity. This localized delivery approach addresses limitations of conventional systemic therapies and is particularly appealing for solid tumors with poor response to traditional treatments.
In the global intratumoral cancer therapy market, key trends are shaped by advancements in immunotherapy and precision oncology, with intratumoral approaches increasingly integrated alongside immune checkpoint inhibitors and oncolytic agents to enhance localized immune activation and therapeutic efficacy. There is growing development of novel delivery platforms—including nanoparticle-based and biomaterial systems—to improve targeted delivery and reduce systemic toxicity, reflecting a broader focus on personalized cancer care. Additionally, an expanding pipeline of clinical stage intratumoral therapies and collaborations between biopharmaceutical companies and research institutions are accelerating innovation and adoption, while rising cancer prevalence continues to drive interest in localized treatment modalities.
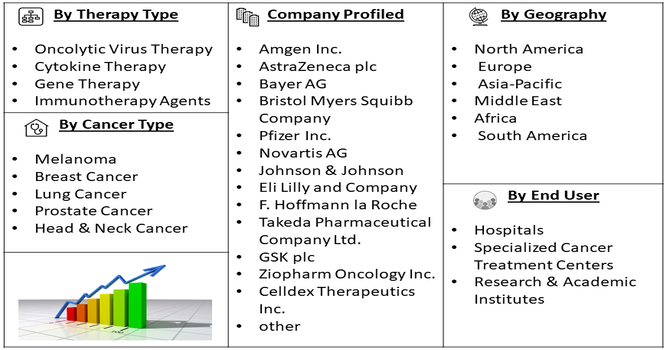
Segmentation: Global Intratumoral Cancer Therapy Market is segmented By Therapy Type (Oncolytic Virus Therapy, Cytokine Therapy, Gene Therapy, Immunotherapy Agents), Cancer Type (Melanoma, Breast Cancer, Lung Cancer, Prostate Cancer, Head & Neck Cancer), Delivery Method (Direct Tumor Injection, Image-Guided Injection, and Catheter-Based Delivery Systems), End User (Hospitals, Specialized Cancer Treatment Centers, Research & Academic Institutes), and Geography (North America, Europe, Asia-Pacific, Middle East and Africa, and South America). The report provides the value (in USD million) for the above segments.
For Detailed Market Segmentation - Get a Free Sample PDF
Market Drivers:
The primary drivers of the intratumoral cancer therapy market is the steadily increasing global incidence of cancer, particularly solid tumors such as melanoma, breast cancer, lung cancer, and head and neck cancers. For instance, World Cancer Research Fund, reported that a total of 19.9 million cases of cancer were diagnosed in 2022 – 10.3 million among men and 9.6 million among women.
Conventional systemic treatments often face limitations related to toxicity, drug resistance, and suboptimal tumor penetration. Intratumoral therapies address these challenges by delivering therapeutic agents directly into the tumor microenvironment, enabling higher local drug concentrations while minimizing systemic exposure. This targeted approach improves treatment efficacy, reduces adverse effects, and supports better patient tolerance, making intratumoral therapies an increasingly attractive option for oncologists managing difficult-to-treat or localized tumors.
Rapid advancements in immuno-oncology and localized drug delivery technologies are significantly accelerating market growth. Intratumoral administration of immunotherapies, oncolytic viruses, cytokines, and gene-based treatments has demonstrated strong potential to stimulate localized and systemic anti-tumor immune responses. Innovations in image-guided injection techniques, biomaterial carriers, and nanoparticle-based delivery systems are enhancing precision, safety, and treatment outcomes.
Additionally, a growing pipeline of clinical-stage intratumoral therapies, supported by increased R&D investments and strategic collaborations between biotechnology companies and research institutions, is strengthening confidence in this therapeutic approach and driving broader market adoption. For instance, in November 2025, Zetagen Therapeutics announced that its study demonstrating increased survival in mice with MCF7 breast cancer, using a single intratumoral injection of a lipid-like hydrogel containing a novel molecular entity, was accepted for presentation at the 2025 SABCS. This research highlighted the potential of innovative localized therapies, strengthening clinical interest and growth in the Global Intratumoral Cancer Therapy Market.
Market Restraints:
The major restraints facing the intratumoral cancer therapy market is the procedural complexity associated with direct tumor injection. Intratumoral administration often requires image-guided techniques, specialized equipment, and highly trained medical professionals to ensure accurate delivery, particularly for deep-seated or hard-to-access tumors. This limits the applicability of intratumoral therapies to specific tumor types and anatomical locations, reducing the eligible patient population. In addition, repeated injections may be required to achieve therapeutic efficacy, increasing procedural burden, patient discomfort, and healthcare resource utilization, which can hinder widespread adoption in routine clinical practice.
The Global Intratumoral Cancer Therapy Market has a meaningful socioeconomic impact by improving treatment precision, reducing systemic side effects, and enhancing patient quality of life. Localized drug delivery can lower hospitalization time, decrease adverse reactions, and reduce overall healthcare costs for patients and providers. Market growth stimulates investment in oncology research, biotechnology manufacturing, and clinical services, creating high-skilled employment opportunities. Improved outcomes support workforce participation and long-term productivity among cancer survivors. However, high development costs and limited availability in low-income regions may restrict access. Expanding clinical adoption, reimbursement, and collaborative research initiatives are essential to ensure equitable access and maximize the market’s impact.
Segmental Analysis:
Oncolytic virus therapy represents a prominent segment due to its dual mechanism of selectively infecting and destroying tumor cells while stimulating a systemic anti-tumor immune response. Its increasing clinical validation across multiple solid tumor indications and strong research pipeline contribute significantly to market value growth measured in USD million.
Melanoma accounts for a key cancer type segment, as it is highly accessible for direct intratumoral administration and has demonstrated favorable responses to localized immunotherapies.
In November 2023, the FDA’s Fast Track designation for Genelux’s oncolytic virus Olvi-Vec reinforced regulatory confidence in intratumoral oncolytic therapies. Although targeted at ovarian cancer, this milestone strengthened clinical momentum and investment across the melanoma segment, where similar intratumoral virus-based approaches were increasingly explored, supporting accelerated development and adoption within the Intratumoral Cancer Therapy Market. Thus the rising incidence of melanoma and growing adoption of combination treatment approaches support sustained demand within this segment.
Image-guided injection is gaining strong adoption as it enables precise targeting of tumor sites, particularly for deep-seated or anatomically complex tumors. The use of imaging technologies improves treatment accuracy and safety, driving higher utilization in advanced oncology settings. The integration of advanced imaging technologies improved targeting accuracy, minimized damage to surrounding tissues, and enhanced patient safety. These benefits increased clinician confidence, supported better clinical outcomes, and drove higher utilization of intratumoral cancer therapies in advanced oncology and hospital settings.
Hospitals dominate the end-user segment due to their advanced infrastructure, availability of skilled oncology specialists, and capacity to manage complex intratumoral procedures. High patient volumes and access to multidisciplinary cancer care further reinforce their leading market contribution. Their access to advanced medical technologies, clinical trial participation, and specialized oncology teams enabled safe handling of complex localized treatments. High inpatient and outpatient volumes, along with established reimbursement frameworks, further strengthened hospitals’ leading role in driving adoption and utilization of intratumoral cancer therapies across healthcare systems.
North America held a substantial share of the intratumoral cancer therapy market, supported by a well-established oncology research ecosystem and strong collaboration between academic institutions, biotechnology firms, and healthcare providers.
Early adoption of innovative cancer therapies, along with a high volume of clinical trials, accelerated the development and commercialization of intratumoral treatments. Favorable regulatory frameworks and efficient approval pathways further encouraged innovation and investment. For instance, in March 2024, ImmVira announced that the U.S. FDA had granted Fast Track designation to its intratumoral oncolytic virus therapy, MVR-T3011 IT, for treating recurrent head and neck squamous cell carcinoma in patients whose disease progressed after platinum-based chemotherapy and prior anti-PD-1/PD-L1 therapy.
Simialrly, In November 2024, Merck & Co. Inc. entered into a definitive agreement to acquire Velosbio Inc., a clinical-stage biopharmaceutical company developing first-in-class cancer therapies targeting ROR1. This acquisition strengthened Merck’s oncology pipeline, enhanced innovation in targeted cancer treatments, and supported continued growth and investment in North America’s intratumoral cancer therapy market.
Additionally, advanced healthcare infrastructure, strong reimbursement systems, and high awareness among clinicians and patients contributed to widespread adoption, resulting in a significant contribution to overall market value and reinforcing North America’s leadership in this therapeutic area.
| Report Matrics | Details |
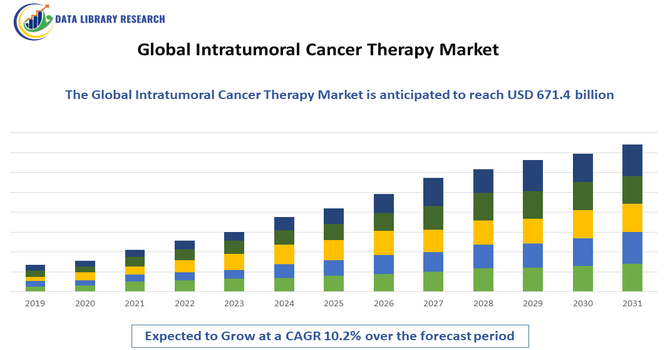
| Market Size Value | USD 671.4 billion |
| Growth Rate | CAGR of 10.2 % |
| Forecast | 2026-2033 |
| Historical data | 2021-2024 |
| Base Year | 2025 |
| Report Coverage | Forecasted revenue, company rating, competitive environment, growth drivers, and trends |
| Segment Coverage | Type, Application, End-User, Geography |
| Regional Scope | North America, Europe, Asia Pacific, Middle East |
| Customized scope | Free customization of reports (With 3 months Analysis Support ) |
| To Learn More About This Report | Request a Free Sample Copy |
The competitive landscape of the global intratumoral cancer therapy market is dynamic and highly innovative, featuring major multinational pharmaceutical companies alongside specialized biotechnology firms focused on developing targeted, localized cancer treatments. These players are advancing a wide range of intratumoral therapies—such as oncolytic viruses, immunotherapy agents, gene therapies, and cytokine treatments—through robust research pipelines, extensive clinical trials, and strategic collaborations to improve efficacy and patient outcomes. Competitive strategies in the market include heavy investment in R&D, partnerships with academic and research institutions, mergers and acquisitions to broaden portfolios, and expansion into emerging regions. This competitive intensity reflects the growing importance of intratumoral approaches as part of personalized oncology treatment paradigms and the substantial unmet medical need in solid tumor therapeutics.
Key Companies in the Market:
Recent Development
Q1. What are the main growth-driving factors for this market?
The primary driver is the ability to deliver high doses of medicine directly into a tumor, which minimizes damage to healthy organs. This localized approach reduces the severe side effects often seen with traditional chemotherapy. Additionally, increasing cases of solid tumors and advancements in precision imaging are making these targeted injections safer and more effective.
Q2. What are the main restraining factors for this market?
Growth is limited by the technical difficulty of reaching tumors located deep inside the body, which requires highly skilled specialists and advanced equipment. There is also a risk of the medicine leaking into the bloodstream, causing unexpected reactions. Furthermore, many of these therapies are still in early testing stages and are very expensive.
Q3. Which segment is expected to witness high growth?
The melanoma segment is expected to witness the highest growth over the forecast period due to rising incidence rates and increasing adoption of targeted, localized treatment approaches. Intratumoral therapies offer improved efficacy with fewer systemic side effects, driving clinical interest, expanding research activity, and accelerating market growth in melanoma treatment.
Q4. Who are the top major players for this market?
The market is led by innovative biotech firms and global pharmaceutical giants. Key players include Amgen, Bristol-Myers Squibb, Merck & Co., AstraZeneca, and Oncolytics Biotech. These companies are heavily investing in clinical trials to combine intratumoral injections with other treatments to improve survival rates for patients with hard-to-treat cancers.
Q5. Which country is the largest player?
The United States is the largest player in this market. It leads due to its massive investment in oncology research and a high number of ongoing clinical trials for new cancer drugs. The presence of world-leading cancer centers and a fast-track regulatory process for life-saving therapies helps the U.S. maintain its dominance.
Data Library Research are conducted by industry experts who offer insight on industry structure, market segmentations technology assessment and competitive landscape (CL), and penetration, as well as on emerging trends. Their analysis is based on primary interviews (~ 80%) and secondary research (~ 20%) as well as years of professional expertise in their respective industries. Adding to this, by analysing historical trends and current market positions, our analysts predict where the market will be headed for the next five years. Furthermore, the varying trends of segment & categories geographically presented are also studied and the estimated based on the primary & secondary research.
In this particular report from the supply side Data Library Research has conducted primary surveys (interviews) with the key level executives (VP, CEO’s, Marketing Director, Business Development Manager and SOFT) of the companies that active & prominent as well as the midsized organization
FIGURE 1: DLR RESEARH PROCESS
Extensive primary research was conducted to gain a deeper insight of the market and industry performance. The analysis is based on both primary and secondary research as well as years of professional expertise in the respective industries.
In addition to analysing current and historical trends, our analysts predict where the market is headed over the next five years.
It varies by segment for these categories geographically presented in the list of market tables. Speaking about this particular report we have conducted primary surveys (interviews) with the key level executives (VP, CEO’s, Marketing Director, Business Development Manager and many more) of the major players active in the market.
Secondary ResearchSecondary research was mainly used to collect and identify information useful for the extensive, technical, market-oriented, and Friend’s study of the Global Extra Neutral Alcohol. It was also used to obtain key information about major players, market classification and segmentation according to the industry trends, geographical markets, and developments related to the market and technology perspectives. For this study, analysts have gathered information from various credible sources, such as annual reports, sec filings, journals, white papers, SOFT presentations, and company web sites.
Market Size EstimationBoth, top-down and bottom-up approaches were used to estimate and validate the size of the Global market and to estimate the size of various other dependent submarkets in the overall Extra Neutral Alcohol. The key players in the market were identified through secondary research and their market contributions in the respective geographies were determined through primary and secondary research.
Forecast Model