Vehicle Industrial Tablet Pc Market Overview and Analysis:

The Global Vehicle Industrial Tablet PC Market is expected to reach USD 1.82 billion in 2025 and grow at a CAGR of 7.58% to reach USD 3.54 billion by 2032.

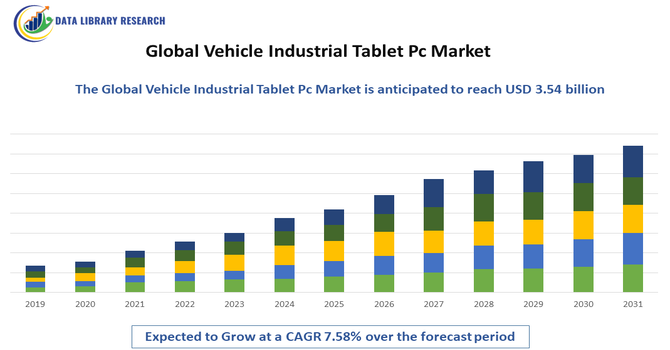
The Global Vehicle Industrial Tablet PC Market is witnessing significant growth driven by the increasing adoption of digitalization and automation in the automotive, logistics, and transportation sectors. Rising demand for real-time vehicle diagnostics, fleet management, navigation, and maintenance monitoring is accelerating the deployment of rugged and industrial-grade tablet PCs in commercial and industrial vehicles. Additionally, the integration of advanced connectivity features, IoT-enabled platforms, and user-friendly interfaces enhances operational efficiency, reduces downtime, and improves overall productivity, further fueling the adoption of vehicle industrial tablet PCs across global transportation and logistics networks.

Vehicle Industrial Tablet Pc Market Latest Trends:

The Global Vehicle Industrial Tablet PC Market is seeing a growing shift toward rugged, highly connected, and multifunctional tablets tailored for fleet operations, logistics, and field service — with many newer models offering 5G/4G connectivity, GNSS/GPS, CAN bus/OBD integration, and extended battery life so that vehicles and mobile workers stay online and operational even in harsh conditions. There’s also rising integration of IoT, edge computing, and AI enabled analytics on these tablets, enabling real time diagnostics, asset tracking, predictive maintenance, and smart fleet management, which helps operators optimize routes, monitor vehicle health, and reduce downtime.

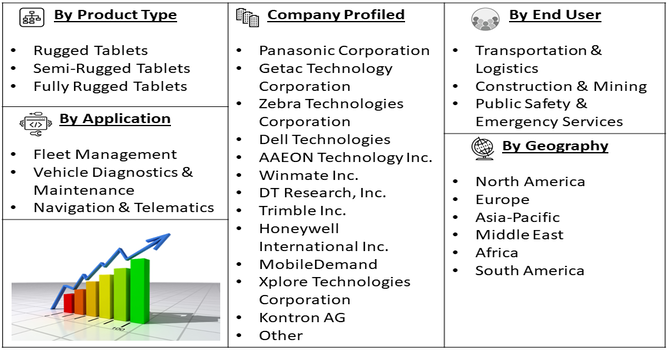
Segmentation: Global Vehicle Industrial Tablet PC Market is segmented By Device Type (Rugged Tablets, Semi-Rugged Tablets, Fully Rugged Tablets), Operating System (Android, Windows, iOS), By Vehicle Type (Commercial Vehicles, Industrial Vehicles, Passenger Vehicles), Application (Fleet Management, Vehicle Diagnostics & Maintenance, Navigation & Telematics), End-Use Industry (Transportation & Logistics, Construction & Mining, Public Safety & Emergency Services), and Geography (North America, Europe, Asia-Pacific, Middle East and Africa, and South America). The report provides the value (in USD million) for the above segments.

Market Drivers:

  • Growing Demand for Fleet Management and Vehicle Diagnostics

A major driver of the Global Vehicle Industrial Tablet PC Market is the increasing need for real-time fleet management, vehicle diagnostics, and telematics solutions. Industrial and commercial fleet operators are leveraging rugged tablet PCs to monitor vehicle performance, track location, optimize routes, and reduce operational downtime. These tablets provide seamless connectivity with vehicle systems, allowing managers to access critical data remotely, enhance productivity, and ensure timely maintenance. The rising focus on operational efficiency, cost reduction, and improved fleet safety is significantly boosting the adoption of industrial vehicle tablets across logistics, transportation, and field-service sectors.

  • Advancements in Connectivity and IoT Integration

Another key driver is the integration of advanced connectivity features and IoT-enabled solutions in vehicle industrial tablets. With support for 4G/5G, Wi-Fi, Bluetooth, GPS/GNSS, and CAN-bus/OBD interfaces, these tablets enable real-time data collection, remote monitoring, predictive maintenance, and intelligent asset management. IoT integration allows vehicles to communicate with central management systems, providing actionable insights and enhancing decision-making for fleet operators. The growing demand for smart transportation systems, connected vehicles, and data-driven operational strategies is accelerating the adoption of industrial tablet PCs globally.

Market Restraints:

  • High Initial Cost of Rugged and Industrial-Grade Tablets

A major restraint for the Global Vehicle Industrial Tablet PC Market is the high upfront cost of rugged and industrial-grade tablets. These devices are designed to withstand harsh environments, including extreme temperatures, vibration, dust, and water exposure, which requires specialized materials, durable enclosures, and advanced components. The higher manufacturing and purchase costs compared to consumer-grade tablets can limit adoption, particularly among small and medium-sized fleet operators or companies with budget constraints, slowing overall market growth.

Socioeconomic Impact on Vehicle Industrial Tablet Pc Market

The global vehicle industrial tablet PC market has significant socioeconomic impacts by enhancing efficiency, safety, and productivity across transportation, logistics, and fleet management sectors. These rugged, vehicle-mounted tablets enable real-time data collection, navigation, diagnostic monitoring, and communication, reducing operational errors and downtime. Increased adoption drives digitalization in transportation and industrial fleets, creating high-skill employment opportunities in software development, maintenance, and systems integration. Improved workflow efficiency reduces fuel consumption and operational costs, indirectly supporting environmental sustainability. Moreover, these devices enhance worker safety and decision-making in harsh or mobile environments, contributing to better working conditions and overall economic productivity in the transportation and industrial sectors.

Segmental Analysis:

  • Fully Rugged Tablets segment is expected to witness highest growth over the forecast period

Fully rugged tablets are designed to withstand harsh environmental conditions such as extreme temperatures, vibrations, shocks, dust, and water exposure. These devices are widely adopted in industrial, construction, logistics, and transportation sectors where durability and reliability are critical. Their robust design, combined with long battery life and connectivity features, ensures uninterrupted operation in challenging environments, making them ideal for fieldwork and fleet operations.

  • Android segment is expected to witness highest growth over the forecast period

Android-based industrial tablets dominate the market due to their user-friendly interface, wide app ecosystem, and flexibility for customization. Android tablets allow integration with fleet management software, vehicle diagnostics tools, and IoT platforms, providing real-time monitoring, predictive maintenance, and operational efficiency.

  • Commercial Vehicles segment is expected to witness highest growth over the forecast period

Commercial vehicles such as trucks, buses, and delivery vans are a major segment, as operators increasingly rely on industrial tablets for fleet management, route optimization, maintenance tracking, and navigation. These tablets help reduce operational costs, improve safety, and enhance driver productivity.

  • Fleet Management segment is expected to witness highest growth over the forecast period

Fleet management applications drive tablet adoption by enabling real-time vehicle tracking, driver performance monitoring, predictive maintenance, and route optimization. Industrial tablets provide centralized control and data analytics for large fleets, improving efficiency, reducing downtime, and lowering fuel and operational costs.

  • Transportation & Logistics segment is expected to witness highest growth over the forecast period

The transportation and logistics industry is a primary end-user, leveraging industrial tablets to manage vehicle fleets, monitor deliveries, and optimize supply chain operations. Tablets help companies ensure timely deliveries, monitor cargo conditions, and enhance overall operational efficiency.

  • North America segment is expected to witness highest growth over the forecast period

North America is expected to witness the highest growth due to advanced fleet infrastructure, early adoption of connected vehicles, and demand for real-time vehicle monitoring solutions. Strong presence of logistics companies, high vehicle digitization, and technological advancements are driving the adoption of industrial tablets in the region. For instance, in 2025, MicroTouch launched the rugged Mobile Tablet M1-101RT-A1 and Outdoor Open Frame touchscreen displays, enhancing operations in retail and quick-service restaurants. These durable, high-performance devices supported mobile POS, inventory management, and outdoor digital signage, driving adoption of industrial tablets in the U.S. vehicle and fleet management market.

Moreover, the rising demand for efficient fleet management, real-time monitoring, and industrial automation solutions is accelerating the deployment of vehicle industrial tablets across logistics, manufacturing, and public transportation sectors.

Furth more, North America is poised to witness the highest growth in the vehicle industrial tablet PC market over the forecast period, driven by advanced fleet infrastructure, early adoption of connected vehicles, and strong demand for real-time monitoring solutions. Technological innovation, high vehicle digitization, and a robust logistics ecosystem further reinforce the region’s leading position, making it a key hub for industrial tablet adoption across transportation, manufacturing, and field service applications. These factors collectively ensure sustained market expansion, positioning North America as the most dynamic and influential region in shaping the future of vehicle industrial tablet PCs.

Vehicle Industrial Tablet Pc Market Competitive Landscape:

The Global Vehicle Industrial Tablet PC Market is intensely competitive, featuring a mix of established electronics giants and specialized rugged device manufacturers. Players compete on ruggedness (durability for harsh environments), connectivity (4G/5G, GPS, CAN bus), software ecosystem support, modular expandability (scanners, sensors, docks), and customization for vertical industries (logistics, transportation, field service, public safety). Vendors are investing in R&D to enhance durability, battery life, and IoT/edge computing integration. Strategic moves like acquisitions, expanding global distribution, and partnerships with fleet management or telematics software providers are common as firms strive to capture larger shares in the growing industrial vehicle tablet segment.

Key Players:

  • Panasonic Corporation
  • Getac Technology Corporation
  • Zebra Technologies Corporation
  • Dell Technologies
  • AAEON Technology Inc.
  • Winmate Inc.
  • DT Research, Inc.
  • Trimble Inc.
  • Honeywell International Inc.
  • MobileDemand
  • Xplore Technologies Corporation
  • Kontron AG
  • MilDef Group AB
  • NEXCOM International Co., Ltd.
  • Samsung Electronics Co., Ltd.
  • HP Inc.
  • RuggON
  • DTEX Systems
  • Acer Inc.
  • LEONARDO DRS

Recent Development

  • In September 2025, Getac Technology Corporation launched the F120, the world’s first fully rugged Copilot+ tablet PC. It targeted field professionals in defense, utilities, manufacturing, and automotive sectors, enabling edge AI deployment to optimize efficiency and performance in demanding and challenging work environments.


  • In August 2025, Samsung launched the Galaxy Tab Active5 Enterprise Edition in India, a rugged, enterprise-ready tablet designed for high-intensity environments. Building on the XCover7 Rugged Smartphone, it supported demanding sectors including defense, public safety, logistics, manufacturing, healthcare, retail, and service industries with enhanced performance and durability.


Frequently Asked Questions (FAQ) :

Q1. What are the main growth-driving factors for this market?

Growth is driven by the rapid increase in fleet management and logistics automation across commercial vehicles. These rugged tablets provide real-time data, navigation, and proof-of-delivery systems, improving efficiency and compliance. The need for devices that can withstand vehicle vibration and extreme temperatures is critical.

Q2. What are the main restraining factors for this market?

The high initial investment cost for specialized, rugged hardware is a major constraint for smaller fleet operators. Additionally, integrating these complex devices seamlessly with existing vehicle telematics and ensuring robust cybersecurity protection for sensitive logistics data pose technical challenges.

Q3. Which segment is expected to witness high growth?

The Fully Rugged Tablets segment is expected to witness the highest growth due to increasing demand for durable, high-performance devices in harsh environments. Their resistance to dust, water, shock, and extreme temperatures makes them ideal for defense, industrial, logistics, and field service applications, driving widespread adoption globally.

Q4. Who are the top major players for this market?

The market leaders are companies known for manufacturing durable, specialized hardware. Key players include Advantech, Winmate, and Panasonic Corporation (with its Toughbook line). These companies focus on providing highly ruggedized tablets built for demanding vehicular environments.

Q5. Which country is the largest player?

North America currently holds the largest share of this market. This is primarily due to the region's early and widespread adoption of advanced fleet management technologies, stringent regulatory requirements for trucking compliance, and large existing transportation and logistics infrastructure.

Vehicle Industrial Tablet Pc MARKET STUDY GLOBAL MARKET ANALYSIS, INSIGHTS AND FORECAST, 2022-2029

    1. Introduction

    • 1.1. Research Scope
    • 1.2. Market Segmentation
    • 1.3. Research Methodology
    • 1.4. Definitions and Assumptions

    2. Executive Summary

      3. Market Dynamics

      • 3.1. Market Drivers
      • 3.2. Market Restraints
      • 3.3. Market Opportunities

      4. Key Insights

      • 4.1. Key Emerging Trends – For Major Countries
      • 4.2. Latest Technological Advancement
      • 4.3. Regulatory Landscape
      • 4.4. Industry SWOT Analysis
      • 4.5. Porters Five Forces Analysis

      5. Global Vehicle Industrial Tablet Pc Market Analysis (USD Billion), Insights and Forecast, 2018-2029

      • 5.1. Key Findings / Summary
      • 5.2. Market Analysis, Insights and Forecast – By Segment 1
        • 5.2.1. Sub-Segment 1
        • 5.2.2. Sub-Segment 2
      • 5.3. Market Analysis, Insights and Forecast – By Segment 2
        • 5.3.1. Sub-Segment 1
        • 5.3.2. Sub-Segment 2
        • 5.3.3. Sub-Segment 3
        • 5.3.4. Others
      • 5.4. Market Analysis, Insights and Forecast – By Segment 3
        • 5.4.1. Sub-Segment 1
        • 5.4.2. Sub-Segment 2
        • 5.4.3. Sub-Segment 3
        • 5.4.4. Others
      • 5.5. Market Analysis, Insights and Forecast – By Region
        • 5.5.1. North America
        • 5.5.2. Latin America
        • 5.5.3. Europe
        • 5.5.4. Asia Pacific
        • 5.5.5. Middle East and Africa

      6. North America Vehicle Industrial Tablet Pc Market Analysis (USD Billion), Insights and Forecast, 2018-2029

      • 6.1. Key Findings / Summary
      • 6.2. Market Analysis, Insights and Forecast – By Segment 1
        • 6.2.1. Sub-Segment 1
        • 6.2.2. Sub-Segment 2
      • 6.3. Market Analysis, Insights and Forecast – By Segment 2
        • 6.3.1. Sub-Segment 1
        • 6.3.2. Sub-Segment 2
        • 6.3.3. Sub-Segment 3
        • 6.3.4. Others
      • 6.4. Market Analysis, Insights and Forecast – By Segment 3
        • 6.4.1. Sub-Segment 1
        • 6.4.2. Sub-Segment 2
        • 6.4.3. Sub-Segment 3
        • 6.4.4. Others
      • 6.5. Market Analysis, Insights and Forecast – By Country
        • 6.5.1. U.S.
        • 6.5.2. Canada

      7. Latin America Vehicle Industrial Tablet Pc Market Analysis (USD Billion), Insights and Forecast, 2018-2029

      • 7.1. Key Findings / Summary
      • 7.2. Market Analysis, Insights and Forecast – By Segment 1
        • 7.2.1. Sub-Segment 1
        • 7.2.2. Sub-Segment 2
      • 7.3. Market Analysis, Insights and Forecast – By Segment 2
        • 7.3.1. Sub-Segment 1
        • 7.3.2. Sub-Segment 2
        • 7.3.3. Sub-Segment 3
        • 7.3.4. Others
      • 7.4. Market Analysis, Insights and Forecast – By Segment 3
        • 7.4.1. Sub-Segment 1
        • 7.4.2. Sub-Segment 2
        • 7.4.3. Sub-Segment 3
        • 7.4.4. Others
      • 7.5. Insights and Forecast – By Country
        • 7.5.1. Brazil
        • 7.5.2. Mexico
        • 7.5.3. Rest of Latin America

      8. Europe Vehicle Industrial Tablet Pc Market Analysis (USD Billion), Insights and Forecast, 2018-2029

      • 8.1. Key Findings / Summary
      • 8.2. Market Analysis, Insights and Forecast – By Segment 1
        • 8.2.1. Sub-Segment 1
        • 8.2.2. Sub-Segment 2
      • 8.3. Market Analysis, Insights and Forecast – By Segment 2
        • 8.3.1. Sub-Segment 1
        • 8.3.2. Sub-Segment 2
        • 8.3.3. Sub-Segment 3
        • 8.3.4. Others
      • 8.4. Market Analysis, Insights and Forecast – By Segment 3
        • 8.4.1. Sub-Segment 1
        • 8.4.2. Sub-Segment 2
        • 8.4.3. Sub-Segment 3
        • 8.4.4. Others
      • 8.5. Market Analysis, Insights and Forecast – By Country
        • 8.5.1. UK
        • 8.5.2. Germany
        • 8.5.3. France
        • 8.5.4. Italy
        • 8.5.5. Spain
        • 8.5.6. Russia
        • 8.5.7. Rest of Europe

      9. Asia Pacific Vehicle Industrial Tablet Pc Market Analysis (USD Billion), Insights and Forecast, 2018-2029

      • 9.1. Key Findings / Summary
      • 9.2. Market Analysis, Insights and Forecast – By Segment 1
        • 9.2.1. Sub-Segment 1
        • 9.2.2. Sub-Segment 2
      • 9.3. Market Analysis, Insights and Forecast – By Segment 2
        • 9.3.1. Sub-Segment 1
        • 9.3.2. Sub-Segment 2
        • 9.3.3. Sub-Segment 3
        • 9.3.4. Others
      • 9.4. Market Analysis, Insights and Forecast – By Segment 3
        • 9.4.1. Sub-Segment 1
        • 9.4.2. Sub-Segment 2
        • 9.4.3. Sub-Segment 3
        • 9.4.4. Others
      • 9.5. Market Analysis, Insights and Forecast – By Country
        • 9.5.1. China
        • 9.5.2. India
        • 9.5.3. Japan
        • 9.5.4. Australia
        • 9.5.5. South East Asia
        • 9.5.6. Rest of Asia Pacific

      10. Middle East & Africa Vehicle Industrial Tablet Pc Market Analysis (USD Billion), Insights and Forecast, 2018-2029

      • 10.1. Key Findings / Summary
      • 10.2. Market Analysis, Insights and Forecast – By Segment 1
        • 10.2.1. Sub-Segment 1
        • 10.2.2. Sub-Segment 2
      • 10.3. Market Analysis, Insights and Forecast – By Segment 2
        • 10.3.1. Sub-Segment 1
        • 10.3.2. Sub-Segment 2
        • 10.3.3. Sub-Segment 3
        • 10.3.4. Others
      • 10.4. Market Analysis, Insights and Forecast – By Segment 3
        • 10.4.1. Sub-Segment 1
        • 10.4.2. Sub-Segment 2
        • 10.4.3. Sub-Segment 3
        • 10.4.4. Others
      • 10.5. Market Analysis, Insights and Forecast – By Country
        • 10.5.1. GCC
        • 10.5.2. South Africa
        • 10.5.3. Rest of Middle East & Africa

      11. Competitive Analysis

      • 11.1. Company Market Share Analysis, 2018
      • 11.2. Key Industry Developments
      • 11.3. Company Profile
        • 11.3.1. Company 1
          • 11.3.1.1. Business Overview
          • 11.3.1.2. Segment 1 & Service Offering
          • 11.3.1.3. Overall Revenue
          • 11.3.1.4. Geographic Presence
          • 11.3.1.5. Recent Development
        *Similar details will be provided for the following companies
        • 11.3.2. Company 2
        • 11.3.3. Company 3
        • 11.3.4. Company 4
        • 11.3.5. Company 5
        • 11.3.6. Company 6
        • 11.3.7. Company 7
        • 11.3.8. Company 8
        • 11.3.9. Company 9
        • 11.3.10. Company 10
        • 11.3.11. Company 11
        • 11.3.12. Company 12
      List of Figures

      Figure 1: Global Vehicle Industrial Tablet Pc Market Revenue Breakdown (USD Billion, %) by Region, 2022 & 2029
      Figure 2: Global Vehicle Industrial Tablet Pc Market Value Share (%), By Segment 1, 2022 & 2029
      Figure 3: Global Vehicle Industrial Tablet Pc Market Forecast (USD Billion), by Sub-Segment 1, 2018-2029
      Figure 4: Global Vehicle Industrial Tablet Pc Market Forecast (USD Billion), by Sub-Segment 2, 2018-2029
      Figure 5: Global Vehicle Industrial Tablet Pc Market Value Share (%), By Segment 2, 2022 & 2029
      Figure 6: Global Vehicle Industrial Tablet Pc Market Forecast (USD Billion), by Sub-Segment 1, 2018-2029
      Figure 7: Global Vehicle Industrial Tablet Pc Market Forecast (USD Billion), by Sub-Segment 2, 2018-2029
      Figure 8: Global Vehicle Industrial Tablet Pc Market Forecast (USD Billion), by Sub-Segment 3, 2018-2029
      Figure 9: Global Vehicle Industrial Tablet Pc Market Forecast (USD Billion), by Others, 2018-2029
      Figure 10: Global Vehicle Industrial Tablet Pc Market Value Share (%), By Segment 3, 2022 & 2029
      Figure 11: Global Vehicle Industrial Tablet Pc Market Forecast (USD Billion), by Sub-Segment 1, 2018-2029
      Figure 12: Global Vehicle Industrial Tablet Pc Market Forecast (USD Billion), by Sub-Segment 2, 2018-2029
      Figure 13: Global Vehicle Industrial Tablet Pc Market Forecast (USD Billion), by Sub-Segment 3, 2018-2029
      Figure 14: Global Vehicle Industrial Tablet Pc Market Forecast (USD Billion), by Others, 2018-2029
      Figure 15: Global Vehicle Industrial Tablet Pc Market Value (USD Billion), by Region, 2022 & 2029
      Figure 16: North America Vehicle Industrial Tablet Pc Market Value Share (%), By Segment 1, 2022 & 2029
      Figure 17: North America Vehicle Industrial Tablet Pc Market Forecast (USD Billion), by Sub-Segment 1, 2018-2029
      Figure 18: North America Vehicle Industrial Tablet Pc Market Forecast (USD Billion), by Sub-Segment 2, 2018-2029
      Figure 19: North America Vehicle Industrial Tablet Pc Market Value Share (%), By Segment 2, 2022 & 2029
      Figure 20: North America Vehicle Industrial Tablet Pc Market Forecast (USD Billion), by Sub-Segment 1, 2018-2029
      Figure 21: North America Vehicle Industrial Tablet Pc Market Forecast (USD Billion), by Sub-Segment 2, 2018-2029
      Figure 22: North America Vehicle Industrial Tablet Pc Market Forecast (USD Billion), by Sub-Segment 3, 2018-2029
      Figure 23: North America Vehicle Industrial Tablet Pc Market Forecast (USD Billion), by Others, 2018-2029
      Figure 24: North America Vehicle Industrial Tablet Pc Market Value Share (%), By Segment 3, 2022 & 2029
      Figure 25: North America Vehicle Industrial Tablet Pc Market Forecast (USD Billion), by Sub-Segment 1, 2018-2029
      Figure 26: North America Vehicle Industrial Tablet Pc Market Forecast (USD Billion), by Sub-Segment 2, 2018-2029
      Figure 27: North America Vehicle Industrial Tablet Pc Market Forecast (USD Billion), by Sub-Segment 3, 2018-2029
      Figure 28: North America Vehicle Industrial Tablet Pc Market Forecast (USD Billion), by Others, 2018-2029
      Figure 29: North America Vehicle Industrial Tablet Pc Market Forecast (USD Billion), by U.S., 2018-2029
      Figure 30: North America Vehicle Industrial Tablet Pc Market Forecast (USD Billion), by Canada, 2018-2029
      Figure 31: Latin America Vehicle Industrial Tablet Pc Market Value Share (%), By Segment 1, 2022 & 2029
      Figure 32: Latin America Vehicle Industrial Tablet Pc Market Forecast (USD Billion), by Sub-Segment 1, 2018-2029
      Figure 33: Latin America Vehicle Industrial Tablet Pc Market Forecast (USD Billion), by Sub-Segment 2, 2018-2029
      Figure 34: Latin America Vehicle Industrial Tablet Pc Market Value Share (%), By Segment 2, 2022 & 2029
      Figure 35: Latin America Vehicle Industrial Tablet Pc Market Forecast (USD Billion), by Sub-Segment 1, 2018-2029
      Figure 36: Latin America Vehicle Industrial Tablet Pc Market Forecast (USD Billion), by Sub-Segment 2, 2018-2029
      Figure 37: Latin America Vehicle Industrial Tablet Pc Market Forecast (USD Billion), by Sub-Segment 3, 2018-2029
      Figure 38: Latin America Vehicle Industrial Tablet Pc Market Forecast (USD Billion), by Others, 2018-2029
      Figure 39: Latin America Vehicle Industrial Tablet Pc Market Value Share (%), By Segment 3, 2022 & 2029
      Figure 40: Latin America Vehicle Industrial Tablet Pc Market Forecast (USD Billion), by Sub-Segment 1, 2018-2029
      Figure 41: Latin America Vehicle Industrial Tablet Pc Market Forecast (USD Billion), by Sub-Segment 2, 2018-2029
      Figure 42: Latin America Vehicle Industrial Tablet Pc Market Forecast (USD Billion), by Sub-Segment 3, 2018-2029
      Figure 43: Latin America Vehicle Industrial Tablet Pc Market Forecast (USD Billion), by Others, 2018-2029
      Figure 44: Latin America Vehicle Industrial Tablet Pc Market Forecast (USD Billion), by Brazil, 2018-2029
      Figure 45: Latin America Vehicle Industrial Tablet Pc Market Forecast (USD Billion), by Mexico, 2018-2029
      Figure 46: Latin America Vehicle Industrial Tablet Pc Market Forecast (USD Billion), by Rest of Latin America, 2018-2029
      Figure 47: Europe Vehicle Industrial Tablet Pc Market Value Share (%), By Segment 1, 2022 & 2029
      Figure 48: Europe Vehicle Industrial Tablet Pc Market Forecast (USD Billion), by Sub-Segment 1, 2018-2029
      Figure 49: Europe Vehicle Industrial Tablet Pc Market Forecast (USD Billion), by Sub-Segment 2, 2018-2029
      Figure 50: Europe Vehicle Industrial Tablet Pc Market Value Share (%), By Segment 2, 2022 & 2029
      Figure 51: Europe Vehicle Industrial Tablet Pc Market Forecast (USD Billion), by Sub-Segment 1, 2018-2029
      Figure 52: Europe Vehicle Industrial Tablet Pc Market Forecast (USD Billion), by Sub-Segment 2, 2018-2029
      Figure 53: Europe Vehicle Industrial Tablet Pc Market Forecast (USD Billion), by Sub-Segment 3, 2018-2029
      Figure 54: Europe Vehicle Industrial Tablet Pc Market Forecast (USD Billion), by Others, 2018-2029
      Figure 55: Europe Vehicle Industrial Tablet Pc Market Value Share (%), By Segment 3, 2022 & 2029
      Figure 56: Europe Vehicle Industrial Tablet Pc Market Forecast (USD Billion), by Sub-Segment 1, 2018-2029
      Figure 57: Europe Vehicle Industrial Tablet Pc Market Forecast (USD Billion), by Sub-Segment 2, 2018-2029
      Figure 58: Europe Vehicle Industrial Tablet Pc Market Forecast (USD Billion), by Sub-Segment 3, 2018-2029
      Figure 59: Europe Vehicle Industrial Tablet Pc Market Forecast (USD Billion), by Others, 2018-2029
      Figure 60: Europe Vehicle Industrial Tablet Pc Market Forecast (USD Billion), by U.K., 2018-2029
      Figure 61: Europe Vehicle Industrial Tablet Pc Market Forecast (USD Billion), by Germany, 2018-2029
      Figure 62: Europe Vehicle Industrial Tablet Pc Market Forecast (USD Billion), by France, 2018-2029
      Figure 63: Europe Vehicle Industrial Tablet Pc Market Forecast (USD Billion), by Italy, 2018-2029
      Figure 64: Europe Vehicle Industrial Tablet Pc Market Forecast (USD Billion), by Spain, 2018-2029
      Figure 65: Europe Vehicle Industrial Tablet Pc Market Forecast (USD Billion), by Russia, 2018-2029
      Figure 66: Europe Vehicle Industrial Tablet Pc Market Forecast (USD Billion), by Rest of Europe, 2018-2029
      Figure 67: Asia Pacific Vehicle Industrial Tablet Pc Market Value Share (%), By Segment 1, 2022 & 2029
      Figure 68: Asia Pacific Vehicle Industrial Tablet Pc Market Forecast (USD Billion), by Sub-Segment 1, 2018-2029
      Figure 69: Asia Pacific Vehicle Industrial Tablet Pc Market Forecast (USD Billion), by Sub-Segment 2, 2018-2029
      Figure 70: Asia Pacific Vehicle Industrial Tablet Pc Market Value Share (%), By Segment 2, 2022 & 2029
      Figure 71: Asia Pacific Vehicle Industrial Tablet Pc Market Forecast (USD Billion), by Sub-Segment 1, 2018-2029
      Figure 72: Asia Pacific Vehicle Industrial Tablet Pc Market Forecast (USD Billion), by Sub-Segment 2, 2018-2029
      Figure 73: Asia Pacific Vehicle Industrial Tablet Pc Market Forecast (USD Billion), by Sub-Segment 3, 2018-2029
      Figure 74: Asia Pacific Vehicle Industrial Tablet Pc Market Forecast (USD Billion), by Others, 2018-2029
      Figure 75: Asia Pacific Vehicle Industrial Tablet Pc Market Value Share (%), By Segment 3, 2022 & 2029
      Figure 76: Asia Pacific Vehicle Industrial Tablet Pc Market Forecast (USD Billion), by Sub-Segment 1, 2018-2029
      Figure 77: Asia Pacific Vehicle Industrial Tablet Pc Market Forecast (USD Billion), by Sub-Segment 2, 2018-2029
      Figure 78: Asia Pacific Vehicle Industrial Tablet Pc Market Forecast (USD Billion), by Sub-Segment 3, 2018-2029
      Figure 79: Asia Pacific Vehicle Industrial Tablet Pc Market Forecast (USD Billion), by Others, 2018-2029
      Figure 80: Asia Pacific Vehicle Industrial Tablet Pc Market Forecast (USD Billion), by China, 2018-2029
      Figure 81: Asia Pacific Vehicle Industrial Tablet Pc Market Forecast (USD Billion), by India, 2018-2029
      Figure 82: Asia Pacific Vehicle Industrial Tablet Pc Market Forecast (USD Billion), by Japan, 2018-2029
      Figure 83: Asia Pacific Vehicle Industrial Tablet Pc Market Forecast (USD Billion), by Australia, 2018-2029
      Figure 84: Asia Pacific Vehicle Industrial Tablet Pc Market Forecast (USD Billion), by Southeast Asia, 2018-2029
      Figure 85: Asia Pacific Vehicle Industrial Tablet Pc Market Forecast (USD Billion), by Rest of Asia Pacific, 2018-2029
      Figure 86: Middle East & Africa Vehicle Industrial Tablet Pc Market Value Share (%), By Segment 1, 2022 & 2029
      Figure 87: Middle East & Africa Vehicle Industrial Tablet Pc Market Forecast (USD Billion), by Sub-Segment 1, 2018-2029
      Figure 88: Middle East & Africa Vehicle Industrial Tablet Pc Market Forecast (USD Billion), by Sub-Segment 2, 2018-2029
      Figure 89: Middle East & Africa Vehicle Industrial Tablet Pc Market Value Share (%), By Segment 2, 2022 & 2029
      Figure 90: Middle East & Africa Vehicle Industrial Tablet Pc Market Forecast (USD Billion), by Sub-Segment 1, 2018-2029
      Figure 91: Middle East & Africa Vehicle Industrial Tablet Pc Market Forecast (USD Billion), by Sub-Segment 2, 2018-2029
      Figure 92: Middle East & Africa Vehicle Industrial Tablet Pc Market Forecast (USD Billion), by Sub-Segment 3, 2018-2029
      Figure 93: Middle East & Africa Vehicle Industrial Tablet Pc Market Forecast (USD Billion), by Others, 2018-2029
      Figure 94: Middle East & Africa Vehicle Industrial Tablet Pc Market Value Share (%), By Segment 3, 2022 & 2029
      Figure 95: Middle East & Africa Vehicle Industrial Tablet Pc Market Forecast (USD Billion), by Sub-Segment 1, 2018-2029
      Figure 96: Middle East & Africa Vehicle Industrial Tablet Pc Market Forecast (USD Billion), by Sub-Segment 2, 2018-2029
      Figure 97: Middle East & Africa Vehicle Industrial Tablet Pc Market Forecast (USD Billion), by Sub-Segment 3, 2018-2029
      Figure 98: Middle East & Africa Vehicle Industrial Tablet Pc Market Forecast (USD Billion), by Others, 2018-2029
      Figure 99: Middle East & Africa Vehicle Industrial Tablet Pc Market Forecast (USD Billion), by GCC, 2018-2029
      Figure 100: Middle East & Africa Vehicle Industrial Tablet Pc Market Forecast (USD Billion), by South Africa, 2018-2029
      Figure 101: Middle East & Africa Vehicle Industrial Tablet Pc Market Forecast (USD Billion), by Rest of Middle East & Africa, 2018-2029 
      List of Tables
      Table 1: Global Vehicle Industrial Tablet Pc Market Revenue (USD Billion) Forecast, by Segment 1, 2018-2029
      Table 2: Global Vehicle Industrial Tablet Pc Market Revenue (USD Billion) Forecast, by Segment 2, 2018-2029
      Table 3: Global Vehicle Industrial Tablet Pc Market Revenue (USD Billion) Forecast, by Segment 3, 2018-2029
      Table 4: Global Vehicle Industrial Tablet Pc Market Revenue (USD Billion) Forecast, by Region, 2018-2029
      Table 5: North America Vehicle Industrial Tablet Pc Market Revenue (USD Billion) Forecast, by Segment 1, 2018-2029
      Table 6: North America Vehicle Industrial Tablet Pc Market Revenue (USD Billion) Forecast, by Segment 2, 2018-2029
      Table 7: North America Vehicle Industrial Tablet Pc Market Revenue (USD Billion) Forecast, by Segment 3, 2018-2029
      Table 8: North America Vehicle Industrial Tablet Pc Market Revenue (USD Billion) Forecast, by Country, 2018-2029
      Table 9: Europe Vehicle Industrial Tablet Pc Market Revenue (USD Billion) Forecast, by Segment 1, 2018-2029
      Table 10: Europe Vehicle Industrial Tablet Pc Market Revenue (USD Billion) Forecast, by Segment 2, 2018-2029
      Table 11: Europe Vehicle Industrial Tablet Pc Market Revenue (USD Billion) Forecast, by Segment 3, 2018-2029
      Table 12: Europe Vehicle Industrial Tablet Pc Market Revenue (USD Billion) Forecast, by Country, 2018-2029
      Table 13: Latin America Vehicle Industrial Tablet Pc Market Revenue (USD Billion) Forecast, by Segment 1, 2018-2029
      Table 14: Latin America Vehicle Industrial Tablet Pc Market Revenue (USD Billion) Forecast, by Segment 2, 2018-2029
      Table 15: Latin America Vehicle Industrial Tablet Pc Market Revenue (USD Billion) Forecast, by Segment 3, 2018-2029
      Table 16: Latin America Vehicle Industrial Tablet Pc Market Revenue (USD Billion) Forecast, by Country, 2018-2029
      Table 17: Asia Pacific Vehicle Industrial Tablet Pc Market Revenue (USD Billion) Forecast, by Segment 1, 2018-2029
      Table 18: Asia Pacific Vehicle Industrial Tablet Pc Market Revenue (USD Billion) Forecast, by Segment 2, 2018-2029
      Table 19: Asia Pacific Vehicle Industrial Tablet Pc Market Revenue (USD Billion) Forecast, by Segment 3, 2018-2029
      Table 20: Asia Pacific Vehicle Industrial Tablet Pc Market Revenue (USD Billion) Forecast, by Country, 2018-2029
      Table 21: Middle East & Africa Vehicle Industrial Tablet Pc Market Revenue (USD Billion) Forecast, by Segment 1, 2018-2029
      Table 22: Middle East & Africa Vehicle Industrial Tablet Pc Market Revenue (USD Billion) Forecast, by Segment 2, 2018-2029
      Table 23: Middle East & Africa Vehicle Industrial Tablet Pc Market Revenue (USD Billion) Forecast, by Segment 3, 2018-2029
      Table 24: Middle East & Africa Vehicle Industrial Tablet Pc Market Revenue (USD Billion) Forecast, by Country, 2018-2029
      Research Process

      Data Library Research are conducted by industry experts who offer insight on industry structure, market segmentations technology assessment and competitive landscape (CL), and penetration, as well as on emerging trends. Their analysis is based on primary interviews (~ 80%) and secondary research (~ 20%) as well as years of professional expertise in their respective industries. Adding to this, by analysing historical trends and current market positions, our analysts predict where the market will be headed for the next five years. Furthermore, the varying trends of segment & categories geographically presented are also studied and the estimated based on the primary & secondary research.

      In this particular report from the supply side Data Library Research has conducted primary surveys (interviews) with the key level executives (VP, CEO’s, Marketing Director, Business Development Manager and SOFT) of the companies that active & prominent as well as the midsized organization

      FIGURE 1: DLR RESEARH PROCESS

      research-methodology1

      Primary Research

      Extensive primary research was conducted to gain a deeper insight of the market and industry performance. The analysis is based on both primary and secondary research as well as years of professional expertise in the respective industries.

      In addition to analysing current and historical trends, our analysts predict where the market is headed over the next five years.

      It varies by segment for these categories geographically presented in the list of market tables. Speaking about this particular report we have conducted primary surveys (interviews) with the key level executives (VP, CEO’s, Marketing Director, Business Development Manager and many more) of the major players active in the market.

      Secondary Research

      Secondary research was mainly used to collect and identify information useful for the extensive, technical, market-oriented, and Friend’s study of the Global Extra Neutral Alcohol. It was also used to obtain key information about major players, market classification and segmentation according to the industry trends, geographical markets, and developments related to the market and technology perspectives. For this study, analysts have gathered information from various credible sources, such as annual reports, sec filings, journals, white papers, SOFT presentations, and company web sites.

      Market Size Estimation

      Both, top-down and bottom-up approaches were used to estimate and validate the size of the Global market and to estimate the size of various other dependent submarkets in the overall Extra Neutral Alcohol. The key players in the market were identified through secondary research and their market contributions in the respective geographies were determined through primary and secondary research.

      Forecast Model

      research-methodology2