Vein Visualization System Market Overview and Analysis:

The Vein Visualization System Market Revenue was valued at USD 543.2 million in 2025 and is estimated to reach USD 1.42 billion by 2032, growing at a CAGR of 12.2% from 2025-2032.

The Vein Visualization System Market encompasses advanced medical devices designed to assist healthcare professionals in locating veins for procedures such as blood draws, intravenous (IV) therapy, and injections. These systems use technologies like near-infrared (NIR) imaging and ultrasound to improve accuracy, reduce patient discomfort, and minimize procedural errors. Growing demand in hospitals, clinics, and home healthcare, coupled with technological advancements, has driven market expansion globally, improving efficiency in vascular access procedures.

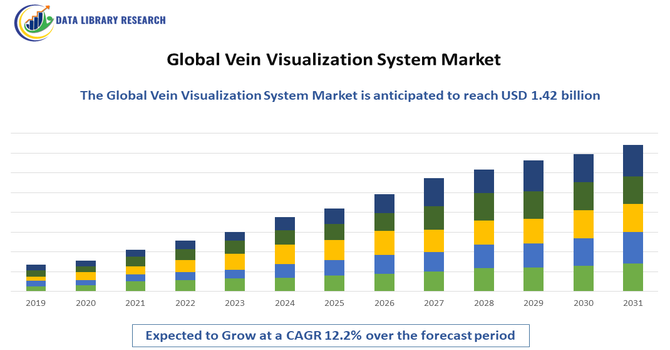
The Global Vein Visualization System Market is experiencing robust growth, driven by the increasing demand for advanced medical imaging technologies that enhance vascular access accuracy and patient safety. The rising prevalence of chronic diseases requiring frequent intravenous procedures, such as diabetes, cancer, and cardiovascular disorders, is significantly contributing to market expansion. Additionally, the growing adoption of minimally invasive procedures, coupled with technological advancements in near-infrared (NIR), ultrasound, and augmented reality-based vein visualization systems, is improving success rates in venipuncture and reducing patient discomfort.

Vein Visualization System Market Latest Trends

The Global Vein Visualization System Market is witnessing several emerging trends driven by rapid technological innovation and the growing emphasis on precision healthcare. One key trend is the integration of near-infrared (NIR) and ultrasound imaging technologies to enhance vein detection accuracy, particularly in patients with difficult venous access. The adoption of wearable and handheld vein visualization devices is increasing, offering portability and ease of use in both hospital and point-of-care settings. Additionally, the incorporation of augmented reality (AR) and artificial intelligence (AI) is transforming vascular imaging by enabling real-time vein mapping and predictive analytics for improved clinical outcomes.

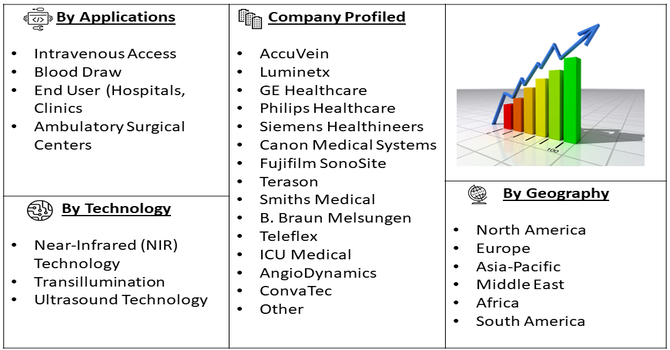
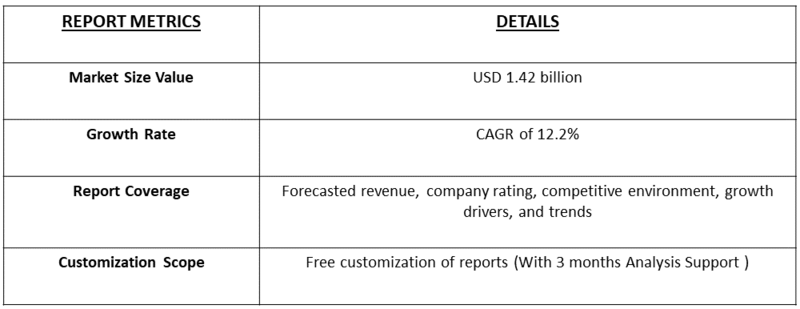
Segmentation: Global Vein Visualization System Market is segmented By Technology (Near-Infrared (NIR) Technology, Transillumination and Ultrasound Technology), Application (Intravenous Access, and Blood Draw), End User (Hospitals, Clinics, Ambulatory Surgical Centers), and Geography (North America, Europe, Asia-Pacific, Middle East and Africa, and South America). The report provides the value (in USD million) for the above segments.

Market Drivers:

  • Increasing Prevalence of Chronic Diseases and Rising Demand for Intravenous Procedures

One of the primary drivers of the Global Vein Visualization System Market is the growing prevalence of chronic and lifestyle-related diseases that require frequent intravenous interventions. Conditions such as diabetes, cancer, cardiovascular disorders, and renal diseases often necessitate repeated venipuncture for drug administration, chemotherapy, or blood sampling. This has led to a significant increase in the demand for accurate and efficient vein access solutions. Vein visualization systems, particularly those using near-infrared (NIR) and ultrasound technologies, assist healthcare professionals in locating veins quickly and precisely, reducing the number of failed attempts and improving patient comfort. The growing geriatric population, which often presents challenges in vascular access due to fragile or invisible veins, further amplifies the need for these advanced systems. Consequently, the adoption of vein visualization devices is expanding rapidly across hospitals, emergency departments, and long-term care facilities to improve procedural efficiency and patient safety.

  • Technological Advancements and Integration of Imaging Innovations

Continuous advancements in imaging technologies have been a key catalyst for the growth of the vein visualization system market. The development of near-infrared (NIR) imaging, augmented reality (AR), and portable ultrasound-based systems has transformed the way clinicians perform venipuncture and vascular access procedures. Modern devices offer real-time, high-resolution visualization of subcutaneous veins, enabling healthcare providers to make more precise punctures even in patients with difficult venous access. Moreover, the integration of artificial intelligence (AI) and machine learning (ML) algorithms in newer systems is enhancing image clarity, vein pattern recognition, and procedural guidance. The trend toward handheld, wireless, and battery-powered devices is further driving adoption across diverse healthcare settings, including emergency care, home healthcare, and ambulatory centers. These technological innovations not only improve accuracy and workflow efficiency but also contribute to cost savings by minimizing procedural failures and reducing the need for repeated venipuncture attempts.

Market Restraints

  • High Cost of Devices and Limited Affordability in Developing Regions

The major restraints hampering the growth of the Global Vein Visualization System Market is the high cost associated with advanced imaging devices. Vein visualization systems, particularly those based on near-infrared (NIR) and ultrasound technologies, require substantial investment in equipment, maintenance, and staff training. This poses a financial burden for small and medium-sized healthcare facilities, especially in developing countries where hospital budgets are constrained. Additionally, reimbursement policies for these devices are often inadequate or non-existent in emerging markets, further discouraging adoption. As a result, despite their clinical benefits, many healthcare providers in low- and middle-income regions continue to rely on traditional vein-finding techniques, which limits the market’s overall penetration.

Socio Economic Impact on Vein Visualization System Market

The Global Vein Visualization System Market has a significant socioeconomic impact by directly improving healthcare efficiency and patient safety. By dramatically reducing the rate of failed venipunctures, these systems save valuable clinical time and decrease the waste of supplies, leading to substantial cost savings for hospitals and healthcare systems. More importantly, they enhance the patient experience by minimizing pain, anxiety, and the risk of complications like bruising and infection, particularly for vulnerable populations such as children and the elderly. This improvement in clinical effectiveness and patient satisfaction contributes to higher quality of care and better overall hospital performance metrics.

Segmental Analysis:

  • Near-Infrared (NIR) Technology segment is expected to witness highest growth over the forecast period

The Near-Infrared (NIR) Technology segment dominates the market due to its high accuracy, non-invasive nature, and superior visualization of veins located deep under the skin. NIR-based systems are increasingly adopted in hospitals and clinics as they reduce failed venipuncture attempts, enhance patient comfort, and improve procedural efficiency. The growing integration of NIR technology with portable and handheld devices further supports its widespread use, particularly in pediatric, geriatric, and obese patient populations.

  • Intravenous Access segment is expected to witness highest growth over the forecast period

The Intravenous Access segment accounts for the largest market share, driven by the rising demand for accurate vein detection during IV therapy, fluid administration, and blood sampling procedures. With the increasing prevalence of chronic diseases such as cancer, diabetes, and cardiovascular disorders that require regular IV interventions, the adoption of visualization systems to improve accuracy and minimize patient discomfort has grown significantly.

  • Hospitals segment is expected to witness highest growth over the forecast period

The Hospitals segment holds the leading position owing to the high patient volume, frequent need for intravenous therapies, and continuous technological upgrades in healthcare facilities. Hospitals are increasingly investing in vein visualization systems to enhance clinical outcomes, reduce procedural complications, and optimize workflow efficiency.

  • North America region is expected to witness highest growth over the forecast period

The North America region is expected to witness the highest growth over the forecast period in the Global Vein Visualization System Market. This growth is driven by the presence of a highly developed healthcare infrastructure, increasing adoption of advanced medical imaging technologies, and growing emphasis on patient safety and comfort during venipuncture procedures. For instance, in April 2025, Boston Scientific Corporation reported positive 12-month primary endpoint results from the second phase of the ADVANTAGE AF clinical trial, evaluating the FARAPULSE Pulsed Field Ablation (PFA) System and FARAPOINT PFA Catheter in patients with persistent atrial fibrillation. The key findings were presented at the PFA Live Case Summit in San Diego and published in Circulation. This advancement demonstrated improved procedural accuracy and safety, positively impacting the adoption of vein visualization and cardiac imaging technologies globally.

The region’s strong focus on reducing procedural errors, coupled with high healthcare spending and supportive government initiatives for technological innovation in hospitals and clinics, further supports market expansion. Additionally, the rising prevalence of chronic diseases requiring frequent intravenous access, along with the growing geriatric population, is fueling the demand for vein visualization systems across the United States and Canada.

Vein Visualization System Market Competitive Landscape

The Global Vein Visualization System Market is competitive and comprises a mix of specialized vein-imaging device manufacturers and large medical-imaging and vascular-access companies. Market players compete on imaging accuracy, portability, ease of use, integration with clinical workflows, and after-sales support, while pursuing product innovation, strategic partnerships, and regional expansion to capture growing demand across hospitals, clinics, and ambulatory settings.

Key Players:

  • AccuVein
  • Luminetx
  • GE Healthcare
  • Philips Healthcare
  • Siemens Healthineers
  • Canon Medical Systems
  • Fujifilm SonoSite
  • Terason
  • Smiths Medical
  • B. Braun Melsungen
  • Teleflex
  • BD (Becton, Dickinson and Company)
  • ICU Medical
  • AngioDynamics
  • ConvaTec
  • Medtronic
  • Hologic
  • Mindray (Shenzhen Mindray)
  • Nihon Kohden
  • Masimo

Recent Development

  • In March 2025, Abbott received CE Mark in Europe for its Volt PFA System to treat atrial fibrillation (AFib) patients. Following the earlier-than-expected approval, Abbott initiated commercial PFA procedures in the EU with physicians experienced in the Volt system through prior clinical studies. The company planned to further expand the device’s use across European markets during the second half of the year, enhancing access to advanced AFib treatment options.


  • In April 2025, Royal Philips introduced its VeriSight Pro 3D Intracardiac Echocardiography (ICE) catheter in Europe, following its prior success in the United States. The device provided real-time 3D imaging directly inside the heart, enabling physicians to perform cardiac procedures with enhanced clarity and precision. By eliminating the need for general anesthesia, the catheter improved procedural efficiency and patient comfort, marking a significant advancement in minimally invasive cardiac imaging technology.


Frequently Asked Questions (FAQ) :

Q1. What are the main growth-driving factors for this market?

The primary driver is the increasing difficulty of successful venipuncture (starting an IV or drawing blood), especially in certain patient groups like pediatric, geriatric, obese, or chronically ill patients who have challenging veins. Repeated, failed attempts cause pain and anxiety for patients and lead to wasted time and resources for clinicians. Vein visualization systems address this by using near-infrared light to display a real-time map of the vasculature on the skin surface. This ability to significantly reduce first-stick failure rates and prevent complications like hematomas is accelerating adoption in emergency rooms and hospitals globally.

Q2. What are the main restraining factors for this market?

The biggest constraint on the market is the high initial cost of advanced vein visualization devices, particularly the capital expenditure required for sophisticated infrared projectors and portable units. For smaller clinics or healthcare facilities in developing regions, this upfront investment can be difficult to justify, limiting widespread adoption. Additionally, while the technology is effective, there can be a steep learning curve for staff to integrate the device seamlessly into their workflow. In some settings, lack of proper training or skepticism about its value can also slow down the utilization and purchase of new systems.

Q3. Which segment is expected to witness high growth?

The Portable Devices Segment is projected to witness the highest growth rate. While traditional fixed or cart-mounted systems are common, portable, handheld devices offer unparalleled versatility and ease of use. They can be quickly moved between different clinical settings, such as different patient rooms, outpatient clinics, or even ambulances, without complex setup. This mobility makes them ideal for emergency situations and departments with high patient turnover. Furthermore, continuous improvements in battery life and image clarity in compact units make the portable option increasingly attractive to healthcare providers focused on efficiency.

Q4. Who are the top major players for this market?

The Global Vein Visualization System Market features several major international players specializing in medical imaging and diagnostics. Key companies dominating this space include Christie Medical Holdings (with its VeinViewer product), AccuVein (famous for its handheld device), Vyaire Medical (through its acquired assets), and Infrared Imaging Systems. These top players focus on continuous innovation, such as integrating features like image capture and network connectivity. Their strong distribution networks, existing relationships with major hospitals, and robust intellectual property portfolios solidify their market leadership.

Q5. Which country is the largest player?

North America, particularly the United States, is the largest and most dominant regional player in the Vein Visualization System Market. This dominance stems from the region's high healthcare spending, early adoption of advanced medical technology, and a well-established infrastructure for reimbursement. Furthermore, a high awareness among both clinicians and patients about the benefits of improved venipuncture success—especially in complex patient care settings like oncology and emergency medicine—drives strong demand. The presence of major market headquarters in the U.S. also contributes to its market leadership.

Vein Visualization System MARKET STUDY GLOBAL MARKET ANALYSIS, INSIGHTS AND FORECAST, 2022-2029

    1. Introduction

    • 1.1. Research Scope
    • 1.2. Market Segmentation
    • 1.3. Research Methodology
    • 1.4. Definitions and Assumptions

    2. Executive Summary

      3. Market Dynamics

      • 3.1. Market Drivers
      • 3.2. Market Restraints
      • 3.3. Market Opportunities

      4. Key Insights

      • 4.1. Key Emerging Trends – For Major Countries
      • 4.2. Latest Technological Advancement
      • 4.3. Regulatory Landscape
      • 4.4. Industry SWOT Analysis
      • 4.5. Porters Five Forces Analysis

      5. Global Vein Visualization System Market Analysis (USD Billion), Insights and Forecast, 2018-2029

      • 5.1. Key Findings / Summary
      • 5.2. Market Analysis, Insights and Forecast – By Segment 1
        • 5.2.1. Sub-Segment 1
        • 5.2.2. Sub-Segment 2
      • 5.3. Market Analysis, Insights and Forecast – By Segment 2
        • 5.3.1. Sub-Segment 1
        • 5.3.2. Sub-Segment 2
        • 5.3.3. Sub-Segment 3
        • 5.3.4. Others
      • 5.4. Market Analysis, Insights and Forecast – By Segment 3
        • 5.4.1. Sub-Segment 1
        • 5.4.2. Sub-Segment 2
        • 5.4.3. Sub-Segment 3
        • 5.4.4. Others
      • 5.5. Market Analysis, Insights and Forecast – By Region
        • 5.5.1. North America
        • 5.5.2. Latin America
        • 5.5.3. Europe
        • 5.5.4. Asia Pacific
        • 5.5.5. Middle East and Africa

      6. North America Vein Visualization System Market Analysis (USD Billion), Insights and Forecast, 2018-2029

      • 6.1. Key Findings / Summary
      • 6.2. Market Analysis, Insights and Forecast – By Segment 1
        • 6.2.1. Sub-Segment 1
        • 6.2.2. Sub-Segment 2
      • 6.3. Market Analysis, Insights and Forecast – By Segment 2
        • 6.3.1. Sub-Segment 1
        • 6.3.2. Sub-Segment 2
        • 6.3.3. Sub-Segment 3
        • 6.3.4. Others
      • 6.4. Market Analysis, Insights and Forecast – By Segment 3
        • 6.4.1. Sub-Segment 1
        • 6.4.2. Sub-Segment 2
        • 6.4.3. Sub-Segment 3
        • 6.4.4. Others
      • 6.5. Market Analysis, Insights and Forecast – By Country
        • 6.5.1. U.S.
        • 6.5.2. Canada

      7. Latin America Vein Visualization System Market Analysis (USD Billion), Insights and Forecast, 2018-2029

      • 7.1. Key Findings / Summary
      • 7.2. Market Analysis, Insights and Forecast – By Segment 1
        • 7.2.1. Sub-Segment 1
        • 7.2.2. Sub-Segment 2
      • 7.3. Market Analysis, Insights and Forecast – By Segment 2
        • 7.3.1. Sub-Segment 1
        • 7.3.2. Sub-Segment 2
        • 7.3.3. Sub-Segment 3
        • 7.3.4. Others
      • 7.4. Market Analysis, Insights and Forecast – By Segment 3
        • 7.4.1. Sub-Segment 1
        • 7.4.2. Sub-Segment 2
        • 7.4.3. Sub-Segment 3
        • 7.4.4. Others
      • 7.5. Insights and Forecast – By Country
        • 7.5.1. Brazil
        • 7.5.2. Mexico
        • 7.5.3. Rest of Latin America

      8. Europe Vein Visualization System Market Analysis (USD Billion), Insights and Forecast, 2018-2029

      • 8.1. Key Findings / Summary
      • 8.2. Market Analysis, Insights and Forecast – By Segment 1
        • 8.2.1. Sub-Segment 1
        • 8.2.2. Sub-Segment 2
      • 8.3. Market Analysis, Insights and Forecast – By Segment 2
        • 8.3.1. Sub-Segment 1
        • 8.3.2. Sub-Segment 2
        • 8.3.3. Sub-Segment 3
        • 8.3.4. Others
      • 8.4. Market Analysis, Insights and Forecast – By Segment 3
        • 8.4.1. Sub-Segment 1
        • 8.4.2. Sub-Segment 2
        • 8.4.3. Sub-Segment 3
        • 8.4.4. Others
      • 8.5. Market Analysis, Insights and Forecast – By Country
        • 8.5.1. UK
        • 8.5.2. Germany
        • 8.5.3. France
        • 8.5.4. Italy
        • 8.5.5. Spain
        • 8.5.6. Russia
        • 8.5.7. Rest of Europe

      9. Asia Pacific Vein Visualization System Market Analysis (USD Billion), Insights and Forecast, 2018-2029

      • 9.1. Key Findings / Summary
      • 9.2. Market Analysis, Insights and Forecast – By Segment 1
        • 9.2.1. Sub-Segment 1
        • 9.2.2. Sub-Segment 2
      • 9.3. Market Analysis, Insights and Forecast – By Segment 2
        • 9.3.1. Sub-Segment 1
        • 9.3.2. Sub-Segment 2
        • 9.3.3. Sub-Segment 3
        • 9.3.4. Others
      • 9.4. Market Analysis, Insights and Forecast – By Segment 3
        • 9.4.1. Sub-Segment 1
        • 9.4.2. Sub-Segment 2
        • 9.4.3. Sub-Segment 3
        • 9.4.4. Others
      • 9.5. Market Analysis, Insights and Forecast – By Country
        • 9.5.1. China
        • 9.5.2. India
        • 9.5.3. Japan
        • 9.5.4. Australia
        • 9.5.5. South East Asia
        • 9.5.6. Rest of Asia Pacific

      10. Middle East & Africa Vein Visualization System Market Analysis (USD Billion), Insights and Forecast, 2018-2029

      • 10.1. Key Findings / Summary
      • 10.2. Market Analysis, Insights and Forecast – By Segment 1
        • 10.2.1. Sub-Segment 1
        • 10.2.2. Sub-Segment 2
      • 10.3. Market Analysis, Insights and Forecast – By Segment 2
        • 10.3.1. Sub-Segment 1
        • 10.3.2. Sub-Segment 2
        • 10.3.3. Sub-Segment 3
        • 10.3.4. Others
      • 10.4. Market Analysis, Insights and Forecast – By Segment 3
        • 10.4.1. Sub-Segment 1
        • 10.4.2. Sub-Segment 2
        • 10.4.3. Sub-Segment 3
        • 10.4.4. Others
      • 10.5. Market Analysis, Insights and Forecast – By Country
        • 10.5.1. GCC
        • 10.5.2. South Africa
        • 10.5.3. Rest of Middle East & Africa

      11. Competitive Analysis

      • 11.1. Company Market Share Analysis, 2018
      • 11.2. Key Industry Developments
      • 11.3. Company Profile
        • 11.3.1. Company 1
          • 11.3.1.1. Business Overview
          • 11.3.1.2. Segment 1 & Service Offering
          • 11.3.1.3. Overall Revenue
          • 11.3.1.4. Geographic Presence
          • 11.3.1.5. Recent Development
        *Similar details will be provided for the following companies
        • 11.3.2. Company 2
        • 11.3.3. Company 3
        • 11.3.4. Company 4
        • 11.3.5. Company 5
        • 11.3.6. Company 6
        • 11.3.7. Company 7
        • 11.3.8. Company 8
        • 11.3.9. Company 9
        • 11.3.10. Company 10
        • 11.3.11. Company 11
        • 11.3.12. Company 12
      List of Figures

      Figure 1: Global Vein Visualization System Market Revenue Breakdown (USD Billion, %) by Region, 2022 & 2029
      Figure 2: Global Vein Visualization System Market Value Share (%), By Segment 1, 2022 & 2029
      Figure 3: Global Vein Visualization System Market Forecast (USD Billion), by Sub-Segment 1, 2018-2029
      Figure 4: Global Vein Visualization System Market Forecast (USD Billion), by Sub-Segment 2, 2018-2029
      Figure 5: Global Vein Visualization System Market Value Share (%), By Segment 2, 2022 & 2029
      Figure 6: Global Vein Visualization System Market Forecast (USD Billion), by Sub-Segment 1, 2018-2029
      Figure 7: Global Vein Visualization System Market Forecast (USD Billion), by Sub-Segment 2, 2018-2029
      Figure 8: Global Vein Visualization System Market Forecast (USD Billion), by Sub-Segment 3, 2018-2029
      Figure 9: Global Vein Visualization System Market Forecast (USD Billion), by Others, 2018-2029
      Figure 10: Global Vein Visualization System Market Value Share (%), By Segment 3, 2022 & 2029
      Figure 11: Global Vein Visualization System Market Forecast (USD Billion), by Sub-Segment 1, 2018-2029
      Figure 12: Global Vein Visualization System Market Forecast (USD Billion), by Sub-Segment 2, 2018-2029
      Figure 13: Global Vein Visualization System Market Forecast (USD Billion), by Sub-Segment 3, 2018-2029
      Figure 14: Global Vein Visualization System Market Forecast (USD Billion), by Others, 2018-2029
      Figure 15: Global Vein Visualization System Market Value (USD Billion), by Region, 2022 & 2029
      Figure 16: North America Vein Visualization System Market Value Share (%), By Segment 1, 2022 & 2029
      Figure 17: North America Vein Visualization System Market Forecast (USD Billion), by Sub-Segment 1, 2018-2029
      Figure 18: North America Vein Visualization System Market Forecast (USD Billion), by Sub-Segment 2, 2018-2029
      Figure 19: North America Vein Visualization System Market Value Share (%), By Segment 2, 2022 & 2029
      Figure 20: North America Vein Visualization System Market Forecast (USD Billion), by Sub-Segment 1, 2018-2029
      Figure 21: North America Vein Visualization System Market Forecast (USD Billion), by Sub-Segment 2, 2018-2029
      Figure 22: North America Vein Visualization System Market Forecast (USD Billion), by Sub-Segment 3, 2018-2029
      Figure 23: North America Vein Visualization System Market Forecast (USD Billion), by Others, 2018-2029
      Figure 24: North America Vein Visualization System Market Value Share (%), By Segment 3, 2022 & 2029
      Figure 25: North America Vein Visualization System Market Forecast (USD Billion), by Sub-Segment 1, 2018-2029
      Figure 26: North America Vein Visualization System Market Forecast (USD Billion), by Sub-Segment 2, 2018-2029
      Figure 27: North America Vein Visualization System Market Forecast (USD Billion), by Sub-Segment 3, 2018-2029
      Figure 28: North America Vein Visualization System Market Forecast (USD Billion), by Others, 2018-2029
      Figure 29: North America Vein Visualization System Market Forecast (USD Billion), by U.S., 2018-2029
      Figure 30: North America Vein Visualization System Market Forecast (USD Billion), by Canada, 2018-2029
      Figure 31: Latin America Vein Visualization System Market Value Share (%), By Segment 1, 2022 & 2029
      Figure 32: Latin America Vein Visualization System Market Forecast (USD Billion), by Sub-Segment 1, 2018-2029
      Figure 33: Latin America Vein Visualization System Market Forecast (USD Billion), by Sub-Segment 2, 2018-2029
      Figure 34: Latin America Vein Visualization System Market Value Share (%), By Segment 2, 2022 & 2029
      Figure 35: Latin America Vein Visualization System Market Forecast (USD Billion), by Sub-Segment 1, 2018-2029
      Figure 36: Latin America Vein Visualization System Market Forecast (USD Billion), by Sub-Segment 2, 2018-2029
      Figure 37: Latin America Vein Visualization System Market Forecast (USD Billion), by Sub-Segment 3, 2018-2029
      Figure 38: Latin America Vein Visualization System Market Forecast (USD Billion), by Others, 2018-2029
      Figure 39: Latin America Vein Visualization System Market Value Share (%), By Segment 3, 2022 & 2029
      Figure 40: Latin America Vein Visualization System Market Forecast (USD Billion), by Sub-Segment 1, 2018-2029
      Figure 41: Latin America Vein Visualization System Market Forecast (USD Billion), by Sub-Segment 2, 2018-2029
      Figure 42: Latin America Vein Visualization System Market Forecast (USD Billion), by Sub-Segment 3, 2018-2029
      Figure 43: Latin America Vein Visualization System Market Forecast (USD Billion), by Others, 2018-2029
      Figure 44: Latin America Vein Visualization System Market Forecast (USD Billion), by Brazil, 2018-2029
      Figure 45: Latin America Vein Visualization System Market Forecast (USD Billion), by Mexico, 2018-2029
      Figure 46: Latin America Vein Visualization System Market Forecast (USD Billion), by Rest of Latin America, 2018-2029
      Figure 47: Europe Vein Visualization System Market Value Share (%), By Segment 1, 2022 & 2029
      Figure 48: Europe Vein Visualization System Market Forecast (USD Billion), by Sub-Segment 1, 2018-2029
      Figure 49: Europe Vein Visualization System Market Forecast (USD Billion), by Sub-Segment 2, 2018-2029
      Figure 50: Europe Vein Visualization System Market Value Share (%), By Segment 2, 2022 & 2029
      Figure 51: Europe Vein Visualization System Market Forecast (USD Billion), by Sub-Segment 1, 2018-2029
      Figure 52: Europe Vein Visualization System Market Forecast (USD Billion), by Sub-Segment 2, 2018-2029
      Figure 53: Europe Vein Visualization System Market Forecast (USD Billion), by Sub-Segment 3, 2018-2029
      Figure 54: Europe Vein Visualization System Market Forecast (USD Billion), by Others, 2018-2029
      Figure 55: Europe Vein Visualization System Market Value Share (%), By Segment 3, 2022 & 2029
      Figure 56: Europe Vein Visualization System Market Forecast (USD Billion), by Sub-Segment 1, 2018-2029
      Figure 57: Europe Vein Visualization System Market Forecast (USD Billion), by Sub-Segment 2, 2018-2029
      Figure 58: Europe Vein Visualization System Market Forecast (USD Billion), by Sub-Segment 3, 2018-2029
      Figure 59: Europe Vein Visualization System Market Forecast (USD Billion), by Others, 2018-2029
      Figure 60: Europe Vein Visualization System Market Forecast (USD Billion), by U.K., 2018-2029
      Figure 61: Europe Vein Visualization System Market Forecast (USD Billion), by Germany, 2018-2029
      Figure 62: Europe Vein Visualization System Market Forecast (USD Billion), by France, 2018-2029
      Figure 63: Europe Vein Visualization System Market Forecast (USD Billion), by Italy, 2018-2029
      Figure 64: Europe Vein Visualization System Market Forecast (USD Billion), by Spain, 2018-2029
      Figure 65: Europe Vein Visualization System Market Forecast (USD Billion), by Russia, 2018-2029
      Figure 66: Europe Vein Visualization System Market Forecast (USD Billion), by Rest of Europe, 2018-2029
      Figure 67: Asia Pacific Vein Visualization System Market Value Share (%), By Segment 1, 2022 & 2029
      Figure 68: Asia Pacific Vein Visualization System Market Forecast (USD Billion), by Sub-Segment 1, 2018-2029
      Figure 69: Asia Pacific Vein Visualization System Market Forecast (USD Billion), by Sub-Segment 2, 2018-2029
      Figure 70: Asia Pacific Vein Visualization System Market Value Share (%), By Segment 2, 2022 & 2029
      Figure 71: Asia Pacific Vein Visualization System Market Forecast (USD Billion), by Sub-Segment 1, 2018-2029
      Figure 72: Asia Pacific Vein Visualization System Market Forecast (USD Billion), by Sub-Segment 2, 2018-2029
      Figure 73: Asia Pacific Vein Visualization System Market Forecast (USD Billion), by Sub-Segment 3, 2018-2029
      Figure 74: Asia Pacific Vein Visualization System Market Forecast (USD Billion), by Others, 2018-2029
      Figure 75: Asia Pacific Vein Visualization System Market Value Share (%), By Segment 3, 2022 & 2029
      Figure 76: Asia Pacific Vein Visualization System Market Forecast (USD Billion), by Sub-Segment 1, 2018-2029
      Figure 77: Asia Pacific Vein Visualization System Market Forecast (USD Billion), by Sub-Segment 2, 2018-2029
      Figure 78: Asia Pacific Vein Visualization System Market Forecast (USD Billion), by Sub-Segment 3, 2018-2029
      Figure 79: Asia Pacific Vein Visualization System Market Forecast (USD Billion), by Others, 2018-2029
      Figure 80: Asia Pacific Vein Visualization System Market Forecast (USD Billion), by China, 2018-2029
      Figure 81: Asia Pacific Vein Visualization System Market Forecast (USD Billion), by India, 2018-2029
      Figure 82: Asia Pacific Vein Visualization System Market Forecast (USD Billion), by Japan, 2018-2029
      Figure 83: Asia Pacific Vein Visualization System Market Forecast (USD Billion), by Australia, 2018-2029
      Figure 84: Asia Pacific Vein Visualization System Market Forecast (USD Billion), by Southeast Asia, 2018-2029
      Figure 85: Asia Pacific Vein Visualization System Market Forecast (USD Billion), by Rest of Asia Pacific, 2018-2029
      Figure 86: Middle East & Africa Vein Visualization System Market Value Share (%), By Segment 1, 2022 & 2029
      Figure 87: Middle East & Africa Vein Visualization System Market Forecast (USD Billion), by Sub-Segment 1, 2018-2029
      Figure 88: Middle East & Africa Vein Visualization System Market Forecast (USD Billion), by Sub-Segment 2, 2018-2029
      Figure 89: Middle East & Africa Vein Visualization System Market Value Share (%), By Segment 2, 2022 & 2029
      Figure 90: Middle East & Africa Vein Visualization System Market Forecast (USD Billion), by Sub-Segment 1, 2018-2029
      Figure 91: Middle East & Africa Vein Visualization System Market Forecast (USD Billion), by Sub-Segment 2, 2018-2029
      Figure 92: Middle East & Africa Vein Visualization System Market Forecast (USD Billion), by Sub-Segment 3, 2018-2029
      Figure 93: Middle East & Africa Vein Visualization System Market Forecast (USD Billion), by Others, 2018-2029
      Figure 94: Middle East & Africa Vein Visualization System Market Value Share (%), By Segment 3, 2022 & 2029
      Figure 95: Middle East & Africa Vein Visualization System Market Forecast (USD Billion), by Sub-Segment 1, 2018-2029
      Figure 96: Middle East & Africa Vein Visualization System Market Forecast (USD Billion), by Sub-Segment 2, 2018-2029
      Figure 97: Middle East & Africa Vein Visualization System Market Forecast (USD Billion), by Sub-Segment 3, 2018-2029
      Figure 98: Middle East & Africa Vein Visualization System Market Forecast (USD Billion), by Others, 2018-2029
      Figure 99: Middle East & Africa Vein Visualization System Market Forecast (USD Billion), by GCC, 2018-2029
      Figure 100: Middle East & Africa Vein Visualization System Market Forecast (USD Billion), by South Africa, 2018-2029
      Figure 101: Middle East & Africa Vein Visualization System Market Forecast (USD Billion), by Rest of Middle East & Africa, 2018-2029 
      List of Tables
      Table 1: Global Vein Visualization System Market Revenue (USD Billion) Forecast, by Segment 1, 2018-2029
      Table 2: Global Vein Visualization System Market Revenue (USD Billion) Forecast, by Segment 2, 2018-2029
      Table 3: Global Vein Visualization System Market Revenue (USD Billion) Forecast, by Segment 3, 2018-2029
      Table 4: Global Vein Visualization System Market Revenue (USD Billion) Forecast, by Region, 2018-2029
      Table 5: North America Vein Visualization System Market Revenue (USD Billion) Forecast, by Segment 1, 2018-2029
      Table 6: North America Vein Visualization System Market Revenue (USD Billion) Forecast, by Segment 2, 2018-2029
      Table 7: North America Vein Visualization System Market Revenue (USD Billion) Forecast, by Segment 3, 2018-2029
      Table 8: North America Vein Visualization System Market Revenue (USD Billion) Forecast, by Country, 2018-2029
      Table 9: Europe Vein Visualization System Market Revenue (USD Billion) Forecast, by Segment 1, 2018-2029
      Table 10: Europe Vein Visualization System Market Revenue (USD Billion) Forecast, by Segment 2, 2018-2029
      Table 11: Europe Vein Visualization System Market Revenue (USD Billion) Forecast, by Segment 3, 2018-2029
      Table 12: Europe Vein Visualization System Market Revenue (USD Billion) Forecast, by Country, 2018-2029
      Table 13: Latin America Vein Visualization System Market Revenue (USD Billion) Forecast, by Segment 1, 2018-2029
      Table 14: Latin America Vein Visualization System Market Revenue (USD Billion) Forecast, by Segment 2, 2018-2029
      Table 15: Latin America Vein Visualization System Market Revenue (USD Billion) Forecast, by Segment 3, 2018-2029
      Table 16: Latin America Vein Visualization System Market Revenue (USD Billion) Forecast, by Country, 2018-2029
      Table 17: Asia Pacific Vein Visualization System Market Revenue (USD Billion) Forecast, by Segment 1, 2018-2029
      Table 18: Asia Pacific Vein Visualization System Market Revenue (USD Billion) Forecast, by Segment 2, 2018-2029
      Table 19: Asia Pacific Vein Visualization System Market Revenue (USD Billion) Forecast, by Segment 3, 2018-2029
      Table 20: Asia Pacific Vein Visualization System Market Revenue (USD Billion) Forecast, by Country, 2018-2029
      Table 21: Middle East & Africa Vein Visualization System Market Revenue (USD Billion) Forecast, by Segment 1, 2018-2029
      Table 22: Middle East & Africa Vein Visualization System Market Revenue (USD Billion) Forecast, by Segment 2, 2018-2029
      Table 23: Middle East & Africa Vein Visualization System Market Revenue (USD Billion) Forecast, by Segment 3, 2018-2029
      Table 24: Middle East & Africa Vein Visualization System Market Revenue (USD Billion) Forecast, by Country, 2018-2029
      Research Process

      Data Library Research are conducted by industry experts who offer insight on industry structure, market segmentations technology assessment and competitive landscape (CL), and penetration, as well as on emerging trends. Their analysis is based on primary interviews (~ 80%) and secondary research (~ 20%) as well as years of professional expertise in their respective industries. Adding to this, by analysing historical trends and current market positions, our analysts predict where the market will be headed for the next five years. Furthermore, the varying trends of segment & categories geographically presented are also studied and the estimated based on the primary & secondary research.

      In this particular report from the supply side Data Library Research has conducted primary surveys (interviews) with the key level executives (VP, CEO’s, Marketing Director, Business Development Manager and SOFT) of the companies that active & prominent as well as the midsized organization

      FIGURE 1: DLR RESEARH PROCESS

      research-methodology1

      Primary Research

      Extensive primary research was conducted to gain a deeper insight of the market and industry performance. The analysis is based on both primary and secondary research as well as years of professional expertise in the respective industries.

      In addition to analysing current and historical trends, our analysts predict where the market is headed over the next five years.

      It varies by segment for these categories geographically presented in the list of market tables. Speaking about this particular report we have conducted primary surveys (interviews) with the key level executives (VP, CEO’s, Marketing Director, Business Development Manager and many more) of the major players active in the market.

      Secondary Research

      Secondary research was mainly used to collect and identify information useful for the extensive, technical, market-oriented, and Friend’s study of the Global Extra Neutral Alcohol. It was also used to obtain key information about major players, market classification and segmentation according to the industry trends, geographical markets, and developments related to the market and technology perspectives. For this study, analysts have gathered information from various credible sources, such as annual reports, sec filings, journals, white papers, SOFT presentations, and company web sites.

      Market Size Estimation

      Both, top-down and bottom-up approaches were used to estimate and validate the size of the Global market and to estimate the size of various other dependent submarkets in the overall Extra Neutral Alcohol. The key players in the market were identified through secondary research and their market contributions in the respective geographies were determined through primary and secondary research.

      Forecast Model

      research-methodology2

      Happy to Assist You

      If you have a question?

      info@datalibraryresearch.com

      IND : +91 955 279 0357

      Browse Related Reports