Video Glasses Market Overview and Analysis:

The Market size was valued at USD 823.8 million in 2025 and is projected to reach USD 1.87 billion by 2032, growing with a CAGR of 12.76% from 2025-2032.

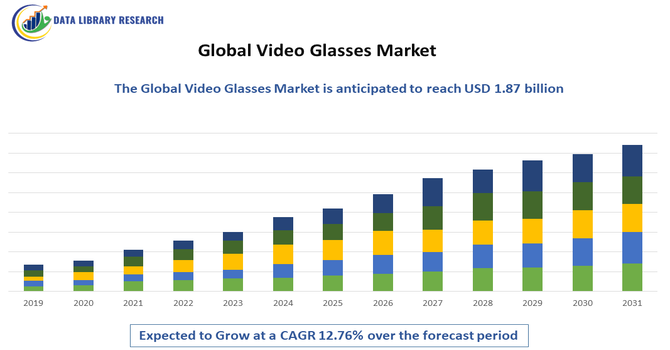
The global video glasses market refers to wearable devices that combine eyewear with video recording, streaming, and display capabilities. These smart glasses are used for entertainment, sports, professional applications, and augmented reality experiences. Growing consumer interest, technological advancements, and rising demand for hands-free video capture drive market expansion worldwide.

The growth in the global video glasses market is driven by rising demand for immersive entertainment, increasing use of AR/VR in gaming and training, advancements in lightweight wearable displays, expanding applications in healthcare and industry, growing interest in hands-free recording, and broader adoption of smart wearable technologies supported by improving connectivity and processing power.

Video Glasses Market Latest Trends

The global video glasses market is experiencing rapid innovation driven by the integration of augmented and virtual reality, high-definition micro-displays, and improved battery efficiency. Lightweight and ergonomic designs are becoming more common as manufacturers focus on enhancing user comfort for extended wear. Demand is expanding beyond entertainment into healthcare, education, field services, and logistics, where hands-free visualization improves productivity and accuracy. The rise of remote collaboration and digital training is further accelerating adoption.

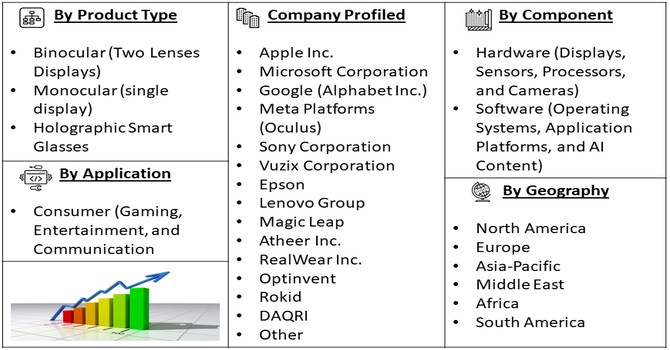
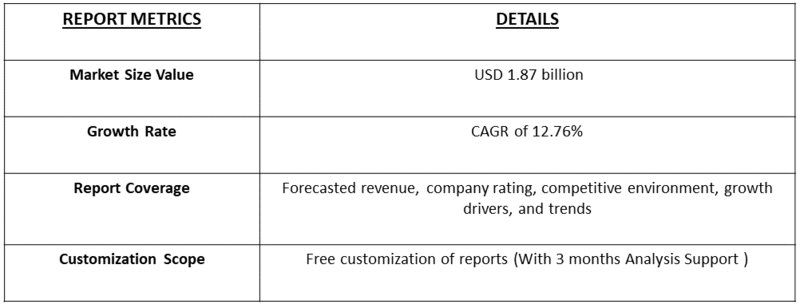
Segmentation: The Global Video Glasses Market is segmented by Product Type (Binocular (Two Lenses Displays), Monocular (single display), and Holographic Smart Glasses), Component (Hardware (Displays, Sensors, Processors, and Cameras) and Software (Operating Systems, Application Platforms, and AI Content), Application (Consumer (Gaming, Entertainment, and Communication) and Enterprise (Healthcare, Manufacturing, Logistics, and Retail) and Geography (North America, Europe, Asia-Pacific, Middle East and Africa, and South America). The report provides the value (in USD million) for the above segments.

Market Drivers:

  • Rising Demand for Immersive and Hands-Free Visual Experiences

The major driver of the global video glasses market is the rapidly growing demand for immersive and hands-free visual experiences across entertainment, gaming, and professional applications. Consumers increasingly seek portable, high-quality wearable displays that offer cinematic viewing, augmented reality overlays, and interactive features without relying on traditional screens. In professional environments—such as healthcare, manufacturing, field services, and logistics—video glasses provide real-time visual guidance, remote collaboration, and improved operational accuracy. These capabilities enhance productivity and reduce human error, encouraging businesses to adopt wearable technologies as part of digital transformation efforts.

  • Technological Advancements in Optics, Connectivity, and AI Integration

The another significant driver is the continuous technological advancement in optics, sensors, connectivity, and processing power. Modern video glasses incorporate lightweight materials, high-definition displays, improved battery life, and seamless integration with smartphones, cloud platforms, and AI-based applications.

In April 2025, Nokia’s showcase of AI-era networking solutions advanced optics, connectivity, and AI integration by enabling scalable, efficient cloud and data center networks. This development indirectly supported the global video glasses market, enhancing real-time data processing, low-latency streaming, and AR/VR performance, driving innovation and adoption in wearable visual technologies. These innovations enhance usability, making wearables more comfortable and efficient for long-duration use. Industries are increasingly adopting AR-enabled glasses for tasks like equipment maintenance, surgical assistance, remote inspections, and training simulations, benefiting from real-time data overlays and improved situational awareness.

Market Restraints:

  • High Costs, Privacy Concerns, and Limited Consumer Awareness

Despite strong growth prospects, the global video glasses market faces challenges related to high costs, privacy concerns, and limited consumer awareness. Advanced models with AR/VR capabilities, specialized sensors, and high-resolution optics often come with premium price tags, restricting adoption among price-sensitive users and small businesses. Additionally, privacy risks—such as unauthorized recording, data collection, and potential misuse of facial or environmental capture—create hesitation among consumers and regulators. Many users also remain unfamiliar with wearable display technologies, leading to slow acceptance outside tech-savvy groups.

Socio Economic Impact on Video Glasses Market

The socioeconomic impact of the global video glasses market is substantial, influencing workforce productivity, education quality, and accessibility. In industrial and medical settings, video glasses enable real-time guidance, reducing errors and enhancing worker training. They support remote assistance, lowering operational costs and bridging skill gaps in underserved regions. In education, immersive learning improves engagement and knowledge retention. The market also stimulates job creation in manufacturing, software development, and content creation. However, widespread adoption raises concerns about digital inequality and data privacy. Overall, video glasses contribute to technological empowerment, economic growth, and the development of more efficient and connected communities.

Segmental Analysis:

  • Binocular segment is expected to witness highest growth over the forecast period

The binocular segment is expected to witness the highest growth as demand rises for immersive, high-resolution viewing experiences in entertainment, gaming, and professional applications. Binocular video glasses offer enhanced depth perception, wider fields of view, and superior visual clarity, making them ideal for AR/VR environments. Their ability to deliver realistic 3D visualization supports training, simulation, and remote assistance across industries. With advancements in lightweight optics and ergonomic designs, binocular models are becoming more comfortable for extended use. Increased adoption in education, defense, and industrial workflows further accelerates their dominance, positioning this segment for robust expansion throughout the forecast period.

  • Operating Systems segment is expected to witness highest growth over the forecast period

The operating systems segment is expected to witness the highest growth due to the rising demand for more intelligent, interactive, and customizable wearable experiences. Modern video glasses are increasingly equipped with advanced operating systems that support app integration, gesture controls, voice commands, and seamless connectivity with smartphones and cloud platforms. These OS-enabled systems offer enhanced processing capabilities, improved user interfaces, and greater compatibility with AR/VR applications, making them essential for enterprise and consumer use. As developers create specialized apps for healthcare, logistics, and entertainment, the value of integrated operating systems continues to grow, driving widespread adoption and strengthening market expansion.

  • Healthcare segment is expected to witness highest growth over the forecast period

The healthcare segment is expected to witness the highest growth as medical professionals increasingly adopt video glasses for surgical assistance, remote consultations, medical training, and real-time diagnostics. These devices enable hands-free viewing of patient data, imaging results, and procedural guidance directly within the clinician’s field of vision. They enhance precision, reduce errors, and improve collaboration, especially in telemedicine and emergency care. Video glasses also support augmented reality overlays that assist in minimally invasive procedures. As healthcare institutions prioritize digital transformation and efficiency, the integration of wearable visualization tools continues to rise, positioning the segment for strong and sustained growth.

  • North American Region segment is expected to witness highest growth over the forecast period

The North American region is expected to witness the highest growth due to strong technological infrastructure, rapid adoption of AR/VR applications, and significant investments from leading tech companies. Industries such as healthcare, military, manufacturing, and entertainment increasingly utilize video glasses to enhance training, productivity, and remote operations. For instance, in April 2025, Meta’s next-generation smart glasses, featuring a display and wrist-worn XR controller, strengthened North America’s position in the global video glasses market. The innovation boosted regional adoption, accelerated AR/VR integration, and enhanced consumer and enterprise interest, driving technological advancement and reinforcing North America as a key growth hub in wearable visual technologies.

High consumer awareness, supportive regulatory environments, and widespread integration of 5G further accelerate demand. The region also benefits from a strong ecosystem of hardware developers, software providers, and innovation-driven startups. With continuous advancements and early adoption of emerging technologies, North America remains a key driver of market expansion throughout the forecast period.

Video Glasses Market Competitive Landscape:

The competitive landscape of the global video glasses market features a mix of established technology companies and innovative startups focused on AR/VR wearables. Key players compete on display clarity, battery performance, comfort, and integration with existing digital ecosystems. Companies are investing in R&D to develop high-resolution optics, lightweight frames, and advanced sensors that improve user experience. Strategic partnerships with healthcare, defense, and industrial firms are becoming essential for market expansion. Pricing strategies vary widely, with premium models targeting professional applications and affordable versions appealing to consumers.

The major players for this market are:

  • Apple Inc.
  • Microsoft Corporation
  • Google (Alphabet Inc.)
  • Meta Platforms (Oculus)
  • Sony Corporation
  • Vuzix Corporation
  • Epson
  • Lenovo Group
  • Magic Leap
  • Atheer Inc.
  • RealWear Inc.
  • Optinvent
  • Rokid
  • Everysight
  • DAQRI
  • Kopin Corporation
  • Toshiba
  • Samsung Electronics
  • Royole Corporation
  • Xiaomi Corporation

Recent Development

  • In December 2025, Namibox launched AI-enabled smart learning glasses. Designed for young learners, the 35g device—lighter than most models—featured a MINI AR binocular full-color waveguide display simulating a 126-inch screen. It included AI-powered learning tools, real-time translation, lecture recording, object recognition, customizable lenses, and efficient power management.


  • In September 2025, Meta Platforms Inc. introduced the USD 799 Meta Ray-Ban Display, its first smart glasses with a built-in screen showing messages, video calls, and AI query results. Featuring gesture controls via a neural wristband, the glasses launch Sept. 30 alongside updated screen-free Ray-Bans and a new Oakley model.


Frequently Asked Questions (FAQ) :

Q1. What are the main growth-driving factors for this market?

The rapid adoption of Augmented Reality (AR) and Virtual Reality (VR) technologies across major industries is the primary driver. Businesses are using video glasses for hands-free workflow optimization, remote expert assistance, and employee training, leading to higher efficiency.

Q2. What are the main restraining factors for this market?

Key restraining factors include the high cost of premium video glasses, which limits mass consumer market penetration. Another major barrier is the limited battery life, which affects usability during extended sessions, especially in enterprise environments. Concerns regarding user data privacy and the social acceptability of wearing camera-equipped glasses in public also slow down widespread adoption.

Q3. Which segment is expected to witness high growth?

The Commercial/Enterprise application segment, covering manufacturing, healthcare, and logistics, is expected to see the highest growth. These industries heavily invest in immersive training simulators and remote guidance tools, which provide immediate returns on investment. Within consumer products, the segment focused on Gaming and Entertainment will also experience significant expansion as hardware costs decrease and content availability increases.

Q4. Who are the top major players for this market?

The market is led by major technology firms and hardware specialists. Top players include established names like Meta (with Ray-Ban Meta and Quest), Microsoft (HoloLens), and Vuzix Corporation, alongside Asian giants such as Seiko Epson and TCL. Competition revolves around developing improved optics, larger fields of view, and strong developer ecosystems for content creation.

Q5. Which country is the largest player?

North America, primarily driven by the United States, holds the largest current market share. This dominance is due to the presence of key technology developers, early enterprise adoption, and significant government and military investment in AR/VR training.

Video Glasses MARKET STUDY GLOBAL MARKET ANALYSIS, INSIGHTS AND FORECAST, 2022-2029

    1. Introduction

    • 1.1. Research Scope
    • 1.2. Market Segmentation
    • 1.3. Research Methodology
    • 1.4. Definitions and Assumptions

    2. Executive Summary

      3. Market Dynamics

      • 3.1. Market Drivers
      • 3.2. Market Restraints
      • 3.3. Market Opportunities

      4. Key Insights

      • 4.1. Key Emerging Trends – For Major Countries
      • 4.2. Latest Technological Advancement
      • 4.3. Regulatory Landscape
      • 4.4. Industry SWOT Analysis
      • 4.5. Porters Five Forces Analysis

      5. Global Video Glasses Market Analysis (USD Billion), Insights and Forecast, 2018-2029

      • 5.1. Key Findings / Summary
      • 5.2. Market Analysis, Insights and Forecast – By Segment 1
        • 5.2.1. Sub-Segment 1
        • 5.2.2. Sub-Segment 2
      • 5.3. Market Analysis, Insights and Forecast – By Segment 2
        • 5.3.1. Sub-Segment 1
        • 5.3.2. Sub-Segment 2
        • 5.3.3. Sub-Segment 3
        • 5.3.4. Others
      • 5.4. Market Analysis, Insights and Forecast – By Segment 3
        • 5.4.1. Sub-Segment 1
        • 5.4.2. Sub-Segment 2
        • 5.4.3. Sub-Segment 3
        • 5.4.4. Others
      • 5.5. Market Analysis, Insights and Forecast – By Region
        • 5.5.1. North America
        • 5.5.2. Latin America
        • 5.5.3. Europe
        • 5.5.4. Asia Pacific
        • 5.5.5. Middle East and Africa

      6. North America Video Glasses Market Analysis (USD Billion), Insights and Forecast, 2018-2029

      • 6.1. Key Findings / Summary
      • 6.2. Market Analysis, Insights and Forecast – By Segment 1
        • 6.2.1. Sub-Segment 1
        • 6.2.2. Sub-Segment 2
      • 6.3. Market Analysis, Insights and Forecast – By Segment 2
        • 6.3.1. Sub-Segment 1
        • 6.3.2. Sub-Segment 2
        • 6.3.3. Sub-Segment 3
        • 6.3.4. Others
      • 6.4. Market Analysis, Insights and Forecast – By Segment 3
        • 6.4.1. Sub-Segment 1
        • 6.4.2. Sub-Segment 2
        • 6.4.3. Sub-Segment 3
        • 6.4.4. Others
      • 6.5. Market Analysis, Insights and Forecast – By Country
        • 6.5.1. U.S.
        • 6.5.2. Canada

      7. Latin America Video Glasses Market Analysis (USD Billion), Insights and Forecast, 2018-2029

      • 7.1. Key Findings / Summary
      • 7.2. Market Analysis, Insights and Forecast – By Segment 1
        • 7.2.1. Sub-Segment 1
        • 7.2.2. Sub-Segment 2
      • 7.3. Market Analysis, Insights and Forecast – By Segment 2
        • 7.3.1. Sub-Segment 1
        • 7.3.2. Sub-Segment 2
        • 7.3.3. Sub-Segment 3
        • 7.3.4. Others
      • 7.4. Market Analysis, Insights and Forecast – By Segment 3
        • 7.4.1. Sub-Segment 1
        • 7.4.2. Sub-Segment 2
        • 7.4.3. Sub-Segment 3
        • 7.4.4. Others
      • 7.5. Insights and Forecast – By Country
        • 7.5.1. Brazil
        • 7.5.2. Mexico
        • 7.5.3. Rest of Latin America

      8. Europe Video Glasses Market Analysis (USD Billion), Insights and Forecast, 2018-2029

      • 8.1. Key Findings / Summary
      • 8.2. Market Analysis, Insights and Forecast – By Segment 1
        • 8.2.1. Sub-Segment 1
        • 8.2.2. Sub-Segment 2
      • 8.3. Market Analysis, Insights and Forecast – By Segment 2
        • 8.3.1. Sub-Segment 1
        • 8.3.2. Sub-Segment 2
        • 8.3.3. Sub-Segment 3
        • 8.3.4. Others
      • 8.4. Market Analysis, Insights and Forecast – By Segment 3
        • 8.4.1. Sub-Segment 1
        • 8.4.2. Sub-Segment 2
        • 8.4.3. Sub-Segment 3
        • 8.4.4. Others
      • 8.5. Market Analysis, Insights and Forecast – By Country
        • 8.5.1. UK
        • 8.5.2. Germany
        • 8.5.3. France
        • 8.5.4. Italy
        • 8.5.5. Spain
        • 8.5.6. Russia
        • 8.5.7. Rest of Europe

      9. Asia Pacific Video Glasses Market Analysis (USD Billion), Insights and Forecast, 2018-2029

      • 9.1. Key Findings / Summary
      • 9.2. Market Analysis, Insights and Forecast – By Segment 1
        • 9.2.1. Sub-Segment 1
        • 9.2.2. Sub-Segment 2
      • 9.3. Market Analysis, Insights and Forecast – By Segment 2
        • 9.3.1. Sub-Segment 1
        • 9.3.2. Sub-Segment 2
        • 9.3.3. Sub-Segment 3
        • 9.3.4. Others
      • 9.4. Market Analysis, Insights and Forecast – By Segment 3
        • 9.4.1. Sub-Segment 1
        • 9.4.2. Sub-Segment 2
        • 9.4.3. Sub-Segment 3
        • 9.4.4. Others
      • 9.5. Market Analysis, Insights and Forecast – By Country
        • 9.5.1. China
        • 9.5.2. India
        • 9.5.3. Japan
        • 9.5.4. Australia
        • 9.5.5. South East Asia
        • 9.5.6. Rest of Asia Pacific

      10. Middle East & Africa Video Glasses Market Analysis (USD Billion), Insights and Forecast, 2018-2029

      • 10.1. Key Findings / Summary
      • 10.2. Market Analysis, Insights and Forecast – By Segment 1
        • 10.2.1. Sub-Segment 1
        • 10.2.2. Sub-Segment 2
      • 10.3. Market Analysis, Insights and Forecast – By Segment 2
        • 10.3.1. Sub-Segment 1
        • 10.3.2. Sub-Segment 2
        • 10.3.3. Sub-Segment 3
        • 10.3.4. Others
      • 10.4. Market Analysis, Insights and Forecast – By Segment 3
        • 10.4.1. Sub-Segment 1
        • 10.4.2. Sub-Segment 2
        • 10.4.3. Sub-Segment 3
        • 10.4.4. Others
      • 10.5. Market Analysis, Insights and Forecast – By Country
        • 10.5.1. GCC
        • 10.5.2. South Africa
        • 10.5.3. Rest of Middle East & Africa

      11. Competitive Analysis

      • 11.1. Company Market Share Analysis, 2018
      • 11.2. Key Industry Developments
      • 11.3. Company Profile
        • 11.3.1. Company 1
          • 11.3.1.1. Business Overview
          • 11.3.1.2. Segment 1 & Service Offering
          • 11.3.1.3. Overall Revenue
          • 11.3.1.4. Geographic Presence
          • 11.3.1.5. Recent Development
        *Similar details will be provided for the following companies
        • 11.3.2. Company 2
        • 11.3.3. Company 3
        • 11.3.4. Company 4
        • 11.3.5. Company 5
        • 11.3.6. Company 6
        • 11.3.7. Company 7
        • 11.3.8. Company 8
        • 11.3.9. Company 9
        • 11.3.10. Company 10
        • 11.3.11. Company 11
        • 11.3.12. Company 12
      List of Figures

      Figure 1: Global Video Glasses Market Revenue Breakdown (USD Billion, %) by Region, 2022 & 2029
      Figure 2: Global Video Glasses Market Value Share (%), By Segment 1, 2022 & 2029
      Figure 3: Global Video Glasses Market Forecast (USD Billion), by Sub-Segment 1, 2018-2029
      Figure 4: Global Video Glasses Market Forecast (USD Billion), by Sub-Segment 2, 2018-2029
      Figure 5: Global Video Glasses Market Value Share (%), By Segment 2, 2022 & 2029
      Figure 6: Global Video Glasses Market Forecast (USD Billion), by Sub-Segment 1, 2018-2029
      Figure 7: Global Video Glasses Market Forecast (USD Billion), by Sub-Segment 2, 2018-2029
      Figure 8: Global Video Glasses Market Forecast (USD Billion), by Sub-Segment 3, 2018-2029
      Figure 9: Global Video Glasses Market Forecast (USD Billion), by Others, 2018-2029
      Figure 10: Global Video Glasses Market Value Share (%), By Segment 3, 2022 & 2029
      Figure 11: Global Video Glasses Market Forecast (USD Billion), by Sub-Segment 1, 2018-2029
      Figure 12: Global Video Glasses Market Forecast (USD Billion), by Sub-Segment 2, 2018-2029
      Figure 13: Global Video Glasses Market Forecast (USD Billion), by Sub-Segment 3, 2018-2029
      Figure 14: Global Video Glasses Market Forecast (USD Billion), by Others, 2018-2029
      Figure 15: Global Video Glasses Market Value (USD Billion), by Region, 2022 & 2029
      Figure 16: North America Video Glasses Market Value Share (%), By Segment 1, 2022 & 2029
      Figure 17: North America Video Glasses Market Forecast (USD Billion), by Sub-Segment 1, 2018-2029
      Figure 18: North America Video Glasses Market Forecast (USD Billion), by Sub-Segment 2, 2018-2029
      Figure 19: North America Video Glasses Market Value Share (%), By Segment 2, 2022 & 2029
      Figure 20: North America Video Glasses Market Forecast (USD Billion), by Sub-Segment 1, 2018-2029
      Figure 21: North America Video Glasses Market Forecast (USD Billion), by Sub-Segment 2, 2018-2029
      Figure 22: North America Video Glasses Market Forecast (USD Billion), by Sub-Segment 3, 2018-2029
      Figure 23: North America Video Glasses Market Forecast (USD Billion), by Others, 2018-2029
      Figure 24: North America Video Glasses Market Value Share (%), By Segment 3, 2022 & 2029
      Figure 25: North America Video Glasses Market Forecast (USD Billion), by Sub-Segment 1, 2018-2029
      Figure 26: North America Video Glasses Market Forecast (USD Billion), by Sub-Segment 2, 2018-2029
      Figure 27: North America Video Glasses Market Forecast (USD Billion), by Sub-Segment 3, 2018-2029
      Figure 28: North America Video Glasses Market Forecast (USD Billion), by Others, 2018-2029
      Figure 29: North America Video Glasses Market Forecast (USD Billion), by U.S., 2018-2029
      Figure 30: North America Video Glasses Market Forecast (USD Billion), by Canada, 2018-2029
      Figure 31: Latin America Video Glasses Market Value Share (%), By Segment 1, 2022 & 2029
      Figure 32: Latin America Video Glasses Market Forecast (USD Billion), by Sub-Segment 1, 2018-2029
      Figure 33: Latin America Video Glasses Market Forecast (USD Billion), by Sub-Segment 2, 2018-2029
      Figure 34: Latin America Video Glasses Market Value Share (%), By Segment 2, 2022 & 2029
      Figure 35: Latin America Video Glasses Market Forecast (USD Billion), by Sub-Segment 1, 2018-2029
      Figure 36: Latin America Video Glasses Market Forecast (USD Billion), by Sub-Segment 2, 2018-2029
      Figure 37: Latin America Video Glasses Market Forecast (USD Billion), by Sub-Segment 3, 2018-2029
      Figure 38: Latin America Video Glasses Market Forecast (USD Billion), by Others, 2018-2029
      Figure 39: Latin America Video Glasses Market Value Share (%), By Segment 3, 2022 & 2029
      Figure 40: Latin America Video Glasses Market Forecast (USD Billion), by Sub-Segment 1, 2018-2029
      Figure 41: Latin America Video Glasses Market Forecast (USD Billion), by Sub-Segment 2, 2018-2029
      Figure 42: Latin America Video Glasses Market Forecast (USD Billion), by Sub-Segment 3, 2018-2029
      Figure 43: Latin America Video Glasses Market Forecast (USD Billion), by Others, 2018-2029
      Figure 44: Latin America Video Glasses Market Forecast (USD Billion), by Brazil, 2018-2029
      Figure 45: Latin America Video Glasses Market Forecast (USD Billion), by Mexico, 2018-2029
      Figure 46: Latin America Video Glasses Market Forecast (USD Billion), by Rest of Latin America, 2018-2029
      Figure 47: Europe Video Glasses Market Value Share (%), By Segment 1, 2022 & 2029
      Figure 48: Europe Video Glasses Market Forecast (USD Billion), by Sub-Segment 1, 2018-2029
      Figure 49: Europe Video Glasses Market Forecast (USD Billion), by Sub-Segment 2, 2018-2029
      Figure 50: Europe Video Glasses Market Value Share (%), By Segment 2, 2022 & 2029
      Figure 51: Europe Video Glasses Market Forecast (USD Billion), by Sub-Segment 1, 2018-2029
      Figure 52: Europe Video Glasses Market Forecast (USD Billion), by Sub-Segment 2, 2018-2029
      Figure 53: Europe Video Glasses Market Forecast (USD Billion), by Sub-Segment 3, 2018-2029
      Figure 54: Europe Video Glasses Market Forecast (USD Billion), by Others, 2018-2029
      Figure 55: Europe Video Glasses Market Value Share (%), By Segment 3, 2022 & 2029
      Figure 56: Europe Video Glasses Market Forecast (USD Billion), by Sub-Segment 1, 2018-2029
      Figure 57: Europe Video Glasses Market Forecast (USD Billion), by Sub-Segment 2, 2018-2029
      Figure 58: Europe Video Glasses Market Forecast (USD Billion), by Sub-Segment 3, 2018-2029
      Figure 59: Europe Video Glasses Market Forecast (USD Billion), by Others, 2018-2029
      Figure 60: Europe Video Glasses Market Forecast (USD Billion), by U.K., 2018-2029
      Figure 61: Europe Video Glasses Market Forecast (USD Billion), by Germany, 2018-2029
      Figure 62: Europe Video Glasses Market Forecast (USD Billion), by France, 2018-2029
      Figure 63: Europe Video Glasses Market Forecast (USD Billion), by Italy, 2018-2029
      Figure 64: Europe Video Glasses Market Forecast (USD Billion), by Spain, 2018-2029
      Figure 65: Europe Video Glasses Market Forecast (USD Billion), by Russia, 2018-2029
      Figure 66: Europe Video Glasses Market Forecast (USD Billion), by Rest of Europe, 2018-2029
      Figure 67: Asia Pacific Video Glasses Market Value Share (%), By Segment 1, 2022 & 2029
      Figure 68: Asia Pacific Video Glasses Market Forecast (USD Billion), by Sub-Segment 1, 2018-2029
      Figure 69: Asia Pacific Video Glasses Market Forecast (USD Billion), by Sub-Segment 2, 2018-2029
      Figure 70: Asia Pacific Video Glasses Market Value Share (%), By Segment 2, 2022 & 2029
      Figure 71: Asia Pacific Video Glasses Market Forecast (USD Billion), by Sub-Segment 1, 2018-2029
      Figure 72: Asia Pacific Video Glasses Market Forecast (USD Billion), by Sub-Segment 2, 2018-2029
      Figure 73: Asia Pacific Video Glasses Market Forecast (USD Billion), by Sub-Segment 3, 2018-2029
      Figure 74: Asia Pacific Video Glasses Market Forecast (USD Billion), by Others, 2018-2029
      Figure 75: Asia Pacific Video Glasses Market Value Share (%), By Segment 3, 2022 & 2029
      Figure 76: Asia Pacific Video Glasses Market Forecast (USD Billion), by Sub-Segment 1, 2018-2029
      Figure 77: Asia Pacific Video Glasses Market Forecast (USD Billion), by Sub-Segment 2, 2018-2029
      Figure 78: Asia Pacific Video Glasses Market Forecast (USD Billion), by Sub-Segment 3, 2018-2029
      Figure 79: Asia Pacific Video Glasses Market Forecast (USD Billion), by Others, 2018-2029
      Figure 80: Asia Pacific Video Glasses Market Forecast (USD Billion), by China, 2018-2029
      Figure 81: Asia Pacific Video Glasses Market Forecast (USD Billion), by India, 2018-2029
      Figure 82: Asia Pacific Video Glasses Market Forecast (USD Billion), by Japan, 2018-2029
      Figure 83: Asia Pacific Video Glasses Market Forecast (USD Billion), by Australia, 2018-2029
      Figure 84: Asia Pacific Video Glasses Market Forecast (USD Billion), by Southeast Asia, 2018-2029
      Figure 85: Asia Pacific Video Glasses Market Forecast (USD Billion), by Rest of Asia Pacific, 2018-2029
      Figure 86: Middle East & Africa Video Glasses Market Value Share (%), By Segment 1, 2022 & 2029
      Figure 87: Middle East & Africa Video Glasses Market Forecast (USD Billion), by Sub-Segment 1, 2018-2029
      Figure 88: Middle East & Africa Video Glasses Market Forecast (USD Billion), by Sub-Segment 2, 2018-2029
      Figure 89: Middle East & Africa Video Glasses Market Value Share (%), By Segment 2, 2022 & 2029
      Figure 90: Middle East & Africa Video Glasses Market Forecast (USD Billion), by Sub-Segment 1, 2018-2029
      Figure 91: Middle East & Africa Video Glasses Market Forecast (USD Billion), by Sub-Segment 2, 2018-2029
      Figure 92: Middle East & Africa Video Glasses Market Forecast (USD Billion), by Sub-Segment 3, 2018-2029
      Figure 93: Middle East & Africa Video Glasses Market Forecast (USD Billion), by Others, 2018-2029
      Figure 94: Middle East & Africa Video Glasses Market Value Share (%), By Segment 3, 2022 & 2029
      Figure 95: Middle East & Africa Video Glasses Market Forecast (USD Billion), by Sub-Segment 1, 2018-2029
      Figure 96: Middle East & Africa Video Glasses Market Forecast (USD Billion), by Sub-Segment 2, 2018-2029
      Figure 97: Middle East & Africa Video Glasses Market Forecast (USD Billion), by Sub-Segment 3, 2018-2029
      Figure 98: Middle East & Africa Video Glasses Market Forecast (USD Billion), by Others, 2018-2029
      Figure 99: Middle East & Africa Video Glasses Market Forecast (USD Billion), by GCC, 2018-2029
      Figure 100: Middle East & Africa Video Glasses Market Forecast (USD Billion), by South Africa, 2018-2029
      Figure 101: Middle East & Africa Video Glasses Market Forecast (USD Billion), by Rest of Middle East & Africa, 2018-2029 
      List of Tables
      Table 1: Global Video Glasses Market Revenue (USD Billion) Forecast, by Segment 1, 2018-2029
      Table 2: Global Video Glasses Market Revenue (USD Billion) Forecast, by Segment 2, 2018-2029
      Table 3: Global Video Glasses Market Revenue (USD Billion) Forecast, by Segment 3, 2018-2029
      Table 4: Global Video Glasses Market Revenue (USD Billion) Forecast, by Region, 2018-2029
      Table 5: North America Video Glasses Market Revenue (USD Billion) Forecast, by Segment 1, 2018-2029
      Table 6: North America Video Glasses Market Revenue (USD Billion) Forecast, by Segment 2, 2018-2029
      Table 7: North America Video Glasses Market Revenue (USD Billion) Forecast, by Segment 3, 2018-2029
      Table 8: North America Video Glasses Market Revenue (USD Billion) Forecast, by Country, 2018-2029
      Table 9: Europe Video Glasses Market Revenue (USD Billion) Forecast, by Segment 1, 2018-2029
      Table 10: Europe Video Glasses Market Revenue (USD Billion) Forecast, by Segment 2, 2018-2029
      Table 11: Europe Video Glasses Market Revenue (USD Billion) Forecast, by Segment 3, 2018-2029
      Table 12: Europe Video Glasses Market Revenue (USD Billion) Forecast, by Country, 2018-2029
      Table 13: Latin America Video Glasses Market Revenue (USD Billion) Forecast, by Segment 1, 2018-2029
      Table 14: Latin America Video Glasses Market Revenue (USD Billion) Forecast, by Segment 2, 2018-2029
      Table 15: Latin America Video Glasses Market Revenue (USD Billion) Forecast, by Segment 3, 2018-2029
      Table 16: Latin America Video Glasses Market Revenue (USD Billion) Forecast, by Country, 2018-2029
      Table 17: Asia Pacific Video Glasses Market Revenue (USD Billion) Forecast, by Segment 1, 2018-2029
      Table 18: Asia Pacific Video Glasses Market Revenue (USD Billion) Forecast, by Segment 2, 2018-2029
      Table 19: Asia Pacific Video Glasses Market Revenue (USD Billion) Forecast, by Segment 3, 2018-2029
      Table 20: Asia Pacific Video Glasses Market Revenue (USD Billion) Forecast, by Country, 2018-2029
      Table 21: Middle East & Africa Video Glasses Market Revenue (USD Billion) Forecast, by Segment 1, 2018-2029
      Table 22: Middle East & Africa Video Glasses Market Revenue (USD Billion) Forecast, by Segment 2, 2018-2029
      Table 23: Middle East & Africa Video Glasses Market Revenue (USD Billion) Forecast, by Segment 3, 2018-2029
      Table 24: Middle East & Africa Video Glasses Market Revenue (USD Billion) Forecast, by Country, 2018-2029
      Research Process

      Data Library Research are conducted by industry experts who offer insight on industry structure, market segmentations technology assessment and competitive landscape (CL), and penetration, as well as on emerging trends. Their analysis is based on primary interviews (~ 80%) and secondary research (~ 20%) as well as years of professional expertise in their respective industries. Adding to this, by analysing historical trends and current market positions, our analysts predict where the market will be headed for the next five years. Furthermore, the varying trends of segment & categories geographically presented are also studied and the estimated based on the primary & secondary research.

      In this particular report from the supply side Data Library Research has conducted primary surveys (interviews) with the key level executives (VP, CEO’s, Marketing Director, Business Development Manager and SOFT) of the companies that active & prominent as well as the midsized organization

      FIGURE 1: DLR RESEARH PROCESS

      research-methodology1

      Primary Research

      Extensive primary research was conducted to gain a deeper insight of the market and industry performance. The analysis is based on both primary and secondary research as well as years of professional expertise in the respective industries.

      In addition to analysing current and historical trends, our analysts predict where the market is headed over the next five years.

      It varies by segment for these categories geographically presented in the list of market tables. Speaking about this particular report we have conducted primary surveys (interviews) with the key level executives (VP, CEO’s, Marketing Director, Business Development Manager and many more) of the major players active in the market.

      Secondary Research

      Secondary research was mainly used to collect and identify information useful for the extensive, technical, market-oriented, and Friend’s study of the Global Extra Neutral Alcohol. It was also used to obtain key information about major players, market classification and segmentation according to the industry trends, geographical markets, and developments related to the market and technology perspectives. For this study, analysts have gathered information from various credible sources, such as annual reports, sec filings, journals, white papers, SOFT presentations, and company web sites.

      Market Size Estimation

      Both, top-down and bottom-up approaches were used to estimate and validate the size of the Global market and to estimate the size of various other dependent submarkets in the overall Extra Neutral Alcohol. The key players in the market were identified through secondary research and their market contributions in the respective geographies were determined through primary and secondary research.

      Forecast Model

      research-methodology2