Get Complete Analysis Of The Report - Download Updated Free Sample PDF
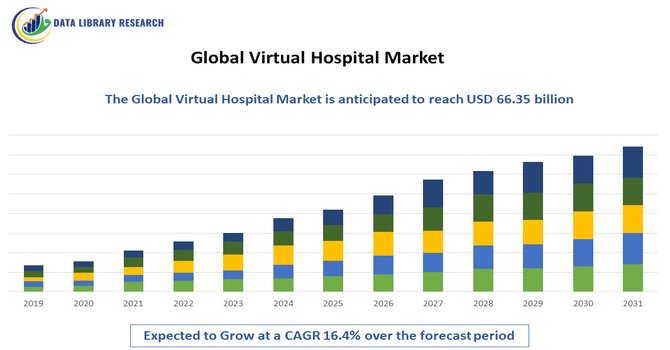
The Global Virtual Hospital Market is experiencing rapid expansion driven by the widespread digital transformation of healthcare systems and the growing preference for remote care delivery. Accelerated adoption of telemedicine technologies—including video consultations, cloud based platforms, and remote patient monitoring—has made virtual hospitals an essential part of modern healthcare, especially as patients increasingly seek convenient, continuous care from home. Technological advancements such as artificial intelligence (AI), Internet of Things (IoT), and advanced connectivity (e.g., 5G) are further enhancing virtual care capabilities, enabling real time diagnostics and personalized treatment, reducing dependency on physical facilities, and improving clinical outcomes.
The Global Virtual Hospital Market is evolving rapidly with key trends reshaping how healthcare is delivered and experienced. A major trend is the integration of advanced digital technologies such as AI, cloud based systems, and IoT enabled remote patient monitoring, which are enabling more comprehensive virtual care including diagnostics, chronic disease management, and predictive analytics that improve outcomes and efficiency. Another significant trend is the expansion of virtual care beyond basic teleconsultations to full spectrum virtual hospital services, including virtual chronic care management, home based acute care, and hybrid care models that bridge physical and digital care pathways. This shift is driven by patient preference for convenient, 24/7 access to healthcare, growth in wearable and mobile health adoption, and supportive regulatory environments that incentivize telehealth reimbursement.
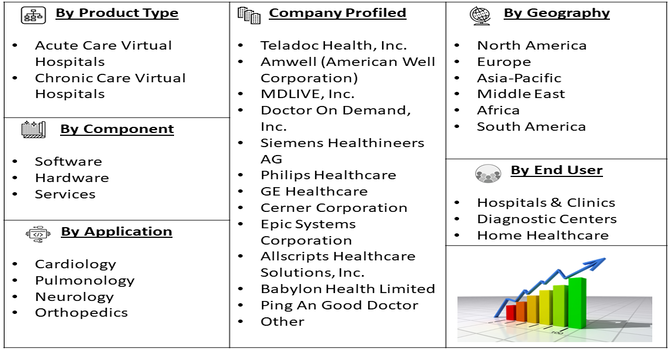
Segmentation: Global Virtual Hospital Market is segmented By Component (Software, Hardware, Services), By Type (Acute Care Virtual Hospitals, Chronic Care Virtual Hospitals), By Application (Cardiology, Pulmonology, Neurology, Orthopedics), By End User (Hospitals & Clinics, Diagnostic Centers, Home Healthcare), and Geography (North America, Europe, Asia-Pacific, Middle East and Africa, and South America). The report provides the value (in USD million) for the above segments.
For Detailed Market Segmentation - Get a Free Sample PDF
Market Drivers:
The primary drivers of the virtual hospital market is the rapid adoption of telemedicine and remote patient monitoring technologies. Advances in digital health platforms, wearable devices, and IoT-enabled monitoring allow healthcare providers to deliver continuous care to patients outside traditional hospital settings. This is especially critical for chronic disease management, post-operative care, and follow-up consultations, reducing the need for in-person visits. Patients benefit from convenience, reduced travel time, and real-time monitoring, while hospitals can optimize resources, enhance workflow efficiency, and improve patient outcomes. The COVID-19 pandemic further accelerated the acceptance and integration of telehealth solutions, establishing virtual hospitals as a mainstream care delivery model.
The increasing burden of chronic diseases such as cardiovascular disorders, diabetes, and respiratory illnesses, combined with a growing aging population, is fueling demand for virtual hospital services. Chronic disease patients require regular monitoring, frequent consultations, and timely interventions, which virtual hospitals can provide efficiently and cost-effectively. The aging population often faces mobility challenges and prefers care from home, which makes virtual hospital solutions particularly attractive. By enabling continuous monitoring, early detection of complications, and remote management, virtual hospitals reduce hospital readmissions, lower healthcare costs, and improve patient quality of life, thus acting as a strong growth driver for the market.
Market Restraints:
A major restraint for the virtual hospital market is the risk associated with data privacy and cybersecurity. Virtual hospitals rely heavily on digital platforms to manage sensitive patient information, including medical histories, lab results, and real-time monitoring data. The increasing prevalence of cyberattacks and data breaches in healthcare has heightened concerns among providers and patients regarding the security of personal health information. Compliance with strict data protection regulations such as HIPAA in the U.S., GDPR in Europe, and similar laws globally requires significant investment in secure infrastructure. Failure to maintain high cybersecurity standards can result in legal liabilities, loss of patient trust, and hinder the widespread adoption of virtual hospital solutions.
The Global Virtual Hospital Market has significantly influenced socioeconomic dynamics by improving access to healthcare, particularly in remote and underserved regions. Virtual hospitals reduce travel costs, minimize hospital congestion, and enable continuous patient monitoring, enhancing treatment efficiency and outcomes. They also lower operational expenses for healthcare providers while creating employment opportunities in telehealth, IT infrastructure, and remote patient care services. By facilitating timely medical interventions and chronic disease management, virtual hospitals improve population health and workforce productivity. Additionally, they help reduce disparities in healthcare access, contributing to more equitable health outcomes and overall societal well-being.
Segmental Analysis:
The software segment represents a critical portion of the virtual hospital market, as it forms the backbone of telemedicine platforms, electronic health record (EHR) systems, remote patient monitoring applications, and virtual care management tools. These software solutions enable seamless scheduling, real-time consultations, patient data analytics, and integration with wearable devices, allowing healthcare providers to deliver efficient, continuous care. The growing reliance on cloud-based and AI-enabled platforms for predictive diagnostics and personalized care is driving strong demand in this segment globally.
The chronic care virtual hospital segment is expanding rapidly due to the rising prevalence of long-term diseases such as diabetes, cardiovascular disorders, and respiratory illnesses. These virtual hospitals offer continuous monitoring, remote consultations, and personalized treatment plans for patients managing chronic conditions, reducing hospital readmissions, and improving quality of life. The convenience of home-based care and ongoing digital engagement with healthcare providers is contributing significantly to growth in this segment.
Cardiology is a leading application area within the virtual hospital market, driven by the increasing incidence of cardiovascular diseases worldwide. Virtual hospitals enable real-time monitoring of heart rate, blood pressure, and other vital parameters using wearable devices and remote sensors. Cardiologists can provide timely interventions and manage chronic cardiac conditions efficiently, reducing the need for frequent hospital visits while enhancing patient outcomes.
The home healthcare segment is witnessing robust growth as virtual hospital platforms allow patients to receive medical care and continuous monitoring from the comfort of their homes. This is especially important for elderly patients, those with mobility issues, and individuals in rural or underserved regions. Home-based virtual care reduces the burden on hospitals and ensures personalized attention, supporting broader adoption of virtual hospital services.
North America dominates the global virtual hospital market, supported by advanced healthcare infrastructure, high digital literacy, widespread adoption of telemedicine, and favorable regulatory frameworks for remote healthcare delivery. The presence of leading healthcare technology providers and the growing prevalence of chronic and acute diseases further drive demand for virtual hospital solutions in the region.
Furthermore, the increasing integration of AI, IoT, and cloud-based platforms in North American virtual hospitals has enhanced patient monitoring, predictive diagnostics, and personalized care. These technological advancements improve clinical efficiency, reduce hospital readmissions, and optimize resource allocation. Additionally, growing consumer acceptance of telehealth services and rising investments in digital health innovations continue to strengthen the region’s position as the largest and most technologically advanced virtual hospital market globally.
| Report Matrics | Details |
| Market Size Value | USD 66.35 billion |
| Growth Rate | CAGR of 16.4 % |
| Forecast | 2026-2033 |
| Historical data | 2021-2024 |
| Base Year | 2025 |
| Report Coverage | Forecasted revenue, company rating, competitive environment, growth drivers, and trends |
| Segment Coverage | Type, Application, End-User, Geography |
| Regional Scope | North America, Europe, Asia Pacific, Middle East |
| Customized scope | Free customization of reports (With 3 months Analysis Support ) |
| To Learn More About This Report | Request a Free Sample Copy |
The Global Virtual Hospital Market is highly competitive and rapidly evolving, driven by the growing adoption of telehealth platforms, remote monitoring solutions, and integrated digital care systems across healthcare providers worldwide. Key players differentiate themselves through technological innovation, strategic partnerships, expanded service portfolios, and scalable solutions that cater to diverse patient needs, from acute care to chronic disease management. Companies are investing heavily in AI, cloud based infrastructure, cybersecurity, and IoT connectivity to enhance virtual care delivery and patient outcomes. Continuous mergers, acquisitions, and cross-industry collaborations are further intensifying competition as providers expand their geographic reach and service offerings in this dynamic digital healthcare landscape.
Key Players:
Recent Development
Q1. What are the main growth-driving factors for this market?
The primary driver is the urgent need to expand healthcare access to rural and underserved areas. Rapid advancements in 5G, artificial intelligence, and the Internet of Medical Things (IoMT) allow for real-time patient monitoring. Additionally, an aging global population and the rising burden of chronic diseases are forcing hospitals to adopt remote treatment models.
Q2. What are the main restraining factors for this market?
Growth is primarily hindered by serious concerns regarding data privacy and cybersecurity, as virtual platforms handle sensitive patient information. High initial setup costs for digital infrastructure and a lack of reliable high-speed internet in developing nations also limit adoption. Furthermore, some elderly patients find it difficult to use complex digital health tools.
Q3. Which segment is expected to witness high growth?
The home healthcare segment segment is expected to see the highest growth. As healthcare shifts from reactive to proactive care, the demand for wearable devices that track vitals like heart rate and oxygen levels is surging. This allows doctors to manage chronic conditions from a distance, significantly reducing hospital readmission rates.
Q4. Who are the top major players for this market?
The market is led by innovative technology providers and established healthcare giants. Key players include Teladoc Health, Amwell, MDLIVE, and Philips Healthcare. These companies dominate by offering integrated platforms that connect patients with specialists via video, while also providing the software needed for hospitals to manage virtual "wards" and ICUs.
Q5. Which country is the largest player?
The United States is the largest player in the virtual hospital market. It leads due to its advanced digital infrastructure, high healthcare spending, and supportive government regulations. The U.S. also hosts the majority of the world’s leading telehealth companies and has a high rate of smartphone and wearable technology adoption among its citizens.
Data Library Research are conducted by industry experts who offer insight on industry structure, market segmentations technology assessment and competitive landscape (CL), and penetration, as well as on emerging trends. Their analysis is based on primary interviews (~ 80%) and secondary research (~ 20%) as well as years of professional expertise in their respective industries. Adding to this, by analysing historical trends and current market positions, our analysts predict where the market will be headed for the next five years. Furthermore, the varying trends of segment & categories geographically presented are also studied and the estimated based on the primary & secondary research.
In this particular report from the supply side Data Library Research has conducted primary surveys (interviews) with the key level executives (VP, CEO’s, Marketing Director, Business Development Manager and SOFT) of the companies that active & prominent as well as the midsized organization
FIGURE 1: DLR RESEARH PROCESS
Extensive primary research was conducted to gain a deeper insight of the market and industry performance. The analysis is based on both primary and secondary research as well as years of professional expertise in the respective industries.
In addition to analysing current and historical trends, our analysts predict where the market is headed over the next five years.
It varies by segment for these categories geographically presented in the list of market tables. Speaking about this particular report we have conducted primary surveys (interviews) with the key level executives (VP, CEO’s, Marketing Director, Business Development Manager and many more) of the major players active in the market.
Secondary ResearchSecondary research was mainly used to collect and identify information useful for the extensive, technical, market-oriented, and Friend’s study of the Global Extra Neutral Alcohol. It was also used to obtain key information about major players, market classification and segmentation according to the industry trends, geographical markets, and developments related to the market and technology perspectives. For this study, analysts have gathered information from various credible sources, such as annual reports, sec filings, journals, white papers, SOFT presentations, and company web sites.
Market Size EstimationBoth, top-down and bottom-up approaches were used to estimate and validate the size of the Global market and to estimate the size of various other dependent submarkets in the overall Extra Neutral Alcohol. The key players in the market were identified through secondary research and their market contributions in the respective geographies were determined through primary and secondary research.
Forecast Model