Virtual Humans In Healthcare Market Overview and Analysis

The Global Virtual Humans in Healthcare Market size was evaluated at USD 5.02 billion in 2025 and is predicted to hit around USD 12.83 billion by 2032, growing with a CAGR of 11.2% from 2025-2032.

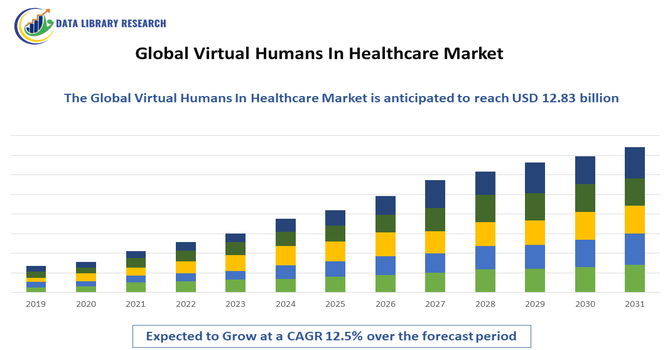
The Global Virtual Humans in Healthcare Market refers to the worldwide industry focused on developing and deploying AI-driven digital avatars and lifelike virtual beings for healthcare applications. These virtual humans simulate human interaction, communication, and behavior to support patient engagement, telemedicine, medical training, mental health support, and administrative assistance. Fueled by advances in AI, NLP, and computer graphics, this market expands healthcare delivery, training efficiency, and patient experience globally.

Virtual Humans In Healthcare Market Latest Trends

The market is rapidly evolving with increased adoption of AI-powered virtual human applications for patient consultations, virtual nurses, and therapeutic support. Enhanced natural language processing and emotional AI enable more realistic interactions, bridging gaps in remote and underserved care. Growth is driven by integration with telehealth systems and immersive technologies, expanding beyond traditional chatbots into animated avatars that support mental health and patient education. Cloud-based deployment and multilingual capabilities further increase accessibility and scalability. As healthcare organizations prioritize digital transformation, virtual humans are increasingly incorporated into clinical workflows, boosting engagement and operational efficiency.

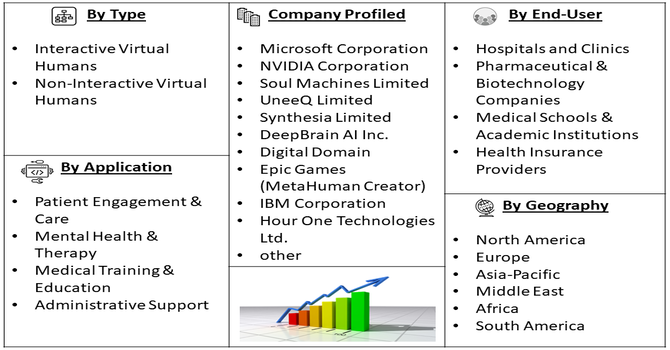
Segmentation: The Virtual Humans in Healthcare market is segmented by Type (Interactive Virtual Humans and Non-Interactive Virtual Humans), Application (Patient Engagement & Care, Mental Health & Therapy, Medical Training & Education and Administrative Support), End-User (Hospitals and Clinics, Pharmaceutical & Biotechnology Companies, Medical Schools & Academic Institutions and Health Insurance Providers), and Geography (North America, Europe, Asia-Pacific, Middle East and Africa, and South America). The report provides the value (in USD million) for the above segments.

Market Drivers:

  • Increasing Adoption of AI-Powered Virtual Assistants

The rising adoption of AI-powered virtual humans is a major driver of the global healthcare market. Hospitals, clinics, and telemedicine platforms increasingly use virtual assistants for patient triage, appointment scheduling, and real-time health guidance, reducing reliance on human staff for routine tasks. For instance, in June 2025, the launch of YKChat in Moldova provided adolescents with anonymous, AI-driven support for mental, reproductive, and emotional health. This virtual assistant demonstrated the effectiveness of remote, empathetic care, highlighting growing demand for telemedicine solutions and accelerating adoption of virtual humans in healthcare for youth-focused, accessible, and confidential health services.

Advances in natural language processing and emotion recognition allow these avatars to simulate empathetic, human-like interactions, enhancing patient engagement and satisfaction. Integration with electronic health records and telehealth platforms further improves efficiency and accuracy. As healthcare systems aim to optimize costs and expand access, AI-driven virtual humans are rapidly gaining traction worldwide.

  • Growth in Telemedicine and Remote Healthcare

The expansion of telemedicine and remote healthcare is driving demand for virtual humans in healthcare. Increasing need for accessible, 24/7 medical consultation, especially in underserved or rural areas, encourages adoption of lifelike AI avatars capable of patient interaction and monitoring.

Virtual humans facilitate remote diagnostics, mental health counseling, and chronic disease management, improving continuity of care. For instance, in May 2025, DocGo’s acquisition of virtual care platform SteadyMD expanded its mobile health and telemedicine capabilities, integrating virtual human-driven consultations into its services. This move strengthened remote healthcare delivery, enhanced patient accessibility, and underscored the rising role of AI-powered virtual humans in supporting scalable, technology-enabled telehealth solutions globally.

The COVID-19 pandemic accelerated digital health adoption, highlighting the importance of virtual care solutions. As telehealth becomes a standard service, healthcare providers are investing in virtual humans to enhance patient engagement, streamline operations, and deliver personalized care efficiently.

Market Restraints:

  • High Implementation Costs and Data Privacy Concerns

High implementation costs and stringent data privacy concerns are key restraints for the global virtual humans in healthcare market. Developing AI-driven avatars requires advanced software, high-performance computing, and continuous updates, leading to significant capital investment. Smaller healthcare providers may find these costs prohibitive. Additionally, patient data security and compliance with regulations like HIPAA and GDPR are critical, as virtual humans process sensitive health information. Any breaches or misuse of personal data could erode trust and hinder adoption. These factors slow large-scale deployment, especially in regions with limited digital infrastructure or strict regulatory oversight, challenging market growth despite technological advancements.

Socioeconomic Impact on Virtual Humans In Healthcare Market

Virtual humans in healthcare improve accessibility and reduce costs by enabling 24/7 patient support, preliminary assessments, and virtual counseling without physical infrastructure. They help alleviate workforce shortages by assisting with routine tasks, allowing clinicians to focus on complex care. In underserved regions, virtual healthcare avatars provide critical guidance and education, narrowing disparities in access. Additionally, they enhance training through risk-free simulations, improving clinical competency and reducing errors. However, ethical concerns, data privacy, and acceptance challenges influence public trust. Overall, deployment of virtual humans supports broader healthcare reach and efficiency, contributing to more equitable and cost-effective systems with enhanced patient outcomes.

Segmental Analysis:

  • Interactive Virtual Humans segment is expected to witness highest growth over the forecast period

The interactive virtual humans segment is projected to witness the highest growth over the forecast period due to increasing demand for AI-driven avatars capable of real-time, human-like interactions. Healthcare providers are adopting these solutions for patient engagement, virtual nursing, and teleconsultations, as they enhance communication, empathy, and adherence to treatment plans. Advanced natural language processing, emotion recognition, and 3D rendering improve realism, encouraging widespread adoption. Integration with electronic health records, telehealth platforms, and wearable devices allows personalized and continuous care. As hospitals and digital health platforms prioritize patient experience, interactive virtual humans are becoming a central component of healthcare delivery.

  • Mental Health & Therapy segment is expected to witness highest growth over the forecast period

The mental health and therapy segment is expected to experience significant growth due to the rising prevalence of mental health disorders and limited access to in-person therapy. Virtual humans provide scalable, 24/7 support for therapy, counseling, and stress management, reducing barriers such as stigma, cost, and geographic constraints. AI-powered avatars can simulate empathetic interactions, monitor emotional cues, and deliver personalized mental health interventions. Integration with telemedicine platforms and mobile applications further expands reach. As demand for digital mental health solutions surges, healthcare providers, insurers, and tech companies are increasingly investing in virtual humans to improve patient outcomes and reduce system burdens.

  • Medical Schools & Academic Institutions segment is expected to witness highest growth over the forecast period

The medical schools and academic institutions segment is anticipated to witness substantial growth as virtual humans are increasingly adopted for training and simulation. AI-driven avatars provide risk-free, interactive environments for clinical education, patient communication exercises, and procedural simulations. Students can practice diagnostics, bedside manners, and decision-making without exposing real patients to risk. Virtual humans also support remote learning, enhancing accessibility and flexibility in medical education. Advances in 3D rendering, natural language processing, and adaptive AI allow realistic and dynamic training scenarios. Increasing demand for innovative, cost-effective educational tools is driving adoption, making virtual humans integral to modern medical curricula.

  • North America region is expected to witness highest growth over the forecast period

North America is expected to witness the highest growth in the virtual humans in healthcare market due to advanced healthcare infrastructure, early adoption of AI technologies, and significant R&D investments. The region benefits from strong digital health initiatives, high telemedicine penetration, and the presence of leading technology and healthcare companies developing virtual human solutions. For instance, in November 2024, Teladoc Health’s AI-enhanced Virtual Sitter improved patient monitoring efficiency, allowing remote staff to oversee more patients and reduce fall-related incidents. This innovation demonstrated the effectiveness of virtual human solutions in inpatient care, alleviated workforce pressures, and strengthened the adoption of AI-driven virtual healthcare technologies across North American hospitals.

Similarly, in January 2025, The DEA’s permanent telemedicine rules ensured continued access to remote care while maintaining patient safety, supporting wider adoption of virtual healthcare solutions. By clarifying prescribing guidelines, these regulations facilitated integration of AI-driven virtual humans in patient consultations, enhancing telehealth efficiency and strengthening the North American market for virtual human healthcare technologies.

Growing demand for patient engagement, chronic disease management, and mental health support further fuels adoption. Supportive regulatory frameworks, high digital literacy, and substantial funding for healthcare innovation position North America as a leader in deploying interactive virtual humans across hospitals, academic institutions, and telehealth platforms.

Virtual Humans In Healthcare Market Competitive Landscape

The competitive landscape features a mix of AI platform developers, healthcare technology firms, and specialized startups creating virtual human solutions. Leaders invest heavily in AI, NLP, and 3D animation to enhance realism and responsiveness. Strategic partnerships with healthcare providers and telemedicine platforms expand deployment. Key players differentiate through proprietary conversational engines, emotion recognition, and integration capabilities with electronic health records and CRM systems. Innovation in cloud-native architectures and multilingual support broadens market reach. Emergent competitors focus on niche applications such as virtual therapists and clinician training avatars. As demand grows, consolidation and collaborations are expected to shape offerings, with performance, scalability, and regulatory compliance as critical competitive factors.

The major players for above market:

  • Microsoft Corporation
  • NVIDIA Corporation
  • Soul Machines Limited
  • UneeQ Limited
  • Synthesia Limited
  • DeepBrain AI Inc.
  • Digital Domain
  • Epic Games (MetaHuman Creator)
  • IBM Corporation
  • Hour One Technologies Ltd.
  • Verofax
  • Ada Health GmbH
  • Sensely Inc.
  • HealthTap Inc.
  • Orbita, Inc.
  • eGain Corporation
  • Nuance Communications, Inc.
  • Pager, Inc.
  • Teladoc Health, Inc.
  • K Health

Recent Development

  • In September 2025, University Hospitals’ launch of the Connected Care Team at UH Lake West, using Vitalchat’s AI-driven platform, demonstrated the effectiveness of whole-hospital virtual nursing. This initiative improved patient engagement, caregiver support, and operational efficiency, highlighting the practical benefits of virtual humans and accelerating their adoption across healthcare systems globally.


  • In March 2025, Digital Domain and TOPPAN Holdings’ collaboration leveraged high-resolution biometric data to develop virtual humans integrated into Digital Domain’s Momentum Cloud. This initiative advanced realistic and precise AI-driven avatars, demonstrating enhanced capabilities for healthcare applications such as patient interaction, training, and remote care, and strengthened adoption of virtual human technologies globally.


Frequently Asked Questions (FAQ) :

Q1. What are the main growth-driving factors for this market?

The primary driver is the increasing demand for personalized patient engagement and mental health support. Virtual humans provide a non-judgmental environment for therapy and chronic disease management. Additionally, the global shortage of healthcare professionals is pushing providers to use AI-driven avatars to handle routine patient inquiries, triage, and health education.

Q2. What are the main restraining factors for this market?

Market growth is limited by concerns over data privacy and the ethical implications of using AI for sensitive medical advice. Technical limitations, such as the "uncanny valley" effect where avatars look unsettlingly almost-human, can hinder patient trust. High development costs and the complexity of integrating these systems with existing electronic health records also slow adoption.

Q3. Which segment is expected to witness high growth?

The Mental Health and Wellness segment is expected to see the highest growth. Virtual humans are becoming highly effective as digital therapists or "coaches" for conditions like PTSD, anxiety, and depression. Their 24/7 availability and the anonymity they provide make them an attractive first step for patients seeking psychological support.

Q4. Who are the top major players for this market?

Key players include technology innovators specializing in conversational AI and digital humans. Leading names are Soul Machines, DeepBrain AI, UneeQ, and NVIDIA. These companies provide the "brains" and the visual rendering engines that allow virtual humans to interact naturally, show empathy, and respond to patient emotions in real-time.

Q5. Which country is the largest player?

The United States is the largest player in this market. Its dominance is driven by a sophisticated healthcare infrastructure, heavy investment in artificial intelligence, and a high concentration of tech startups. Furthermore, the U.S. has a high adoption rate for telehealth services, providing a perfect platform for virtual human integration.

Virtual Humans In Healthcare MARKET STUDY GLOBAL MARKET ANALYSIS, INSIGHTS AND FORECAST, 2022-2029

    1. Introduction

    • 1.1. Research Scope
    • 1.2. Market Segmentation
    • 1.3. Research Methodology
    • 1.4. Definitions and Assumptions

    2. Executive Summary

      3. Market Dynamics

      • 3.1. Market Drivers
      • 3.2. Market Restraints
      • 3.3. Market Opportunities

      4. Key Insights

      • 4.1. Key Emerging Trends – For Major Countries
      • 4.2. Latest Technological Advancement
      • 4.3. Regulatory Landscape
      • 4.4. Industry SWOT Analysis
      • 4.5. Porters Five Forces Analysis

      5. Global Virtual Humans In Healthcare Market Analysis (USD Billion), Insights and Forecast, 2018-2029

      • 5.1. Key Findings / Summary
      • 5.2. Market Analysis, Insights and Forecast – By Segment 1
        • 5.2.1. Sub-Segment 1
        • 5.2.2. Sub-Segment 2
      • 5.3. Market Analysis, Insights and Forecast – By Segment 2
        • 5.3.1. Sub-Segment 1
        • 5.3.2. Sub-Segment 2
        • 5.3.3. Sub-Segment 3
        • 5.3.4. Others
      • 5.4. Market Analysis, Insights and Forecast – By Segment 3
        • 5.4.1. Sub-Segment 1
        • 5.4.2. Sub-Segment 2
        • 5.4.3. Sub-Segment 3
        • 5.4.4. Others
      • 5.5. Market Analysis, Insights and Forecast – By Region
        • 5.5.1. North America
        • 5.5.2. Latin America
        • 5.5.3. Europe
        • 5.5.4. Asia Pacific
        • 5.5.5. Middle East and Africa

      6. North America Virtual Humans In Healthcare Market Analysis (USD Billion), Insights and Forecast, 2018-2029

      • 6.1. Key Findings / Summary
      • 6.2. Market Analysis, Insights and Forecast – By Segment 1
        • 6.2.1. Sub-Segment 1
        • 6.2.2. Sub-Segment 2
      • 6.3. Market Analysis, Insights and Forecast – By Segment 2
        • 6.3.1. Sub-Segment 1
        • 6.3.2. Sub-Segment 2
        • 6.3.3. Sub-Segment 3
        • 6.3.4. Others
      • 6.4. Market Analysis, Insights and Forecast – By Segment 3
        • 6.4.1. Sub-Segment 1
        • 6.4.2. Sub-Segment 2
        • 6.4.3. Sub-Segment 3
        • 6.4.4. Others
      • 6.5. Market Analysis, Insights and Forecast – By Country
        • 6.5.1. U.S.
        • 6.5.2. Canada

      7. Latin America Virtual Humans In Healthcare Market Analysis (USD Billion), Insights and Forecast, 2018-2029

      • 7.1. Key Findings / Summary
      • 7.2. Market Analysis, Insights and Forecast – By Segment 1
        • 7.2.1. Sub-Segment 1
        • 7.2.2. Sub-Segment 2
      • 7.3. Market Analysis, Insights and Forecast – By Segment 2
        • 7.3.1. Sub-Segment 1
        • 7.3.2. Sub-Segment 2
        • 7.3.3. Sub-Segment 3
        • 7.3.4. Others
      • 7.4. Market Analysis, Insights and Forecast – By Segment 3
        • 7.4.1. Sub-Segment 1
        • 7.4.2. Sub-Segment 2
        • 7.4.3. Sub-Segment 3
        • 7.4.4. Others
      • 7.5. Insights and Forecast – By Country
        • 7.5.1. Brazil
        • 7.5.2. Mexico
        • 7.5.3. Rest of Latin America

      8. Europe Virtual Humans In Healthcare Market Analysis (USD Billion), Insights and Forecast, 2018-2029

      • 8.1. Key Findings / Summary
      • 8.2. Market Analysis, Insights and Forecast – By Segment 1
        • 8.2.1. Sub-Segment 1
        • 8.2.2. Sub-Segment 2
      • 8.3. Market Analysis, Insights and Forecast – By Segment 2
        • 8.3.1. Sub-Segment 1
        • 8.3.2. Sub-Segment 2
        • 8.3.3. Sub-Segment 3
        • 8.3.4. Others
      • 8.4. Market Analysis, Insights and Forecast – By Segment 3
        • 8.4.1. Sub-Segment 1
        • 8.4.2. Sub-Segment 2
        • 8.4.3. Sub-Segment 3
        • 8.4.4. Others
      • 8.5. Market Analysis, Insights and Forecast – By Country
        • 8.5.1. UK
        • 8.5.2. Germany
        • 8.5.3. France
        • 8.5.4. Italy
        • 8.5.5. Spain
        • 8.5.6. Russia
        • 8.5.7. Rest of Europe

      9. Asia Pacific Virtual Humans In Healthcare Market Analysis (USD Billion), Insights and Forecast, 2018-2029

      • 9.1. Key Findings / Summary
      • 9.2. Market Analysis, Insights and Forecast – By Segment 1
        • 9.2.1. Sub-Segment 1
        • 9.2.2. Sub-Segment 2
      • 9.3. Market Analysis, Insights and Forecast – By Segment 2
        • 9.3.1. Sub-Segment 1
        • 9.3.2. Sub-Segment 2
        • 9.3.3. Sub-Segment 3
        • 9.3.4. Others
      • 9.4. Market Analysis, Insights and Forecast – By Segment 3
        • 9.4.1. Sub-Segment 1
        • 9.4.2. Sub-Segment 2
        • 9.4.3. Sub-Segment 3
        • 9.4.4. Others
      • 9.5. Market Analysis, Insights and Forecast – By Country
        • 9.5.1. China
        • 9.5.2. India
        • 9.5.3. Japan
        • 9.5.4. Australia
        • 9.5.5. South East Asia
        • 9.5.6. Rest of Asia Pacific

      10. Middle East & Africa Virtual Humans In Healthcare Market Analysis (USD Billion), Insights and Forecast, 2018-2029

      • 10.1. Key Findings / Summary
      • 10.2. Market Analysis, Insights and Forecast – By Segment 1
        • 10.2.1. Sub-Segment 1
        • 10.2.2. Sub-Segment 2
      • 10.3. Market Analysis, Insights and Forecast – By Segment 2
        • 10.3.1. Sub-Segment 1
        • 10.3.2. Sub-Segment 2
        • 10.3.3. Sub-Segment 3
        • 10.3.4. Others
      • 10.4. Market Analysis, Insights and Forecast – By Segment 3
        • 10.4.1. Sub-Segment 1
        • 10.4.2. Sub-Segment 2
        • 10.4.3. Sub-Segment 3
        • 10.4.4. Others
      • 10.5. Market Analysis, Insights and Forecast – By Country
        • 10.5.1. GCC
        • 10.5.2. South Africa
        • 10.5.3. Rest of Middle East & Africa

      11. Competitive Analysis

      • 11.1. Company Market Share Analysis, 2018
      • 11.2. Key Industry Developments
      • 11.3. Company Profile
        • 11.3.1. Company 1
          • 11.3.1.1. Business Overview
          • 11.3.1.2. Segment 1 & Service Offering
          • 11.3.1.3. Overall Revenue
          • 11.3.1.4. Geographic Presence
          • 11.3.1.5. Recent Development
        *Similar details will be provided for the following companies
        • 11.3.2. Company 2
        • 11.3.3. Company 3
        • 11.3.4. Company 4
        • 11.3.5. Company 5
        • 11.3.6. Company 6
        • 11.3.7. Company 7
        • 11.3.8. Company 8
        • 11.3.9. Company 9
        • 11.3.10. Company 10
        • 11.3.11. Company 11
        • 11.3.12. Company 12
      List of Figures

      Figure 1: Global Virtual Humans In Healthcare Market Revenue Breakdown (USD Billion, %) by Region, 2022 & 2029
      Figure 2: Global Virtual Humans In Healthcare Market Value Share (%), By Segment 1, 2022 & 2029
      Figure 3: Global Virtual Humans In Healthcare Market Forecast (USD Billion), by Sub-Segment 1, 2018-2029
      Figure 4: Global Virtual Humans In Healthcare Market Forecast (USD Billion), by Sub-Segment 2, 2018-2029
      Figure 5: Global Virtual Humans In Healthcare Market Value Share (%), By Segment 2, 2022 & 2029
      Figure 6: Global Virtual Humans In Healthcare Market Forecast (USD Billion), by Sub-Segment 1, 2018-2029
      Figure 7: Global Virtual Humans In Healthcare Market Forecast (USD Billion), by Sub-Segment 2, 2018-2029
      Figure 8: Global Virtual Humans In Healthcare Market Forecast (USD Billion), by Sub-Segment 3, 2018-2029
      Figure 9: Global Virtual Humans In Healthcare Market Forecast (USD Billion), by Others, 2018-2029
      Figure 10: Global Virtual Humans In Healthcare Market Value Share (%), By Segment 3, 2022 & 2029
      Figure 11: Global Virtual Humans In Healthcare Market Forecast (USD Billion), by Sub-Segment 1, 2018-2029
      Figure 12: Global Virtual Humans In Healthcare Market Forecast (USD Billion), by Sub-Segment 2, 2018-2029
      Figure 13: Global Virtual Humans In Healthcare Market Forecast (USD Billion), by Sub-Segment 3, 2018-2029
      Figure 14: Global Virtual Humans In Healthcare Market Forecast (USD Billion), by Others, 2018-2029
      Figure 15: Global Virtual Humans In Healthcare Market Value (USD Billion), by Region, 2022 & 2029
      Figure 16: North America Virtual Humans In Healthcare Market Value Share (%), By Segment 1, 2022 & 2029
      Figure 17: North America Virtual Humans In Healthcare Market Forecast (USD Billion), by Sub-Segment 1, 2018-2029
      Figure 18: North America Virtual Humans In Healthcare Market Forecast (USD Billion), by Sub-Segment 2, 2018-2029
      Figure 19: North America Virtual Humans In Healthcare Market Value Share (%), By Segment 2, 2022 & 2029
      Figure 20: North America Virtual Humans In Healthcare Market Forecast (USD Billion), by Sub-Segment 1, 2018-2029
      Figure 21: North America Virtual Humans In Healthcare Market Forecast (USD Billion), by Sub-Segment 2, 2018-2029
      Figure 22: North America Virtual Humans In Healthcare Market Forecast (USD Billion), by Sub-Segment 3, 2018-2029
      Figure 23: North America Virtual Humans In Healthcare Market Forecast (USD Billion), by Others, 2018-2029
      Figure 24: North America Virtual Humans In Healthcare Market Value Share (%), By Segment 3, 2022 & 2029
      Figure 25: North America Virtual Humans In Healthcare Market Forecast (USD Billion), by Sub-Segment 1, 2018-2029
      Figure 26: North America Virtual Humans In Healthcare Market Forecast (USD Billion), by Sub-Segment 2, 2018-2029
      Figure 27: North America Virtual Humans In Healthcare Market Forecast (USD Billion), by Sub-Segment 3, 2018-2029
      Figure 28: North America Virtual Humans In Healthcare Market Forecast (USD Billion), by Others, 2018-2029
      Figure 29: North America Virtual Humans In Healthcare Market Forecast (USD Billion), by U.S., 2018-2029
      Figure 30: North America Virtual Humans In Healthcare Market Forecast (USD Billion), by Canada, 2018-2029
      Figure 31: Latin America Virtual Humans In Healthcare Market Value Share (%), By Segment 1, 2022 & 2029
      Figure 32: Latin America Virtual Humans In Healthcare Market Forecast (USD Billion), by Sub-Segment 1, 2018-2029
      Figure 33: Latin America Virtual Humans In Healthcare Market Forecast (USD Billion), by Sub-Segment 2, 2018-2029
      Figure 34: Latin America Virtual Humans In Healthcare Market Value Share (%), By Segment 2, 2022 & 2029
      Figure 35: Latin America Virtual Humans In Healthcare Market Forecast (USD Billion), by Sub-Segment 1, 2018-2029
      Figure 36: Latin America Virtual Humans In Healthcare Market Forecast (USD Billion), by Sub-Segment 2, 2018-2029
      Figure 37: Latin America Virtual Humans In Healthcare Market Forecast (USD Billion), by Sub-Segment 3, 2018-2029
      Figure 38: Latin America Virtual Humans In Healthcare Market Forecast (USD Billion), by Others, 2018-2029
      Figure 39: Latin America Virtual Humans In Healthcare Market Value Share (%), By Segment 3, 2022 & 2029
      Figure 40: Latin America Virtual Humans In Healthcare Market Forecast (USD Billion), by Sub-Segment 1, 2018-2029
      Figure 41: Latin America Virtual Humans In Healthcare Market Forecast (USD Billion), by Sub-Segment 2, 2018-2029
      Figure 42: Latin America Virtual Humans In Healthcare Market Forecast (USD Billion), by Sub-Segment 3, 2018-2029
      Figure 43: Latin America Virtual Humans In Healthcare Market Forecast (USD Billion), by Others, 2018-2029
      Figure 44: Latin America Virtual Humans In Healthcare Market Forecast (USD Billion), by Brazil, 2018-2029
      Figure 45: Latin America Virtual Humans In Healthcare Market Forecast (USD Billion), by Mexico, 2018-2029
      Figure 46: Latin America Virtual Humans In Healthcare Market Forecast (USD Billion), by Rest of Latin America, 2018-2029
      Figure 47: Europe Virtual Humans In Healthcare Market Value Share (%), By Segment 1, 2022 & 2029
      Figure 48: Europe Virtual Humans In Healthcare Market Forecast (USD Billion), by Sub-Segment 1, 2018-2029
      Figure 49: Europe Virtual Humans In Healthcare Market Forecast (USD Billion), by Sub-Segment 2, 2018-2029
      Figure 50: Europe Virtual Humans In Healthcare Market Value Share (%), By Segment 2, 2022 & 2029
      Figure 51: Europe Virtual Humans In Healthcare Market Forecast (USD Billion), by Sub-Segment 1, 2018-2029
      Figure 52: Europe Virtual Humans In Healthcare Market Forecast (USD Billion), by Sub-Segment 2, 2018-2029
      Figure 53: Europe Virtual Humans In Healthcare Market Forecast (USD Billion), by Sub-Segment 3, 2018-2029
      Figure 54: Europe Virtual Humans In Healthcare Market Forecast (USD Billion), by Others, 2018-2029
      Figure 55: Europe Virtual Humans In Healthcare Market Value Share (%), By Segment 3, 2022 & 2029
      Figure 56: Europe Virtual Humans In Healthcare Market Forecast (USD Billion), by Sub-Segment 1, 2018-2029
      Figure 57: Europe Virtual Humans In Healthcare Market Forecast (USD Billion), by Sub-Segment 2, 2018-2029
      Figure 58: Europe Virtual Humans In Healthcare Market Forecast (USD Billion), by Sub-Segment 3, 2018-2029
      Figure 59: Europe Virtual Humans In Healthcare Market Forecast (USD Billion), by Others, 2018-2029
      Figure 60: Europe Virtual Humans In Healthcare Market Forecast (USD Billion), by U.K., 2018-2029
      Figure 61: Europe Virtual Humans In Healthcare Market Forecast (USD Billion), by Germany, 2018-2029
      Figure 62: Europe Virtual Humans In Healthcare Market Forecast (USD Billion), by France, 2018-2029
      Figure 63: Europe Virtual Humans In Healthcare Market Forecast (USD Billion), by Italy, 2018-2029
      Figure 64: Europe Virtual Humans In Healthcare Market Forecast (USD Billion), by Spain, 2018-2029
      Figure 65: Europe Virtual Humans In Healthcare Market Forecast (USD Billion), by Russia, 2018-2029
      Figure 66: Europe Virtual Humans In Healthcare Market Forecast (USD Billion), by Rest of Europe, 2018-2029
      Figure 67: Asia Pacific Virtual Humans In Healthcare Market Value Share (%), By Segment 1, 2022 & 2029
      Figure 68: Asia Pacific Virtual Humans In Healthcare Market Forecast (USD Billion), by Sub-Segment 1, 2018-2029
      Figure 69: Asia Pacific Virtual Humans In Healthcare Market Forecast (USD Billion), by Sub-Segment 2, 2018-2029
      Figure 70: Asia Pacific Virtual Humans In Healthcare Market Value Share (%), By Segment 2, 2022 & 2029
      Figure 71: Asia Pacific Virtual Humans In Healthcare Market Forecast (USD Billion), by Sub-Segment 1, 2018-2029
      Figure 72: Asia Pacific Virtual Humans In Healthcare Market Forecast (USD Billion), by Sub-Segment 2, 2018-2029
      Figure 73: Asia Pacific Virtual Humans In Healthcare Market Forecast (USD Billion), by Sub-Segment 3, 2018-2029
      Figure 74: Asia Pacific Virtual Humans In Healthcare Market Forecast (USD Billion), by Others, 2018-2029
      Figure 75: Asia Pacific Virtual Humans In Healthcare Market Value Share (%), By Segment 3, 2022 & 2029
      Figure 76: Asia Pacific Virtual Humans In Healthcare Market Forecast (USD Billion), by Sub-Segment 1, 2018-2029
      Figure 77: Asia Pacific Virtual Humans In Healthcare Market Forecast (USD Billion), by Sub-Segment 2, 2018-2029
      Figure 78: Asia Pacific Virtual Humans In Healthcare Market Forecast (USD Billion), by Sub-Segment 3, 2018-2029
      Figure 79: Asia Pacific Virtual Humans In Healthcare Market Forecast (USD Billion), by Others, 2018-2029
      Figure 80: Asia Pacific Virtual Humans In Healthcare Market Forecast (USD Billion), by China, 2018-2029
      Figure 81: Asia Pacific Virtual Humans In Healthcare Market Forecast (USD Billion), by India, 2018-2029
      Figure 82: Asia Pacific Virtual Humans In Healthcare Market Forecast (USD Billion), by Japan, 2018-2029
      Figure 83: Asia Pacific Virtual Humans In Healthcare Market Forecast (USD Billion), by Australia, 2018-2029
      Figure 84: Asia Pacific Virtual Humans In Healthcare Market Forecast (USD Billion), by Southeast Asia, 2018-2029
      Figure 85: Asia Pacific Virtual Humans In Healthcare Market Forecast (USD Billion), by Rest of Asia Pacific, 2018-2029
      Figure 86: Middle East & Africa Virtual Humans In Healthcare Market Value Share (%), By Segment 1, 2022 & 2029
      Figure 87: Middle East & Africa Virtual Humans In Healthcare Market Forecast (USD Billion), by Sub-Segment 1, 2018-2029
      Figure 88: Middle East & Africa Virtual Humans In Healthcare Market Forecast (USD Billion), by Sub-Segment 2, 2018-2029
      Figure 89: Middle East & Africa Virtual Humans In Healthcare Market Value Share (%), By Segment 2, 2022 & 2029
      Figure 90: Middle East & Africa Virtual Humans In Healthcare Market Forecast (USD Billion), by Sub-Segment 1, 2018-2029
      Figure 91: Middle East & Africa Virtual Humans In Healthcare Market Forecast (USD Billion), by Sub-Segment 2, 2018-2029
      Figure 92: Middle East & Africa Virtual Humans In Healthcare Market Forecast (USD Billion), by Sub-Segment 3, 2018-2029
      Figure 93: Middle East & Africa Virtual Humans In Healthcare Market Forecast (USD Billion), by Others, 2018-2029
      Figure 94: Middle East & Africa Virtual Humans In Healthcare Market Value Share (%), By Segment 3, 2022 & 2029
      Figure 95: Middle East & Africa Virtual Humans In Healthcare Market Forecast (USD Billion), by Sub-Segment 1, 2018-2029
      Figure 96: Middle East & Africa Virtual Humans In Healthcare Market Forecast (USD Billion), by Sub-Segment 2, 2018-2029
      Figure 97: Middle East & Africa Virtual Humans In Healthcare Market Forecast (USD Billion), by Sub-Segment 3, 2018-2029
      Figure 98: Middle East & Africa Virtual Humans In Healthcare Market Forecast (USD Billion), by Others, 2018-2029
      Figure 99: Middle East & Africa Virtual Humans In Healthcare Market Forecast (USD Billion), by GCC, 2018-2029
      Figure 100: Middle East & Africa Virtual Humans In Healthcare Market Forecast (USD Billion), by South Africa, 2018-2029
      Figure 101: Middle East & Africa Virtual Humans In Healthcare Market Forecast (USD Billion), by Rest of Middle East & Africa, 2018-2029 
      List of Tables
      Table 1: Global Virtual Humans In Healthcare Market Revenue (USD Billion) Forecast, by Segment 1, 2018-2029
      Table 2: Global Virtual Humans In Healthcare Market Revenue (USD Billion) Forecast, by Segment 2, 2018-2029
      Table 3: Global Virtual Humans In Healthcare Market Revenue (USD Billion) Forecast, by Segment 3, 2018-2029
      Table 4: Global Virtual Humans In Healthcare Market Revenue (USD Billion) Forecast, by Region, 2018-2029
      Table 5: North America Virtual Humans In Healthcare Market Revenue (USD Billion) Forecast, by Segment 1, 2018-2029
      Table 6: North America Virtual Humans In Healthcare Market Revenue (USD Billion) Forecast, by Segment 2, 2018-2029
      Table 7: North America Virtual Humans In Healthcare Market Revenue (USD Billion) Forecast, by Segment 3, 2018-2029
      Table 8: North America Virtual Humans In Healthcare Market Revenue (USD Billion) Forecast, by Country, 2018-2029
      Table 9: Europe Virtual Humans In Healthcare Market Revenue (USD Billion) Forecast, by Segment 1, 2018-2029
      Table 10: Europe Virtual Humans In Healthcare Market Revenue (USD Billion) Forecast, by Segment 2, 2018-2029
      Table 11: Europe Virtual Humans In Healthcare Market Revenue (USD Billion) Forecast, by Segment 3, 2018-2029
      Table 12: Europe Virtual Humans In Healthcare Market Revenue (USD Billion) Forecast, by Country, 2018-2029
      Table 13: Latin America Virtual Humans In Healthcare Market Revenue (USD Billion) Forecast, by Segment 1, 2018-2029
      Table 14: Latin America Virtual Humans In Healthcare Market Revenue (USD Billion) Forecast, by Segment 2, 2018-2029
      Table 15: Latin America Virtual Humans In Healthcare Market Revenue (USD Billion) Forecast, by Segment 3, 2018-2029
      Table 16: Latin America Virtual Humans In Healthcare Market Revenue (USD Billion) Forecast, by Country, 2018-2029
      Table 17: Asia Pacific Virtual Humans In Healthcare Market Revenue (USD Billion) Forecast, by Segment 1, 2018-2029
      Table 18: Asia Pacific Virtual Humans In Healthcare Market Revenue (USD Billion) Forecast, by Segment 2, 2018-2029
      Table 19: Asia Pacific Virtual Humans In Healthcare Market Revenue (USD Billion) Forecast, by Segment 3, 2018-2029
      Table 20: Asia Pacific Virtual Humans In Healthcare Market Revenue (USD Billion) Forecast, by Country, 2018-2029
      Table 21: Middle East & Africa Virtual Humans In Healthcare Market Revenue (USD Billion) Forecast, by Segment 1, 2018-2029
      Table 22: Middle East & Africa Virtual Humans In Healthcare Market Revenue (USD Billion) Forecast, by Segment 2, 2018-2029
      Table 23: Middle East & Africa Virtual Humans In Healthcare Market Revenue (USD Billion) Forecast, by Segment 3, 2018-2029
      Table 24: Middle East & Africa Virtual Humans In Healthcare Market Revenue (USD Billion) Forecast, by Country, 2018-2029
      Research Process

      Data Library Research are conducted by industry experts who offer insight on industry structure, market segmentations technology assessment and competitive landscape (CL), and penetration, as well as on emerging trends. Their analysis is based on primary interviews (~ 80%) and secondary research (~ 20%) as well as years of professional expertise in their respective industries. Adding to this, by analysing historical trends and current market positions, our analysts predict where the market will be headed for the next five years. Furthermore, the varying trends of segment & categories geographically presented are also studied and the estimated based on the primary & secondary research.

      In this particular report from the supply side Data Library Research has conducted primary surveys (interviews) with the key level executives (VP, CEO’s, Marketing Director, Business Development Manager and SOFT) of the companies that active & prominent as well as the midsized organization

      FIGURE 1: DLR RESEARH PROCESS

      research-methodology1

      Primary Research

      Extensive primary research was conducted to gain a deeper insight of the market and industry performance. The analysis is based on both primary and secondary research as well as years of professional expertise in the respective industries.

      In addition to analysing current and historical trends, our analysts predict where the market is headed over the next five years.

      It varies by segment for these categories geographically presented in the list of market tables. Speaking about this particular report we have conducted primary surveys (interviews) with the key level executives (VP, CEO’s, Marketing Director, Business Development Manager and many more) of the major players active in the market.

      Secondary Research

      Secondary research was mainly used to collect and identify information useful for the extensive, technical, market-oriented, and Friend’s study of the Global Extra Neutral Alcohol. It was also used to obtain key information about major players, market classification and segmentation according to the industry trends, geographical markets, and developments related to the market and technology perspectives. For this study, analysts have gathered information from various credible sources, such as annual reports, sec filings, journals, white papers, SOFT presentations, and company web sites.

      Market Size Estimation

      Both, top-down and bottom-up approaches were used to estimate and validate the size of the Global market and to estimate the size of various other dependent submarkets in the overall Extra Neutral Alcohol. The key players in the market were identified through secondary research and their market contributions in the respective geographies were determined through primary and secondary research.

      Forecast Model

      research-methodology2