VR Game Peripheral Market Overview and Analysis

The Global VR Game Peripheral Market size is estimated at USD 36.9 billion in 2025 and is projected to reach USD 99.8 billion by 2032, growing with a CAGR of 18.98% from 2025-2032.

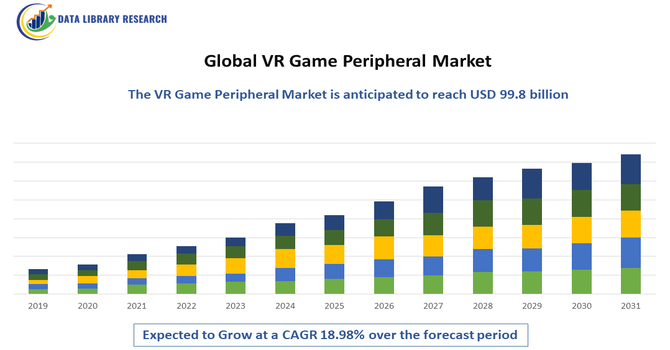
The Global VR Game Peripheral Market is experiencing strong growth, fueled by rising adoption of immersive gaming technologies, expanding consumer interest in virtual reality entertainment, and increasing availability of advanced VR devices and accessories. Growth is driven by the surge in VR gaming platforms, improvements in VR hardware performance, and expanding integration of haptic feedback systems, motion controllers, VR gloves, treadmills, and sensory suits to enhance realism and user engagement. The growing popularity of metaverse platforms, e-sports, and social VR experiences is further accelerating demand for high-precision, ergonomic, and highly interactive peripherals.

VR Game Peripheral Market Latest Trends

key trends are reshaping how gamers interact with virtual environments. First, peripherals are increasingly designed for natural interaction controllers, gloves, treadmills, and full-body tracking systems are becoming more intuitive with hand-tracking, eye-tracking, voice commands and gesture controls, reducing reliance on traditional buttons and sticks. Secondly, immersive haptic and sensory feedback is gaining prominence: wearable haptic devices, torque-feedback systems and tactile suits are being developed to deliver more realistic touch, resistance and motion sensation, enhancing user presence and realism in VR experiences. Thirdly, accessibility and affordability are improving VR game peripherals are being optimized for wireless operation, standalone headsets, simplified setup and lower cost, helping to expand the user base beyond early-adopters.

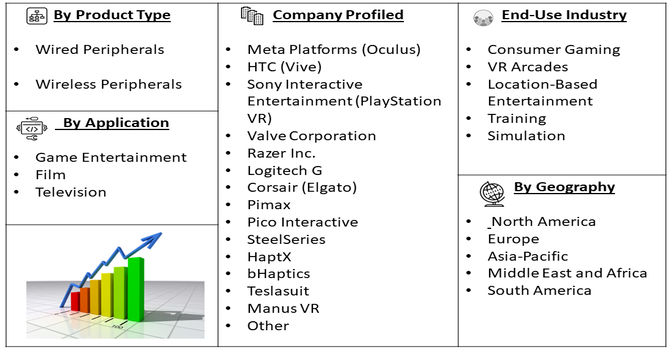
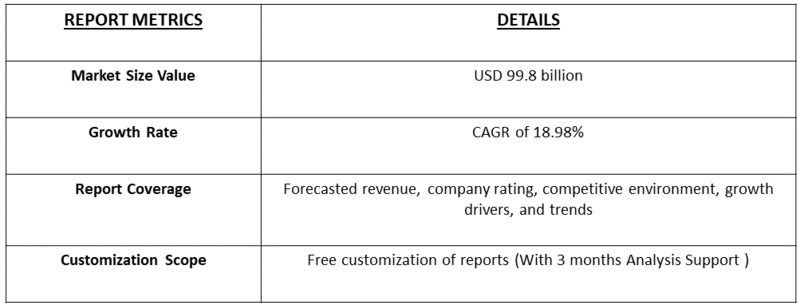
Segmentation: Global VR Game Peripheral Market is segmented by Product Type (Wired Peripherals, Wireless Peripherals), Application (Game Entertainment, and Film & Television), End-Use Industry (Consumer Gaming, VR Arcades & Location-Based Entertainment, and Training & Simulation), and Geography (North America, Europe, Asia-Pacific, Middle East and Africa, and South America). The report provides the value (in USD million) for the above segments.

Market Drivers:

  • Growing Adoption of Immersive Gaming and Virtual Experiences

The rapid rise in demand for immersive and interactive gaming environments is a major driver for the VR game peripheral market. As gaming shifts from traditional console-based formats to highly realistic virtual environments, consumers are increasingly investing in advanced peripherals such as motion controllers, VR gloves, treadmills, haptic suits, and full-body trackers to enhance immersion and realism. The surge in VR-based gaming titles, expanding VR content libraries, and rising popularity of multiplayer VR gaming and VR-enabled e-sports are further accelerating adoption. Continued improvements in VR display technology, faster graphics processing, and reduced latency also support growth by making virtual experiences more natural and responsive, encouraging gamers to adopt high-performance peripherals for more engaging gameplay.

  • Expanding VR Ecosystem Driven by Technology Innovation and Affordability

Technological advancements and falling price points for VR systems are significantly fueling market expansion. Innovations such as wireless connectivity, AI-powered motion tracking, precision haptic feedback, ergonomic controller designs, and lighter wearable devices are making VR peripherals more user-friendly and accessible to a broader audience. The increasing availability of standalone VR headsets and compatibility with gaming consoles and gaming PCs has simplified setup and lowered entry barriers for consumers.

In February 2024, Apple Inc. unveiled the Vision Pro mixed reality headset, featuring a distinctive interface controlled through eye, hand, and voice movements, along with an ultra-immersive 4K display. The device launched with over one million applications, including 600 exclusive titles designed specifically for Vision Pro. This release positioned Apple as a key competitor in the mixed reality sector and significantly impacted the global VR game peripheral market by elevating technological standards, enhancing user experience, and stimulating innovation across immersive gaming ecosystems. Also, the growing investments by gaming studios, VR hardware manufacturers, and tech companies in next-generation experiences further strengthen market momentum and adoption.

Market Restraints

  • High Cost Associated with Advanced VR Peripherals

A primary challenge is the high cost associated with advanced VR peripherals, including haptic suits, omnidirectional treadmills, motion-tracking systems, and premium VR controllers. These devices often require compatible VR headsets and high-performance gaming systems, creating a substantial investment barrier for mainstream consumers. Additionally, frequent hardware upgrades and the cost of maintaining or replacing specialized accessories can deter long-term adoption among casual gamers.

Moreover, the high production and development costs of VR peripherals limit accessibility in emerging markets, where average consumer purchasing power remains low. This economic barrier restricts widespread adoption, concentrating market growth primarily in developed regions with strong technological infrastructure. As a result, socioeconomic disparities in digital participation persist, influencing who can benefit from immersive technologies in gaming, education, and professional training.

Socio Economic Impact on VR Game Peripheral Market

The global VR game peripheral market has significant socioeconomic impacts, driving technological innovation, job creation, and digital inclusion. As demand for immersive gaming experiences rises, industries related to hardware manufacturing, software development, and digital design expand, generating employment opportunities and boosting local economies. This market stimulates investment in advanced technologies like haptics, motion tracking, and AI, which often spill over into education, healthcare, and training sectors. However, disparities in affordability and access may widen the digital divide, limiting participation in low-income regions. Additionally, rising e-waste and production costs pose sustainability concerns. Thus, the VR game peripheral market contributes to economic growth and social transformation, blending entertainment with emerging technologies that redefine global digital economies.

Segmental Analysis:

  • Wireless Peripherals segment is expected to witness highest growth over the forecast period

Wireless peripherals are expected to lead the market as users increasingly prefer cable-free, highly mobile VR experiences. Advancements in Bluetooth, Wi-Fi, and motion-tracking technologies are making wireless controllers, haptic gloves, VR treadmills, and head-mounted accessories more responsive and lag-free. The comfort and freedom of movement offered by wireless peripherals significantly enhances immersion, making them the preferred choice for both home users and commercial gaming centers. Falling battery costs, improved battery life, and seamless connectivity across VR platforms further accelerate adoption in this segment.

  • Game Entertainment segment is expected to witness highest growth over the forecast period

Game entertainment remains the dominant application segment, driven by the explosive growth of immersive gaming and widespread consumer adoption of VR gaming systems. Increasing availability of VR-exclusive titles, integration of haptic feedback for realistic gameplay, and rising popularity of multiplayer VR environments continue to fuel demand. Major gaming console makers and VR content studios are introducing advanced peripherals designed specifically for interactive gaming, contributing to rapid segment expansion.

  • Consumer Gaming segment is expected to witness highest growth over the forecast period

Consumer gaming forms the largest and fastest-growing end-use segment, fueled by rising interest in immersive home entertainment and increasing affordability of VR hardware. Casual and professional gamers alike are adopting VR peripherals such as motion controllers, headsets, tracking sensors, and VR chairs to elevate gameplay realism. Enhanced PC and console compatibility, emerging subscription-based VR content platforms, and greater awareness of VR fitness and interactive entertainment further support consumer uptake.

  • North America region is expected to witness highest growth over the forecast period

North America region is expected to witness the highest growth over the forecast period in the Global VR Game Peripheral Market, driven by strong technological infrastructure, high consumer spending on immersive gaming devices, and widespread adoption of VR platforms among gamers and entertainment centers.

The region benefits from the presence of leading VR hardware manufacturers, well-established gaming studios, and a robust ecosystem of innovation supported by tech giants and startups. For instance, in March 2024, Virtuix introduced the Omni One, a 360-degree VR treadmill paired with a customized Pico 4 Enterprise headset and a library of 35 compatible games. The system delivered an unmatched immersive gaming experience with seamless motion integration, reflecting Virtuix’s commitment to redefining VR gameplay through cutting-edge hardware. This launch significantly influenced the global VR game peripheral market by advancing full-body motion technology and boosting consumer engagement. In North America, it stimulated market growth, investor interest, and demand for high-end VR entertainment systems. Thus, the increasing penetration of advanced gaming consoles, rising number of VR arcades and e-sports arenas, and strong adoption across military, aviation, and corporate training sectors further accelerate market expansion.

VR Game Peripheral Market Competitive Landscape

The market is competitive and dynamic, led by large tech and gaming hardware firms alongside specialized startups focusing on haptics, locomotion, and tracking. Established peripheral and console makers compete on ecosystem integration, while niche innovators push advanced haptics, full-body tracking, and omnidirectional locomotion solutions creating a mix of broad incumbents and fast-moving specialists.

Key Players:

  • Meta Platforms (Oculus)
  • HTC (Vive)
  • Sony Interactive Entertainment (PlayStation VR)
  • Valve Corporation
  • Razer Inc.
  • Logitech G
  • Corsair (Elgato)
  • Pimax
  • Pico Interactive
  • SteelSeries
  • HaptX
  • bHaptics
  • Teslasuit
  • Manus VR
  • SenseGlove
  • Ultraleap
  • Virtuix
  • KAT VR
  • Cybershoes
  • 3dRudder

Recent Developments

  • In June 2025, UDEXREAL, an innovator in ultra-thin elastic sensor technology for the VR industry, announced the launch of the UDCAP VR Glove, the lightest VR gaming glove designed to track finger movements with exceptional precision. Its advanced 21-joint-angle tracking enabled natural hand gestures, effectively replacing traditional controllers and creating a more realistic VR experience. This innovation significantly influenced the global VR game peripheral market by advancing wearable technology, promoting controller-free interaction, and inspiring greater investment in immersive, human-centered VR gaming solutions.


  • In April 2024, Meta Platforms, Inc. partnered with Asus, Microsoft Corporation, and Lenovo to extend its Horizon OS to third-party devices, intensifying competition with Apple in the virtual and mixed reality markets. The collaboration promoted an open computing model and encouraged broader adoption of Horizon OS. This initiative strengthened Meta’s presence in the mixed reality sector and significantly impacted the global VR game peripheral market by fostering cross-platform compatibility, driving innovation, and expanding opportunities for developers and hardware manufacturers worldwide.


Frequently Asked Questions (FAQ) :

Q1. What are the main growth driving factors for this market?

The market is driven by the increasing consumer demand for hyper-realistic and deeply immersive gaming experiences that basic controllers cannot provide. Continuous advancements in VR hardware, especially the launch of more affordable and capable standalone headsets, significantly expands the potential user base. The integration of cutting-edge technologies like advanced haptic feedback, full-body tracking, and sophisticated motion controllers also enhances user engagement and fuels the adoption of high-end peripherals.

Q2. What are the main restraining factors for this market?

The main constraints include the high total cost of entry for consumers, which combines the price of the VR headset with the necessary specialized peripherals. Technical limitations such as motion sickness (cybersickness), limited battery life in wireless accessories, and the ongoing need for powerful, dedicated processing units can negatively impact the user experience. Furthermore, the lack of universal standards leads to interoperability issues between different VR ecosystems and peripherals.

Q3. Which segment is expected to witness high growth?

The Semi- and Fully Immersive Peripherals segment is projected to witness the highest growth. This includes devices that go beyond standard controllers, such as haptic gloves/suits, VR treadmills/simulators, and sophisticated gesture-tracking devices (GTD). This growth is driven by increasing adoption in both the consumer segment, seeking the ultimate realistic experience, and the commercial segment (e.g., VR arcades, training, and simulation), which demands complex, high-fidelity peripherals for advanced applications.

Q4. Who are the top major players for this market?

The market is led by major technology conglomerates that control the VR platform ecosystem and specialist peripheral manufacturers. Key players include Meta Platforms (Oculus/Meta Quest), Sony Group Corporation (PlayStation VR), and HTC Corporation (Vive), who define the standards. Specialist peripheral companies like HaptX Inc. (haptic technology), NVIDIA Corporation (GPUs and software), and other established gaming peripheral brands like Razer Inc. and Logitech are also crucial, offering a diverse range of third-party accessories.

Q5. Which country is the largest player?

North America, especially the United States, is currently the largest market player by revenue share. This is due to a robust ecosystem that includes the headquarters of major technology players (Meta, etc.), high consumer spending on gaming and new technology, and a strong culture of early adoption. However, the Asia Pacific (APAC) region, led by China and South Korea, is widely anticipated to register the highest growth rate, propelled by massive mobile gaming penetration and rapidly expanding VR arcade and entertainment centers.

VR Game Peripheral MARKET STUDY GLOBAL MARKET ANALYSIS, INSIGHTS AND FORECAST, 2022-2029

    1. Introduction

    • 1.1. Research Scope
    • 1.2. Market Segmentation
    • 1.3. Research Methodology
    • 1.4. Definitions and Assumptions

    2. Executive Summary

      3. Market Dynamics

      • 3.1. Market Drivers
      • 3.2. Market Restraints
      • 3.3. Market Opportunities

      4. Key Insights

      • 4.1. Key Emerging Trends – For Major Countries
      • 4.2. Latest Technological Advancement
      • 4.3. Regulatory Landscape
      • 4.4. Industry SWOT Analysis
      • 4.5. Porters Five Forces Analysis

      5. Global VR Game Peripheral Market Analysis (USD Billion), Insights and Forecast, 2018-2029

      • 5.1. Key Findings / Summary
      • 5.2. Market Analysis, Insights and Forecast – By Segment 1
        • 5.2.1. Sub-Segment 1
        • 5.2.2. Sub-Segment 2
      • 5.3. Market Analysis, Insights and Forecast – By Segment 2
        • 5.3.1. Sub-Segment 1
        • 5.3.2. Sub-Segment 2
        • 5.3.3. Sub-Segment 3
        • 5.3.4. Others
      • 5.4. Market Analysis, Insights and Forecast – By Segment 3
        • 5.4.1. Sub-Segment 1
        • 5.4.2. Sub-Segment 2
        • 5.4.3. Sub-Segment 3
        • 5.4.4. Others
      • 5.5. Market Analysis, Insights and Forecast – By Region
        • 5.5.1. North America
        • 5.5.2. Latin America
        • 5.5.3. Europe
        • 5.5.4. Asia Pacific
        • 5.5.5. Middle East and Africa

      6. North America VR Game Peripheral Market Analysis (USD Billion), Insights and Forecast, 2018-2029

      • 6.1. Key Findings / Summary
      • 6.2. Market Analysis, Insights and Forecast – By Segment 1
        • 6.2.1. Sub-Segment 1
        • 6.2.2. Sub-Segment 2
      • 6.3. Market Analysis, Insights and Forecast – By Segment 2
        • 6.3.1. Sub-Segment 1
        • 6.3.2. Sub-Segment 2
        • 6.3.3. Sub-Segment 3
        • 6.3.4. Others
      • 6.4. Market Analysis, Insights and Forecast – By Segment 3
        • 6.4.1. Sub-Segment 1
        • 6.4.2. Sub-Segment 2
        • 6.4.3. Sub-Segment 3
        • 6.4.4. Others
      • 6.5. Market Analysis, Insights and Forecast – By Country
        • 6.5.1. U.S.
        • 6.5.2. Canada

      7. Latin America VR Game Peripheral Market Analysis (USD Billion), Insights and Forecast, 2018-2029

      • 7.1. Key Findings / Summary
      • 7.2. Market Analysis, Insights and Forecast – By Segment 1
        • 7.2.1. Sub-Segment 1
        • 7.2.2. Sub-Segment 2
      • 7.3. Market Analysis, Insights and Forecast – By Segment 2
        • 7.3.1. Sub-Segment 1
        • 7.3.2. Sub-Segment 2
        • 7.3.3. Sub-Segment 3
        • 7.3.4. Others
      • 7.4. Market Analysis, Insights and Forecast – By Segment 3
        • 7.4.1. Sub-Segment 1
        • 7.4.2. Sub-Segment 2
        • 7.4.3. Sub-Segment 3
        • 7.4.4. Others
      • 7.5. Insights and Forecast – By Country
        • 7.5.1. Brazil
        • 7.5.2. Mexico
        • 7.5.3. Rest of Latin America

      8. Europe VR Game Peripheral Market Analysis (USD Billion), Insights and Forecast, 2018-2029

      • 8.1. Key Findings / Summary
      • 8.2. Market Analysis, Insights and Forecast – By Segment 1
        • 8.2.1. Sub-Segment 1
        • 8.2.2. Sub-Segment 2
      • 8.3. Market Analysis, Insights and Forecast – By Segment 2
        • 8.3.1. Sub-Segment 1
        • 8.3.2. Sub-Segment 2
        • 8.3.3. Sub-Segment 3
        • 8.3.4. Others
      • 8.4. Market Analysis, Insights and Forecast – By Segment 3
        • 8.4.1. Sub-Segment 1
        • 8.4.2. Sub-Segment 2
        • 8.4.3. Sub-Segment 3
        • 8.4.4. Others
      • 8.5. Market Analysis, Insights and Forecast – By Country
        • 8.5.1. UK
        • 8.5.2. Germany
        • 8.5.3. France
        • 8.5.4. Italy
        • 8.5.5. Spain
        • 8.5.6. Russia
        • 8.5.7. Rest of Europe

      9. Asia Pacific VR Game Peripheral Market Analysis (USD Billion), Insights and Forecast, 2018-2029

      • 9.1. Key Findings / Summary
      • 9.2. Market Analysis, Insights and Forecast – By Segment 1
        • 9.2.1. Sub-Segment 1
        • 9.2.2. Sub-Segment 2
      • 9.3. Market Analysis, Insights and Forecast – By Segment 2
        • 9.3.1. Sub-Segment 1
        • 9.3.2. Sub-Segment 2
        • 9.3.3. Sub-Segment 3
        • 9.3.4. Others
      • 9.4. Market Analysis, Insights and Forecast – By Segment 3
        • 9.4.1. Sub-Segment 1
        • 9.4.2. Sub-Segment 2
        • 9.4.3. Sub-Segment 3
        • 9.4.4. Others
      • 9.5. Market Analysis, Insights and Forecast – By Country
        • 9.5.1. China
        • 9.5.2. India
        • 9.5.3. Japan
        • 9.5.4. Australia
        • 9.5.5. South East Asia
        • 9.5.6. Rest of Asia Pacific

      10. Middle East & Africa VR Game Peripheral Market Analysis (USD Billion), Insights and Forecast, 2018-2029

      • 10.1. Key Findings / Summary
      • 10.2. Market Analysis, Insights and Forecast – By Segment 1
        • 10.2.1. Sub-Segment 1
        • 10.2.2. Sub-Segment 2
      • 10.3. Market Analysis, Insights and Forecast – By Segment 2
        • 10.3.1. Sub-Segment 1
        • 10.3.2. Sub-Segment 2
        • 10.3.3. Sub-Segment 3
        • 10.3.4. Others
      • 10.4. Market Analysis, Insights and Forecast – By Segment 3
        • 10.4.1. Sub-Segment 1
        • 10.4.2. Sub-Segment 2
        • 10.4.3. Sub-Segment 3
        • 10.4.4. Others
      • 10.5. Market Analysis, Insights and Forecast – By Country
        • 10.5.1. GCC
        • 10.5.2. South Africa
        • 10.5.3. Rest of Middle East & Africa

      11. Competitive Analysis

      • 11.1. Company Market Share Analysis, 2018
      • 11.2. Key Industry Developments
      • 11.3. Company Profile
        • 11.3.1. Company 1
          • 11.3.1.1. Business Overview
          • 11.3.1.2. Segment 1 & Service Offering
          • 11.3.1.3. Overall Revenue
          • 11.3.1.4. Geographic Presence
          • 11.3.1.5. Recent Development
        *Similar details will be provided for the following companies
        • 11.3.2. Company 2
        • 11.3.3. Company 3
        • 11.3.4. Company 4
        • 11.3.5. Company 5
        • 11.3.6. Company 6
        • 11.3.7. Company 7
        • 11.3.8. Company 8
        • 11.3.9. Company 9
        • 11.3.10. Company 10
        • 11.3.11. Company 11
        • 11.3.12. Company 12
      List of Figures

      Figure 1: Global VR Game Peripheral Market Revenue Breakdown (USD Billion, %) by Region, 2022 & 2029
      Figure 2: Global VR Game Peripheral Market Value Share (%), By Segment 1, 2022 & 2029
      Figure 3: Global VR Game Peripheral Market Forecast (USD Billion), by Sub-Segment 1, 2018-2029
      Figure 4: Global VR Game Peripheral Market Forecast (USD Billion), by Sub-Segment 2, 2018-2029
      Figure 5: Global VR Game Peripheral Market Value Share (%), By Segment 2, 2022 & 2029
      Figure 6: Global VR Game Peripheral Market Forecast (USD Billion), by Sub-Segment 1, 2018-2029
      Figure 7: Global VR Game Peripheral Market Forecast (USD Billion), by Sub-Segment 2, 2018-2029
      Figure 8: Global VR Game Peripheral Market Forecast (USD Billion), by Sub-Segment 3, 2018-2029
      Figure 9: Global VR Game Peripheral Market Forecast (USD Billion), by Others, 2018-2029
      Figure 10: Global VR Game Peripheral Market Value Share (%), By Segment 3, 2022 & 2029
      Figure 11: Global VR Game Peripheral Market Forecast (USD Billion), by Sub-Segment 1, 2018-2029
      Figure 12: Global VR Game Peripheral Market Forecast (USD Billion), by Sub-Segment 2, 2018-2029
      Figure 13: Global VR Game Peripheral Market Forecast (USD Billion), by Sub-Segment 3, 2018-2029
      Figure 14: Global VR Game Peripheral Market Forecast (USD Billion), by Others, 2018-2029
      Figure 15: Global VR Game Peripheral Market Value (USD Billion), by Region, 2022 & 2029
      Figure 16: North America VR Game Peripheral Market Value Share (%), By Segment 1, 2022 & 2029
      Figure 17: North America VR Game Peripheral Market Forecast (USD Billion), by Sub-Segment 1, 2018-2029
      Figure 18: North America VR Game Peripheral Market Forecast (USD Billion), by Sub-Segment 2, 2018-2029
      Figure 19: North America VR Game Peripheral Market Value Share (%), By Segment 2, 2022 & 2029
      Figure 20: North America VR Game Peripheral Market Forecast (USD Billion), by Sub-Segment 1, 2018-2029
      Figure 21: North America VR Game Peripheral Market Forecast (USD Billion), by Sub-Segment 2, 2018-2029
      Figure 22: North America VR Game Peripheral Market Forecast (USD Billion), by Sub-Segment 3, 2018-2029
      Figure 23: North America VR Game Peripheral Market Forecast (USD Billion), by Others, 2018-2029
      Figure 24: North America VR Game Peripheral Market Value Share (%), By Segment 3, 2022 & 2029
      Figure 25: North America VR Game Peripheral Market Forecast (USD Billion), by Sub-Segment 1, 2018-2029
      Figure 26: North America VR Game Peripheral Market Forecast (USD Billion), by Sub-Segment 2, 2018-2029
      Figure 27: North America VR Game Peripheral Market Forecast (USD Billion), by Sub-Segment 3, 2018-2029
      Figure 28: North America VR Game Peripheral Market Forecast (USD Billion), by Others, 2018-2029
      Figure 29: North America VR Game Peripheral Market Forecast (USD Billion), by U.S., 2018-2029
      Figure 30: North America VR Game Peripheral Market Forecast (USD Billion), by Canada, 2018-2029
      Figure 31: Latin America VR Game Peripheral Market Value Share (%), By Segment 1, 2022 & 2029
      Figure 32: Latin America VR Game Peripheral Market Forecast (USD Billion), by Sub-Segment 1, 2018-2029
      Figure 33: Latin America VR Game Peripheral Market Forecast (USD Billion), by Sub-Segment 2, 2018-2029
      Figure 34: Latin America VR Game Peripheral Market Value Share (%), By Segment 2, 2022 & 2029
      Figure 35: Latin America VR Game Peripheral Market Forecast (USD Billion), by Sub-Segment 1, 2018-2029
      Figure 36: Latin America VR Game Peripheral Market Forecast (USD Billion), by Sub-Segment 2, 2018-2029
      Figure 37: Latin America VR Game Peripheral Market Forecast (USD Billion), by Sub-Segment 3, 2018-2029
      Figure 38: Latin America VR Game Peripheral Market Forecast (USD Billion), by Others, 2018-2029
      Figure 39: Latin America VR Game Peripheral Market Value Share (%), By Segment 3, 2022 & 2029
      Figure 40: Latin America VR Game Peripheral Market Forecast (USD Billion), by Sub-Segment 1, 2018-2029
      Figure 41: Latin America VR Game Peripheral Market Forecast (USD Billion), by Sub-Segment 2, 2018-2029
      Figure 42: Latin America VR Game Peripheral Market Forecast (USD Billion), by Sub-Segment 3, 2018-2029
      Figure 43: Latin America VR Game Peripheral Market Forecast (USD Billion), by Others, 2018-2029
      Figure 44: Latin America VR Game Peripheral Market Forecast (USD Billion), by Brazil, 2018-2029
      Figure 45: Latin America VR Game Peripheral Market Forecast (USD Billion), by Mexico, 2018-2029
      Figure 46: Latin America VR Game Peripheral Market Forecast (USD Billion), by Rest of Latin America, 2018-2029
      Figure 47: Europe VR Game Peripheral Market Value Share (%), By Segment 1, 2022 & 2029
      Figure 48: Europe VR Game Peripheral Market Forecast (USD Billion), by Sub-Segment 1, 2018-2029
      Figure 49: Europe VR Game Peripheral Market Forecast (USD Billion), by Sub-Segment 2, 2018-2029
      Figure 50: Europe VR Game Peripheral Market Value Share (%), By Segment 2, 2022 & 2029
      Figure 51: Europe VR Game Peripheral Market Forecast (USD Billion), by Sub-Segment 1, 2018-2029
      Figure 52: Europe VR Game Peripheral Market Forecast (USD Billion), by Sub-Segment 2, 2018-2029
      Figure 53: Europe VR Game Peripheral Market Forecast (USD Billion), by Sub-Segment 3, 2018-2029
      Figure 54: Europe VR Game Peripheral Market Forecast (USD Billion), by Others, 2018-2029
      Figure 55: Europe VR Game Peripheral Market Value Share (%), By Segment 3, 2022 & 2029
      Figure 56: Europe VR Game Peripheral Market Forecast (USD Billion), by Sub-Segment 1, 2018-2029
      Figure 57: Europe VR Game Peripheral Market Forecast (USD Billion), by Sub-Segment 2, 2018-2029
      Figure 58: Europe VR Game Peripheral Market Forecast (USD Billion), by Sub-Segment 3, 2018-2029
      Figure 59: Europe VR Game Peripheral Market Forecast (USD Billion), by Others, 2018-2029
      Figure 60: Europe VR Game Peripheral Market Forecast (USD Billion), by U.K., 2018-2029
      Figure 61: Europe VR Game Peripheral Market Forecast (USD Billion), by Germany, 2018-2029
      Figure 62: Europe VR Game Peripheral Market Forecast (USD Billion), by France, 2018-2029
      Figure 63: Europe VR Game Peripheral Market Forecast (USD Billion), by Italy, 2018-2029
      Figure 64: Europe VR Game Peripheral Market Forecast (USD Billion), by Spain, 2018-2029
      Figure 65: Europe VR Game Peripheral Market Forecast (USD Billion), by Russia, 2018-2029
      Figure 66: Europe VR Game Peripheral Market Forecast (USD Billion), by Rest of Europe, 2018-2029
      Figure 67: Asia Pacific VR Game Peripheral Market Value Share (%), By Segment 1, 2022 & 2029
      Figure 68: Asia Pacific VR Game Peripheral Market Forecast (USD Billion), by Sub-Segment 1, 2018-2029
      Figure 69: Asia Pacific VR Game Peripheral Market Forecast (USD Billion), by Sub-Segment 2, 2018-2029
      Figure 70: Asia Pacific VR Game Peripheral Market Value Share (%), By Segment 2, 2022 & 2029
      Figure 71: Asia Pacific VR Game Peripheral Market Forecast (USD Billion), by Sub-Segment 1, 2018-2029
      Figure 72: Asia Pacific VR Game Peripheral Market Forecast (USD Billion), by Sub-Segment 2, 2018-2029
      Figure 73: Asia Pacific VR Game Peripheral Market Forecast (USD Billion), by Sub-Segment 3, 2018-2029
      Figure 74: Asia Pacific VR Game Peripheral Market Forecast (USD Billion), by Others, 2018-2029
      Figure 75: Asia Pacific VR Game Peripheral Market Value Share (%), By Segment 3, 2022 & 2029
      Figure 76: Asia Pacific VR Game Peripheral Market Forecast (USD Billion), by Sub-Segment 1, 2018-2029
      Figure 77: Asia Pacific VR Game Peripheral Market Forecast (USD Billion), by Sub-Segment 2, 2018-2029
      Figure 78: Asia Pacific VR Game Peripheral Market Forecast (USD Billion), by Sub-Segment 3, 2018-2029
      Figure 79: Asia Pacific VR Game Peripheral Market Forecast (USD Billion), by Others, 2018-2029
      Figure 80: Asia Pacific VR Game Peripheral Market Forecast (USD Billion), by China, 2018-2029
      Figure 81: Asia Pacific VR Game Peripheral Market Forecast (USD Billion), by India, 2018-2029
      Figure 82: Asia Pacific VR Game Peripheral Market Forecast (USD Billion), by Japan, 2018-2029
      Figure 83: Asia Pacific VR Game Peripheral Market Forecast (USD Billion), by Australia, 2018-2029
      Figure 84: Asia Pacific VR Game Peripheral Market Forecast (USD Billion), by Southeast Asia, 2018-2029
      Figure 85: Asia Pacific VR Game Peripheral Market Forecast (USD Billion), by Rest of Asia Pacific, 2018-2029
      Figure 86: Middle East & Africa VR Game Peripheral Market Value Share (%), By Segment 1, 2022 & 2029
      Figure 87: Middle East & Africa VR Game Peripheral Market Forecast (USD Billion), by Sub-Segment 1, 2018-2029
      Figure 88: Middle East & Africa VR Game Peripheral Market Forecast (USD Billion), by Sub-Segment 2, 2018-2029
      Figure 89: Middle East & Africa VR Game Peripheral Market Value Share (%), By Segment 2, 2022 & 2029
      Figure 90: Middle East & Africa VR Game Peripheral Market Forecast (USD Billion), by Sub-Segment 1, 2018-2029
      Figure 91: Middle East & Africa VR Game Peripheral Market Forecast (USD Billion), by Sub-Segment 2, 2018-2029
      Figure 92: Middle East & Africa VR Game Peripheral Market Forecast (USD Billion), by Sub-Segment 3, 2018-2029
      Figure 93: Middle East & Africa VR Game Peripheral Market Forecast (USD Billion), by Others, 2018-2029
      Figure 94: Middle East & Africa VR Game Peripheral Market Value Share (%), By Segment 3, 2022 & 2029
      Figure 95: Middle East & Africa VR Game Peripheral Market Forecast (USD Billion), by Sub-Segment 1, 2018-2029
      Figure 96: Middle East & Africa VR Game Peripheral Market Forecast (USD Billion), by Sub-Segment 2, 2018-2029
      Figure 97: Middle East & Africa VR Game Peripheral Market Forecast (USD Billion), by Sub-Segment 3, 2018-2029
      Figure 98: Middle East & Africa VR Game Peripheral Market Forecast (USD Billion), by Others, 2018-2029
      Figure 99: Middle East & Africa VR Game Peripheral Market Forecast (USD Billion), by GCC, 2018-2029
      Figure 100: Middle East & Africa VR Game Peripheral Market Forecast (USD Billion), by South Africa, 2018-2029
      Figure 101: Middle East & Africa VR Game Peripheral Market Forecast (USD Billion), by Rest of Middle East & Africa, 2018-2029 
      List of Tables
      Table 1: Global VR Game Peripheral Market Revenue (USD Billion) Forecast, by Segment 1, 2018-2029
      Table 2: Global VR Game Peripheral Market Revenue (USD Billion) Forecast, by Segment 2, 2018-2029
      Table 3: Global VR Game Peripheral Market Revenue (USD Billion) Forecast, by Segment 3, 2018-2029
      Table 4: Global VR Game Peripheral Market Revenue (USD Billion) Forecast, by Region, 2018-2029
      Table 5: North America VR Game Peripheral Market Revenue (USD Billion) Forecast, by Segment 1, 2018-2029
      Table 6: North America VR Game Peripheral Market Revenue (USD Billion) Forecast, by Segment 2, 2018-2029
      Table 7: North America VR Game Peripheral Market Revenue (USD Billion) Forecast, by Segment 3, 2018-2029
      Table 8: North America VR Game Peripheral Market Revenue (USD Billion) Forecast, by Country, 2018-2029
      Table 9: Europe VR Game Peripheral Market Revenue (USD Billion) Forecast, by Segment 1, 2018-2029
      Table 10: Europe VR Game Peripheral Market Revenue (USD Billion) Forecast, by Segment 2, 2018-2029
      Table 11: Europe VR Game Peripheral Market Revenue (USD Billion) Forecast, by Segment 3, 2018-2029
      Table 12: Europe VR Game Peripheral Market Revenue (USD Billion) Forecast, by Country, 2018-2029
      Table 13: Latin America VR Game Peripheral Market Revenue (USD Billion) Forecast, by Segment 1, 2018-2029
      Table 14: Latin America VR Game Peripheral Market Revenue (USD Billion) Forecast, by Segment 2, 2018-2029
      Table 15: Latin America VR Game Peripheral Market Revenue (USD Billion) Forecast, by Segment 3, 2018-2029
      Table 16: Latin America VR Game Peripheral Market Revenue (USD Billion) Forecast, by Country, 2018-2029
      Table 17: Asia Pacific VR Game Peripheral Market Revenue (USD Billion) Forecast, by Segment 1, 2018-2029
      Table 18: Asia Pacific VR Game Peripheral Market Revenue (USD Billion) Forecast, by Segment 2, 2018-2029
      Table 19: Asia Pacific VR Game Peripheral Market Revenue (USD Billion) Forecast, by Segment 3, 2018-2029
      Table 20: Asia Pacific VR Game Peripheral Market Revenue (USD Billion) Forecast, by Country, 2018-2029
      Table 21: Middle East & Africa VR Game Peripheral Market Revenue (USD Billion) Forecast, by Segment 1, 2018-2029
      Table 22: Middle East & Africa VR Game Peripheral Market Revenue (USD Billion) Forecast, by Segment 2, 2018-2029
      Table 23: Middle East & Africa VR Game Peripheral Market Revenue (USD Billion) Forecast, by Segment 3, 2018-2029
      Table 24: Middle East & Africa VR Game Peripheral Market Revenue (USD Billion) Forecast, by Country, 2018-2029
      Research Process

      Data Library Research are conducted by industry experts who offer insight on industry structure, market segmentations technology assessment and competitive landscape (CL), and penetration, as well as on emerging trends. Their analysis is based on primary interviews (~ 80%) and secondary research (~ 20%) as well as years of professional expertise in their respective industries. Adding to this, by analysing historical trends and current market positions, our analysts predict where the market will be headed for the next five years. Furthermore, the varying trends of segment & categories geographically presented are also studied and the estimated based on the primary & secondary research.

      In this particular report from the supply side Data Library Research has conducted primary surveys (interviews) with the key level executives (VP, CEO’s, Marketing Director, Business Development Manager and SOFT) of the companies that active & prominent as well as the midsized organization

      FIGURE 1: DLR RESEARH PROCESS

      research-methodology1

      Primary Research

      Extensive primary research was conducted to gain a deeper insight of the market and industry performance. The analysis is based on both primary and secondary research as well as years of professional expertise in the respective industries.

      In addition to analysing current and historical trends, our analysts predict where the market is headed over the next five years.

      It varies by segment for these categories geographically presented in the list of market tables. Speaking about this particular report we have conducted primary surveys (interviews) with the key level executives (VP, CEO’s, Marketing Director, Business Development Manager and many more) of the major players active in the market.

      Secondary Research

      Secondary research was mainly used to collect and identify information useful for the extensive, technical, market-oriented, and Friend’s study of the Global Extra Neutral Alcohol. It was also used to obtain key information about major players, market classification and segmentation according to the industry trends, geographical markets, and developments related to the market and technology perspectives. For this study, analysts have gathered information from various credible sources, such as annual reports, sec filings, journals, white papers, SOFT presentations, and company web sites.

      Market Size Estimation

      Both, top-down and bottom-up approaches were used to estimate and validate the size of the Global market and to estimate the size of various other dependent submarkets in the overall Extra Neutral Alcohol. The key players in the market were identified through secondary research and their market contributions in the respective geographies were determined through primary and secondary research.

      Forecast Model

      research-methodology2

      Happy to Assist You

      If you have a question?

      info@datalibraryresearch.com

      IND : +91 955 279 0357

      Browse Related Reports