Zero Waste Shops Market Overview and Analysis

  • The Global Zero Waste Shops Market is expected to reach USD 301.90 billion in 2025 and grow at a CAGR of 9.27% to reach USD 474.87 billion in 2032.

Zero Waste Shops Market

Get Complete Analysis Of The Report - Download Free Sample PDF 

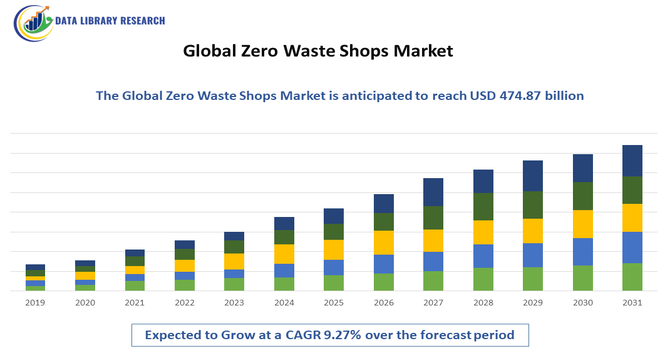
The global zero waste shops market is witnessing robust growth driven by increasing environmental awareness and rising consumer demand for sustainable, plastic-free shopping options as individuals seek to reduce waste and carbon footprints. Growing concerns about the environmental impact of single-use plastics and packaging have encouraged consumers to embrace refill-based, bulk buying, and minimal-packaging retail formats, boosting market expansion. Supportive government policies and waste reduction regulations further reinforce this shift toward sustainability, encouraging retailers to adopt biodegradable, compostable, or reusable packaging solutions and offer eco-friendly products that align with evolving consumer values and global sustainability goals.

Zero Waste Shops Market Latest Trends

The global zero waste shops market is being shaped by a growing consumer shift toward sustainable, plastic-free and waste-minimal shopping habits, with customers increasingly seeking bulk buying, refill stations, and minimal packaging options as part of conscious lifestyle choices. This trend is supported by rising environmental awareness and demand for eco-friendly products across food, personal care, and household categories, encouraging retailers to expand refillable and unpackaged offerings. Additionally, the emergence of online zero waste shops is making sustainable products more accessible to broader audiences, while collaborations with local producers and community education initiatives further strengthen consumer engagement and market growth.

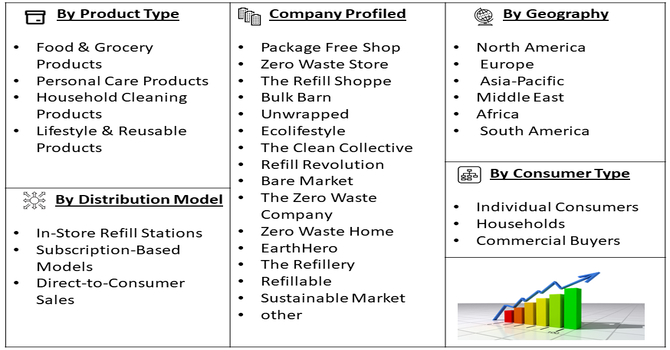
Segmentation: Global Zero Waste Shops Market is segmented By Product Type (Food & Grocery Products, Personal Care Products, Household Cleaning Products, Lifestyle & Reusable Products), By Store Type (Physical Zero Waste Stores and Online Zero Waste Shops), By Packaging Type (Refillable Packaging, Compostable Packaging, Reusable Containers, and Package-Free/Bulk Products), By Consumer Type (Individual Consumers, Households, and Commercial Buyers), By Distribution Model (In-Store Refill Stations, Subscription-Based Models, and Direct-to-Consumer Sales), and Geography (North America, Europe, Asia-Pacific, Middle East and Africa, and South America). The report provides the value (in USD million) for the above segments.

Zero Waste Shops Market Segment

For Detailed Market Segmentation - Get a Free Sample PDF

Market Drivers:

  • Rising Environmental Awareness and Shift Toward Sustainable Consumption

The key drivers of the global zero waste shops market is the growing awareness among consumers regarding environmental degradation, plastic pollution, and climate change. Increasing concerns about landfill waste and the ecological impact of single-use plastics have encouraged individuals to adopt sustainable lifestyles and responsible consumption habits. For instance, Evolving health regulations, including the U.S. FDA’s Preventive Controls Rule and 2024 guidance on reusable containers, have increased compliance requirements for bulk and refill retailers. These measures, while ensuring safety and sanitation, have raised administrative overhead and operational complexity, slowing short-term growth. Despite this, heightened environmental awareness continues to drive demand for sustainable shopping, fueling long-term expansion of the Global Zero Waste Shops Market.

  • Supportive Government Policies and Waste Reduction Regulation

Another significant driver is the implementation of government regulations and policies aimed at reducing waste and promoting sustainable packaging. Many countries have introduced bans on single-use plastics, extended producer responsibility (EPR) policies, and incentives for eco-friendly business models. These regulatory measures encourage retailers and manufacturers to adopt zero waste practices and offer sustainable alternatives. As a result, zero waste shops are gaining institutional support and consumer trust, facilitating market expansion and accelerating the transition toward circular economy-based retail systems.

Market Restraints:

  • Higher Costs and Price Sensitivity Among Consumers

A significant restraint for the zero waste shops market is the relatively higher price points of zero-waste products compared with conventional alternatives, driven by sustainable sourcing, bulk inventory management, and minimal-packaging operations. These elevated costs can deter price-sensitive consumers from adopting zero-waste shopping behaviors broadly, especially in markets where cost remains a key purchasing factor. Many consumers still prioritize convenience and lower prices offered by traditional retail channels, making it challenging for zero-waste shops to achieve widespread mainstream adoption despite growing environmental awareness.

Socioeconomic Impact on Zero Waste Shops Market

The Global Zero Waste Shops Market has substantial socioeconomic impacts by promoting sustainable consumption, reducing environmental pollution, and fostering conscious consumer behavior. These stores encourage the use of reusable, recyclable, and package-free products, minimizing plastic waste and contributing to climate action initiatives. Market growth stimulates employment across retail, supply chain management, and eco-friendly product manufacturing while driving innovation in sustainable packaging and low-waste alternatives. Increased access to zero-waste solutions empowers communities to adopt environmentally responsible lifestyles, supporting public health and resource conservation. Additionally, the market strengthens local economies by promoting small and medium enterprises that focus on sustainable goods.

Segmental Analysis:

  • Food & Grocery Products segment is expected to witness highest growth over the forecast period

Food and grocery products represent a leading segment in zero waste shops, as consumers increasingly prefer package-free staples such as grains, cereals, spices, nuts, and fresh produce. The demand for bulk purchasing of daily essentials reduces packaging waste and aligns with sustainable consumption habits, contributing significantly to overall market value in USD million.

  • Physical Zero Waste Stores segment is expected to witness highest growth over the forecast period

Physical zero waste stores play a crucial role by offering in-store refill stations and interactive shopping experiences that encourage consumers to bring reusable containers. These stores also serve as educational hubs promoting sustainable practices, driving strong customer engagement and revenue generation.

  • Refillable Packaging segment is expected to witness highest growth over the forecast period

Refillable packaging is a dominant segment as it allows repeated use of containers, reducing single-use waste. This approach supports circular economy principles and is widely adopted across food, personal care, and household cleaning product categories. This approach aligns with circular economy principles, encouraging resource efficiency, waste reduction, and product lifecycle extension. Refillable packaging is widely adopted across diverse categories, including food staples, personal care items, and household cleaning products, making it a versatile solution for eco-conscious consumers. Its popularity drives innovation in packaging design and materials, supports sustainable retail practices, and reinforces the overall growth of the global zero waste shops market.

  • Individual Consumers segment is expected to witness highest growth over the forecast period

Individual consumers form the largest customer base, driven by growing environmental awareness and lifestyle changes aimed at reducing household waste. Their consistent preference for sustainable, package-free products drives demand, supports the adoption of zero waste retail formats, and contributes significantly to the overall growth and expansion of the global zero waste shops market.

  • In-Store Refill Stations segment is expected to witness highest growth over the forecast period

In-store refill stations are a core distribution model, enabling customers to purchase exact quantities needed, minimizing waste while enhancing cost efficiency and sustainability. This approach significantly reduces packaging waste and prevents overconsumption, promoting more sustainable shopping habits. By providing refillable options for products like grains, liquids, and personal care items, these stations enhance cost efficiency for both consumers and retailers. They also strengthen customer engagement by encouraging conscious purchasing decisions and raising awareness about environmental impact. The widespread adoption of refill stations supports the growth of zero waste shops, driving sustainability initiatives while fostering a circular economy and responsible consumption practices.

  • Europe region is expected to witness highest growth over the forecast period

Europe is projected to experience the highest growth in the Global Zero Waste Shops Market over the forecast period, driven by strong environmental regulations, increasing consumer awareness, and a well-established culture of sustainability. The region’s emphasis on reducing plastic waste, promoting circular economy practices, and supporting eco-friendly retail initiatives has accelerated adoption of zero waste shopping formats.

In May 2025, TOMRA launched automated collection points for reusable takeaway containers featuring QR-code tracking. This innovative system improved container return rates, achieving an impressive 85% redemption rate in Danish pilot programs. TOMRA’s solution supports circular economy efforts by encouraging reuse, reducing waste, and promoting sustainable consumption habits, thereby advancing zero-waste initiatives globally.

European consumers increasingly prefer refillable, reusable, and package-free products, while governments and organizations actively promote sustainable practices through incentives and awareness campaigns. This combination of regulatory support, consumer demand, and innovative retail solutions positions Europe as a key market opportunity for zero-waste shops globally.

Zero Waste Shops Market Table

To Learn More About This Report - Request a Free Sample Copy

Zero Waste Shops Market Competitive Landscape

The competitive landscape of the global zero waste shops market features a mix of dedicated zero-waste retailers, sustainable lifestyle brands, and eco-focused marketplaces that offer package-free products and refill options to environmentally conscious consumers. These companies are expanding their product ranges, enhancing online presence, and leveraging sustainability credentials to attract customers seeking alternatives to conventional retail. The market’s competitive dynamics are characterized by innovative business models such as bulk refill stations, subscription and direct-to-consumer channels, and curated eco-friendly product assortments, enabling firms to differentiate offerings and build loyal customer bases amid rising demand for sustainable consumption options.

Key Companies in the Market:

  • Package Free Shop
  • Zero Waste Store
  • The Refill Shoppe
  • Bulk Barn
  • Unwrapped
  • Ecolifestyle
  • The Clean Collective
  • Refill Revolution
  • Bare Market
  • The Zero Waste Company
  • Zero Waste Home
  • EarthHero
  • The Refillery
  • Refillable
  • Sustainable Market
  • ZWS Essentials
  • Stasher Bag (brand/store partner)
  • Plaine Products
  • Who Gives A Crap
  • Meow Meow Tweet

Recent News

  • In October 2024, The Source Bulk Foods at Burwood Brickworks expanded its bulk product range to include over 500 zero-packaging items aimed at minimizing household waste. This extensive offering promotes sustainable shopping by enabling customers to buy package-free groceries, supporting environmental goals, reducing plastic waste, and encouraging responsible consumer behavior in everyday food purchasing.


  • In October 2024, Nextuple enhanced its Order Management Studio by integrating AI and machine learning-based order-promising tools tailored for bulk inventory management. These advancements help grocers reduce spoilage and avoid stock-outs by optimizing inventory forecasting and order accuracy. Nextuple’s innovative technology improves supply chain efficiency, supporting sustainable retail practices and minimizing food waste in the zero waste market.


Frequently Asked Questions (FAQ) :

Q1. What are the main growth-driving factors for this market?

The market is growing because consumers are increasingly worried about plastic pollution and climate change. People want to reduce their environmental footprint by choosing products without excess packaging. Additionally, government bans on single-use plastics and the growing popularity of "minimalist" lifestyles are encouraging more shoppers to visit local refill stations and bulk stores.

Q2. What are the main restraining factors for this market?

Growth is limited by the fact that zero-waste shopping often takes more time and effort, as customers must bring their own containers. These shops can also be more expensive than traditional supermarkets due to smaller supply chains. In many areas, a lack of convenient shop locations makes it difficult for busy people to participate.

Q3. Which segment is expected to witness high growth?

The Food & Grocery Products segment is expected to witness the highest growth in the zero waste shops market over the forecast period. Rising consumer preference for sustainable, package-free food items and everyday groceries drives this trend. Refillable and bulk purchasing options reduce single-use packaging, enhance cost efficiency, and support environmentally conscious shopping habits, fueling market expansion.

Q4. Who are the top major players for this market?

The market is made up of independent local boutiques and a few growing regional chains. Key players include The Zero Waste Shop, Lush (for naked packaging), Package Free Shop, and Bulk Barn. Even large retailers like Carrefour and Waitrose are starting to test "refill zones" within their traditional grocery stores.

Q5. Which country is the largest player?

The United Kingdom is currently a leading player in the zero-waste market. It has a very high density of independent refill shops and a strong cultural movement toward plastic-free living. Supportive government policies regarding waste reduction and high public awareness about ocean conservation keep the U.K. at the forefront of this sustainable retail trend.

Zero Waste Shops MARKET STUDY GLOBAL MARKET ANALYSIS, INSIGHTS AND FORECAST, 2022-2029

    1. Introduction

    • 1.1. Research Scope
    • 1.2. Market Segmentation
    • 1.3. Research Methodology
    • 1.4. Definitions and Assumptions

    2. Executive Summary

      3. Market Dynamics

      • 3.1. Market Drivers
      • 3.2. Market Restraints
      • 3.3. Market Opportunities

      4. Key Insights

      • 4.1. Key Emerging Trends – For Major Countries
      • 4.2. Latest Technological Advancement
      • 4.3. Regulatory Landscape
      • 4.4. Industry SWOT Analysis
      • 4.5. Porters Five Forces Analysis

      5. Global Zero Waste Shops Market Analysis (USD Billion), Insights and Forecast, 2018-2029

      • 5.1. Key Findings / Summary
      • 5.2. Market Analysis, Insights and Forecast – By Segment 1
        • 5.2.1. Sub-Segment 1
        • 5.2.2. Sub-Segment 2
      • 5.3. Market Analysis, Insights and Forecast – By Segment 2
        • 5.3.1. Sub-Segment 1
        • 5.3.2. Sub-Segment 2
        • 5.3.3. Sub-Segment 3
        • 5.3.4. Others
      • 5.4. Market Analysis, Insights and Forecast – By Segment 3
        • 5.4.1. Sub-Segment 1
        • 5.4.2. Sub-Segment 2
        • 5.4.3. Sub-Segment 3
        • 5.4.4. Others
      • 5.5. Market Analysis, Insights and Forecast – By Region
        • 5.5.1. North America
        • 5.5.2. Latin America
        • 5.5.3. Europe
        • 5.5.4. Asia Pacific
        • 5.5.5. Middle East and Africa

      6. North America Zero Waste Shops Market Analysis (USD Billion), Insights and Forecast, 2018-2029

      • 6.1. Key Findings / Summary
      • 6.2. Market Analysis, Insights and Forecast – By Segment 1
        • 6.2.1. Sub-Segment 1
        • 6.2.2. Sub-Segment 2
      • 6.3. Market Analysis, Insights and Forecast – By Segment 2
        • 6.3.1. Sub-Segment 1
        • 6.3.2. Sub-Segment 2
        • 6.3.3. Sub-Segment 3
        • 6.3.4. Others
      • 6.4. Market Analysis, Insights and Forecast – By Segment 3
        • 6.4.1. Sub-Segment 1
        • 6.4.2. Sub-Segment 2
        • 6.4.3. Sub-Segment 3
        • 6.4.4. Others
      • 6.5. Market Analysis, Insights and Forecast – By Country
        • 6.5.1. U.S.
        • 6.5.2. Canada

      7. Latin America Zero Waste Shops Market Analysis (USD Billion), Insights and Forecast, 2018-2029

      • 7.1. Key Findings / Summary
      • 7.2. Market Analysis, Insights and Forecast – By Segment 1
        • 7.2.1. Sub-Segment 1
        • 7.2.2. Sub-Segment 2
      • 7.3. Market Analysis, Insights and Forecast – By Segment 2
        • 7.3.1. Sub-Segment 1
        • 7.3.2. Sub-Segment 2
        • 7.3.3. Sub-Segment 3
        • 7.3.4. Others
      • 7.4. Market Analysis, Insights and Forecast – By Segment 3
        • 7.4.1. Sub-Segment 1
        • 7.4.2. Sub-Segment 2
        • 7.4.3. Sub-Segment 3
        • 7.4.4. Others
      • 7.5. Insights and Forecast – By Country
        • 7.5.1. Brazil
        • 7.5.2. Mexico
        • 7.5.3. Rest of Latin America

      8. Europe Zero Waste Shops Market Analysis (USD Billion), Insights and Forecast, 2018-2029

      • 8.1. Key Findings / Summary
      • 8.2. Market Analysis, Insights and Forecast – By Segment 1
        • 8.2.1. Sub-Segment 1
        • 8.2.2. Sub-Segment 2
      • 8.3. Market Analysis, Insights and Forecast – By Segment 2
        • 8.3.1. Sub-Segment 1
        • 8.3.2. Sub-Segment 2
        • 8.3.3. Sub-Segment 3
        • 8.3.4. Others
      • 8.4. Market Analysis, Insights and Forecast – By Segment 3
        • 8.4.1. Sub-Segment 1
        • 8.4.2. Sub-Segment 2
        • 8.4.3. Sub-Segment 3
        • 8.4.4. Others
      • 8.5. Market Analysis, Insights and Forecast – By Country
        • 8.5.1. UK
        • 8.5.2. Germany
        • 8.5.3. France
        • 8.5.4. Italy
        • 8.5.5. Spain
        • 8.5.6. Russia
        • 8.5.7. Rest of Europe

      9. Asia Pacific Zero Waste Shops Market Analysis (USD Billion), Insights and Forecast, 2018-2029

      • 9.1. Key Findings / Summary
      • 9.2. Market Analysis, Insights and Forecast – By Segment 1
        • 9.2.1. Sub-Segment 1
        • 9.2.2. Sub-Segment 2
      • 9.3. Market Analysis, Insights and Forecast – By Segment 2
        • 9.3.1. Sub-Segment 1
        • 9.3.2. Sub-Segment 2
        • 9.3.3. Sub-Segment 3
        • 9.3.4. Others
      • 9.4. Market Analysis, Insights and Forecast – By Segment 3
        • 9.4.1. Sub-Segment 1
        • 9.4.2. Sub-Segment 2
        • 9.4.3. Sub-Segment 3
        • 9.4.4. Others
      • 9.5. Market Analysis, Insights and Forecast – By Country
        • 9.5.1. China
        • 9.5.2. India
        • 9.5.3. Japan
        • 9.5.4. Australia
        • 9.5.5. South East Asia
        • 9.5.6. Rest of Asia Pacific

      10. Middle East & Africa Zero Waste Shops Market Analysis (USD Billion), Insights and Forecast, 2018-2029

      • 10.1. Key Findings / Summary
      • 10.2. Market Analysis, Insights and Forecast – By Segment 1
        • 10.2.1. Sub-Segment 1
        • 10.2.2. Sub-Segment 2
      • 10.3. Market Analysis, Insights and Forecast – By Segment 2
        • 10.3.1. Sub-Segment 1
        • 10.3.2. Sub-Segment 2
        • 10.3.3. Sub-Segment 3
        • 10.3.4. Others
      • 10.4. Market Analysis, Insights and Forecast – By Segment 3
        • 10.4.1. Sub-Segment 1
        • 10.4.2. Sub-Segment 2
        • 10.4.3. Sub-Segment 3
        • 10.4.4. Others
      • 10.5. Market Analysis, Insights and Forecast – By Country
        • 10.5.1. GCC
        • 10.5.2. South Africa
        • 10.5.3. Rest of Middle East & Africa

      11. Competitive Analysis

      • 11.1. Company Market Share Analysis, 2018
      • 11.2. Key Industry Developments
      • 11.3. Company Profile
        • 11.3.1. Company 1
          • 11.3.1.1. Business Overview
          • 11.3.1.2. Segment 1 & Service Offering
          • 11.3.1.3. Overall Revenue
          • 11.3.1.4. Geographic Presence
          • 11.3.1.5. Recent Development
        *Similar details will be provided for the following companies
        • 11.3.2. Company 2
        • 11.3.3. Company 3
        • 11.3.4. Company 4
        • 11.3.5. Company 5
        • 11.3.6. Company 6
        • 11.3.7. Company 7
        • 11.3.8. Company 8
        • 11.3.9. Company 9
        • 11.3.10. Company 10
        • 11.3.11. Company 11
        • 11.3.12. Company 12
      List of Figures

      Figure 1: Global Zero Waste Shops Market Revenue Breakdown (USD Billion, %) by Region, 2022 & 2029
      Figure 2: Global Zero Waste Shops Market Value Share (%), By Segment 1, 2022 & 2029
      Figure 3: Global Zero Waste Shops Market Forecast (USD Billion), by Sub-Segment 1, 2018-2029
      Figure 4: Global Zero Waste Shops Market Forecast (USD Billion), by Sub-Segment 2, 2018-2029
      Figure 5: Global Zero Waste Shops Market Value Share (%), By Segment 2, 2022 & 2029
      Figure 6: Global Zero Waste Shops Market Forecast (USD Billion), by Sub-Segment 1, 2018-2029
      Figure 7: Global Zero Waste Shops Market Forecast (USD Billion), by Sub-Segment 2, 2018-2029
      Figure 8: Global Zero Waste Shops Market Forecast (USD Billion), by Sub-Segment 3, 2018-2029
      Figure 9: Global Zero Waste Shops Market Forecast (USD Billion), by Others, 2018-2029
      Figure 10: Global Zero Waste Shops Market Value Share (%), By Segment 3, 2022 & 2029
      Figure 11: Global Zero Waste Shops Market Forecast (USD Billion), by Sub-Segment 1, 2018-2029
      Figure 12: Global Zero Waste Shops Market Forecast (USD Billion), by Sub-Segment 2, 2018-2029
      Figure 13: Global Zero Waste Shops Market Forecast (USD Billion), by Sub-Segment 3, 2018-2029
      Figure 14: Global Zero Waste Shops Market Forecast (USD Billion), by Others, 2018-2029
      Figure 15: Global Zero Waste Shops Market Value (USD Billion), by Region, 2022 & 2029
      Figure 16: North America Zero Waste Shops Market Value Share (%), By Segment 1, 2022 & 2029
      Figure 17: North America Zero Waste Shops Market Forecast (USD Billion), by Sub-Segment 1, 2018-2029
      Figure 18: North America Zero Waste Shops Market Forecast (USD Billion), by Sub-Segment 2, 2018-2029
      Figure 19: North America Zero Waste Shops Market Value Share (%), By Segment 2, 2022 & 2029
      Figure 20: North America Zero Waste Shops Market Forecast (USD Billion), by Sub-Segment 1, 2018-2029
      Figure 21: North America Zero Waste Shops Market Forecast (USD Billion), by Sub-Segment 2, 2018-2029
      Figure 22: North America Zero Waste Shops Market Forecast (USD Billion), by Sub-Segment 3, 2018-2029
      Figure 23: North America Zero Waste Shops Market Forecast (USD Billion), by Others, 2018-2029
      Figure 24: North America Zero Waste Shops Market Value Share (%), By Segment 3, 2022 & 2029
      Figure 25: North America Zero Waste Shops Market Forecast (USD Billion), by Sub-Segment 1, 2018-2029
      Figure 26: North America Zero Waste Shops Market Forecast (USD Billion), by Sub-Segment 2, 2018-2029
      Figure 27: North America Zero Waste Shops Market Forecast (USD Billion), by Sub-Segment 3, 2018-2029
      Figure 28: North America Zero Waste Shops Market Forecast (USD Billion), by Others, 2018-2029
      Figure 29: North America Zero Waste Shops Market Forecast (USD Billion), by U.S., 2018-2029
      Figure 30: North America Zero Waste Shops Market Forecast (USD Billion), by Canada, 2018-2029
      Figure 31: Latin America Zero Waste Shops Market Value Share (%), By Segment 1, 2022 & 2029
      Figure 32: Latin America Zero Waste Shops Market Forecast (USD Billion), by Sub-Segment 1, 2018-2029
      Figure 33: Latin America Zero Waste Shops Market Forecast (USD Billion), by Sub-Segment 2, 2018-2029
      Figure 34: Latin America Zero Waste Shops Market Value Share (%), By Segment 2, 2022 & 2029
      Figure 35: Latin America Zero Waste Shops Market Forecast (USD Billion), by Sub-Segment 1, 2018-2029
      Figure 36: Latin America Zero Waste Shops Market Forecast (USD Billion), by Sub-Segment 2, 2018-2029
      Figure 37: Latin America Zero Waste Shops Market Forecast (USD Billion), by Sub-Segment 3, 2018-2029
      Figure 38: Latin America Zero Waste Shops Market Forecast (USD Billion), by Others, 2018-2029
      Figure 39: Latin America Zero Waste Shops Market Value Share (%), By Segment 3, 2022 & 2029
      Figure 40: Latin America Zero Waste Shops Market Forecast (USD Billion), by Sub-Segment 1, 2018-2029
      Figure 41: Latin America Zero Waste Shops Market Forecast (USD Billion), by Sub-Segment 2, 2018-2029
      Figure 42: Latin America Zero Waste Shops Market Forecast (USD Billion), by Sub-Segment 3, 2018-2029
      Figure 43: Latin America Zero Waste Shops Market Forecast (USD Billion), by Others, 2018-2029
      Figure 44: Latin America Zero Waste Shops Market Forecast (USD Billion), by Brazil, 2018-2029
      Figure 45: Latin America Zero Waste Shops Market Forecast (USD Billion), by Mexico, 2018-2029
      Figure 46: Latin America Zero Waste Shops Market Forecast (USD Billion), by Rest of Latin America, 2018-2029
      Figure 47: Europe Zero Waste Shops Market Value Share (%), By Segment 1, 2022 & 2029
      Figure 48: Europe Zero Waste Shops Market Forecast (USD Billion), by Sub-Segment 1, 2018-2029
      Figure 49: Europe Zero Waste Shops Market Forecast (USD Billion), by Sub-Segment 2, 2018-2029
      Figure 50: Europe Zero Waste Shops Market Value Share (%), By Segment 2, 2022 & 2029
      Figure 51: Europe Zero Waste Shops Market Forecast (USD Billion), by Sub-Segment 1, 2018-2029
      Figure 52: Europe Zero Waste Shops Market Forecast (USD Billion), by Sub-Segment 2, 2018-2029
      Figure 53: Europe Zero Waste Shops Market Forecast (USD Billion), by Sub-Segment 3, 2018-2029
      Figure 54: Europe Zero Waste Shops Market Forecast (USD Billion), by Others, 2018-2029
      Figure 55: Europe Zero Waste Shops Market Value Share (%), By Segment 3, 2022 & 2029
      Figure 56: Europe Zero Waste Shops Market Forecast (USD Billion), by Sub-Segment 1, 2018-2029
      Figure 57: Europe Zero Waste Shops Market Forecast (USD Billion), by Sub-Segment 2, 2018-2029
      Figure 58: Europe Zero Waste Shops Market Forecast (USD Billion), by Sub-Segment 3, 2018-2029
      Figure 59: Europe Zero Waste Shops Market Forecast (USD Billion), by Others, 2018-2029
      Figure 60: Europe Zero Waste Shops Market Forecast (USD Billion), by U.K., 2018-2029
      Figure 61: Europe Zero Waste Shops Market Forecast (USD Billion), by Germany, 2018-2029
      Figure 62: Europe Zero Waste Shops Market Forecast (USD Billion), by France, 2018-2029
      Figure 63: Europe Zero Waste Shops Market Forecast (USD Billion), by Italy, 2018-2029
      Figure 64: Europe Zero Waste Shops Market Forecast (USD Billion), by Spain, 2018-2029
      Figure 65: Europe Zero Waste Shops Market Forecast (USD Billion), by Russia, 2018-2029
      Figure 66: Europe Zero Waste Shops Market Forecast (USD Billion), by Rest of Europe, 2018-2029
      Figure 67: Asia Pacific Zero Waste Shops Market Value Share (%), By Segment 1, 2022 & 2029
      Figure 68: Asia Pacific Zero Waste Shops Market Forecast (USD Billion), by Sub-Segment 1, 2018-2029
      Figure 69: Asia Pacific Zero Waste Shops Market Forecast (USD Billion), by Sub-Segment 2, 2018-2029
      Figure 70: Asia Pacific Zero Waste Shops Market Value Share (%), By Segment 2, 2022 & 2029
      Figure 71: Asia Pacific Zero Waste Shops Market Forecast (USD Billion), by Sub-Segment 1, 2018-2029
      Figure 72: Asia Pacific Zero Waste Shops Market Forecast (USD Billion), by Sub-Segment 2, 2018-2029
      Figure 73: Asia Pacific Zero Waste Shops Market Forecast (USD Billion), by Sub-Segment 3, 2018-2029
      Figure 74: Asia Pacific Zero Waste Shops Market Forecast (USD Billion), by Others, 2018-2029
      Figure 75: Asia Pacific Zero Waste Shops Market Value Share (%), By Segment 3, 2022 & 2029
      Figure 76: Asia Pacific Zero Waste Shops Market Forecast (USD Billion), by Sub-Segment 1, 2018-2029
      Figure 77: Asia Pacific Zero Waste Shops Market Forecast (USD Billion), by Sub-Segment 2, 2018-2029
      Figure 78: Asia Pacific Zero Waste Shops Market Forecast (USD Billion), by Sub-Segment 3, 2018-2029
      Figure 79: Asia Pacific Zero Waste Shops Market Forecast (USD Billion), by Others, 2018-2029
      Figure 80: Asia Pacific Zero Waste Shops Market Forecast (USD Billion), by China, 2018-2029
      Figure 81: Asia Pacific Zero Waste Shops Market Forecast (USD Billion), by India, 2018-2029
      Figure 82: Asia Pacific Zero Waste Shops Market Forecast (USD Billion), by Japan, 2018-2029
      Figure 83: Asia Pacific Zero Waste Shops Market Forecast (USD Billion), by Australia, 2018-2029
      Figure 84: Asia Pacific Zero Waste Shops Market Forecast (USD Billion), by Southeast Asia, 2018-2029
      Figure 85: Asia Pacific Zero Waste Shops Market Forecast (USD Billion), by Rest of Asia Pacific, 2018-2029
      Figure 86: Middle East & Africa Zero Waste Shops Market Value Share (%), By Segment 1, 2022 & 2029
      Figure 87: Middle East & Africa Zero Waste Shops Market Forecast (USD Billion), by Sub-Segment 1, 2018-2029
      Figure 88: Middle East & Africa Zero Waste Shops Market Forecast (USD Billion), by Sub-Segment 2, 2018-2029
      Figure 89: Middle East & Africa Zero Waste Shops Market Value Share (%), By Segment 2, 2022 & 2029
      Figure 90: Middle East & Africa Zero Waste Shops Market Forecast (USD Billion), by Sub-Segment 1, 2018-2029
      Figure 91: Middle East & Africa Zero Waste Shops Market Forecast (USD Billion), by Sub-Segment 2, 2018-2029
      Figure 92: Middle East & Africa Zero Waste Shops Market Forecast (USD Billion), by Sub-Segment 3, 2018-2029
      Figure 93: Middle East & Africa Zero Waste Shops Market Forecast (USD Billion), by Others, 2018-2029
      Figure 94: Middle East & Africa Zero Waste Shops Market Value Share (%), By Segment 3, 2022 & 2029
      Figure 95: Middle East & Africa Zero Waste Shops Market Forecast (USD Billion), by Sub-Segment 1, 2018-2029
      Figure 96: Middle East & Africa Zero Waste Shops Market Forecast (USD Billion), by Sub-Segment 2, 2018-2029
      Figure 97: Middle East & Africa Zero Waste Shops Market Forecast (USD Billion), by Sub-Segment 3, 2018-2029
      Figure 98: Middle East & Africa Zero Waste Shops Market Forecast (USD Billion), by Others, 2018-2029
      Figure 99: Middle East & Africa Zero Waste Shops Market Forecast (USD Billion), by GCC, 2018-2029
      Figure 100: Middle East & Africa Zero Waste Shops Market Forecast (USD Billion), by South Africa, 2018-2029
      Figure 101: Middle East & Africa Zero Waste Shops Market Forecast (USD Billion), by Rest of Middle East & Africa, 2018-2029 
      List of Tables
      Table 1: Global Zero Waste Shops Market Revenue (USD Billion) Forecast, by Segment 1, 2018-2029
      Table 2: Global Zero Waste Shops Market Revenue (USD Billion) Forecast, by Segment 2, 2018-2029
      Table 3: Global Zero Waste Shops Market Revenue (USD Billion) Forecast, by Segment 3, 2018-2029
      Table 4: Global Zero Waste Shops Market Revenue (USD Billion) Forecast, by Region, 2018-2029
      Table 5: North America Zero Waste Shops Market Revenue (USD Billion) Forecast, by Segment 1, 2018-2029
      Table 6: North America Zero Waste Shops Market Revenue (USD Billion) Forecast, by Segment 2, 2018-2029
      Table 7: North America Zero Waste Shops Market Revenue (USD Billion) Forecast, by Segment 3, 2018-2029
      Table 8: North America Zero Waste Shops Market Revenue (USD Billion) Forecast, by Country, 2018-2029
      Table 9: Europe Zero Waste Shops Market Revenue (USD Billion) Forecast, by Segment 1, 2018-2029
      Table 10: Europe Zero Waste Shops Market Revenue (USD Billion) Forecast, by Segment 2, 2018-2029
      Table 11: Europe Zero Waste Shops Market Revenue (USD Billion) Forecast, by Segment 3, 2018-2029
      Table 12: Europe Zero Waste Shops Market Revenue (USD Billion) Forecast, by Country, 2018-2029
      Table 13: Latin America Zero Waste Shops Market Revenue (USD Billion) Forecast, by Segment 1, 2018-2029
      Table 14: Latin America Zero Waste Shops Market Revenue (USD Billion) Forecast, by Segment 2, 2018-2029
      Table 15: Latin America Zero Waste Shops Market Revenue (USD Billion) Forecast, by Segment 3, 2018-2029
      Table 16: Latin America Zero Waste Shops Market Revenue (USD Billion) Forecast, by Country, 2018-2029
      Table 17: Asia Pacific Zero Waste Shops Market Revenue (USD Billion) Forecast, by Segment 1, 2018-2029
      Table 18: Asia Pacific Zero Waste Shops Market Revenue (USD Billion) Forecast, by Segment 2, 2018-2029
      Table 19: Asia Pacific Zero Waste Shops Market Revenue (USD Billion) Forecast, by Segment 3, 2018-2029
      Table 20: Asia Pacific Zero Waste Shops Market Revenue (USD Billion) Forecast, by Country, 2018-2029
      Table 21: Middle East & Africa Zero Waste Shops Market Revenue (USD Billion) Forecast, by Segment 1, 2018-2029
      Table 22: Middle East & Africa Zero Waste Shops Market Revenue (USD Billion) Forecast, by Segment 2, 2018-2029
      Table 23: Middle East & Africa Zero Waste Shops Market Revenue (USD Billion) Forecast, by Segment 3, 2018-2029
      Table 24: Middle East & Africa Zero Waste Shops Market Revenue (USD Billion) Forecast, by Country, 2018-2029
      Research Process

      Data Library Research are conducted by industry experts who offer insight on industry structure, market segmentations technology assessment and competitive landscape (CL), and penetration, as well as on emerging trends. Their analysis is based on primary interviews (~ 80%) and secondary research (~ 20%) as well as years of professional expertise in their respective industries. Adding to this, by analysing historical trends and current market positions, our analysts predict where the market will be headed for the next five years. Furthermore, the varying trends of segment & categories geographically presented are also studied and the estimated based on the primary & secondary research.

      In this particular report from the supply side Data Library Research has conducted primary surveys (interviews) with the key level executives (VP, CEO’s, Marketing Director, Business Development Manager and SOFT) of the companies that active & prominent as well as the midsized organization

      FIGURE 1: DLR RESEARH PROCESS

      research-methodology1

      Primary Research

      Extensive primary research was conducted to gain a deeper insight of the market and industry performance. The analysis is based on both primary and secondary research as well as years of professional expertise in the respective industries.

      In addition to analysing current and historical trends, our analysts predict where the market is headed over the next five years.

      It varies by segment for these categories geographically presented in the list of market tables. Speaking about this particular report we have conducted primary surveys (interviews) with the key level executives (VP, CEO’s, Marketing Director, Business Development Manager and many more) of the major players active in the market.

      Secondary Research

      Secondary research was mainly used to collect and identify information useful for the extensive, technical, market-oriented, and Friend’s study of the Global Extra Neutral Alcohol. It was also used to obtain key information about major players, market classification and segmentation according to the industry trends, geographical markets, and developments related to the market and technology perspectives. For this study, analysts have gathered information from various credible sources, such as annual reports, sec filings, journals, white papers, SOFT presentations, and company web sites.

      Market Size Estimation

      Both, top-down and bottom-up approaches were used to estimate and validate the size of the Global market and to estimate the size of various other dependent submarkets in the overall Extra Neutral Alcohol. The key players in the market were identified through secondary research and their market contributions in the respective geographies were determined through primary and secondary research.

      Forecast Model

      research-methodology2