Parametric Insurance Market Overview and Analysis

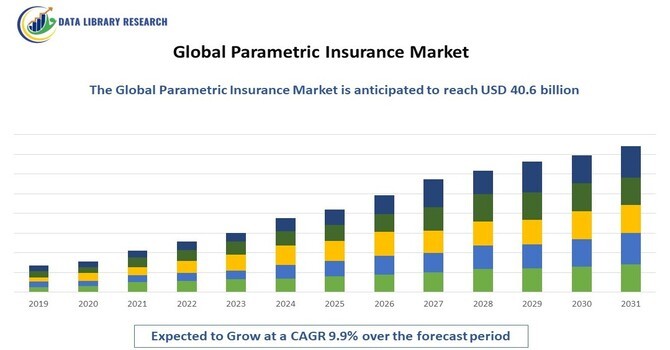
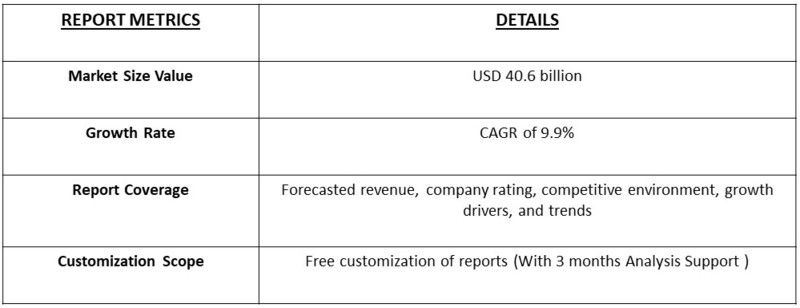
The global parametric insurance market was valued at approximately $15.8 billion in 2023 and is projected to reach $40.6 billion by 2033, growing at a compound annual growth rate (CAGR) of 9.9% over the forecast period.

The parametric insurance market provides coverage based on predefined triggers or parameters, such as specific weather conditions, natural disasters, or other measurable events, rather than traditional claims assessments. This type of insurance is gaining popularity in industries like agriculture, energy, and tourism due to its ability to offer rapid payouts and reduce administrative costs. Unlike conventional policies, parametric insurance uses data-driven indexes to determine compensation, making it highly efficient for scenarios involving climate risk and disaster recovery. The market's growth is fueled by increasing demand for faster, automated payout mechanisms and the rising frequency of catastrophic events.

One of the key drivers of the parametric insurance market is the increasing frequency and severity of natural disasters and climate-related events. These incidents have made traditional insurance models less efficient due to lengthy claim processes, prompting a shift towards parametric insurance for faster payouts. Additionally, technological advancements in data collection, such as satellite monitoring and IoT devices, enable precise measurement of triggers, enhancing the reliability of parametric models. The growing demand from sectors like agriculture, energy, and tourism, which face high exposure to climate risks, also supports market expansion. As businesses seek quicker financial recovery and operational resilience, the adoption of parametric insurance continues to accelerate.

Parametric Insurance Market Trends

The parametric insurance market include the growing use of advanced technologies like satellite imaging, AI, and blockchain to enhance data accuracy and streamline the claims process. These innovations enable insurers to offer more customizable, real-time policies with faster payouts. The market is also seeing increased demand from sectors like agriculture, construction, and energy, where climate risks are rising. Additionally, partnerships between insurers and technology firms are expanding to improve risk modeling and trigger mechanisms. As climate-related disasters intensify globally, the demand for parametric insurance is expected to continue growing, particularly in regions with high exposure to natural catastrophes.

Market Segmentation

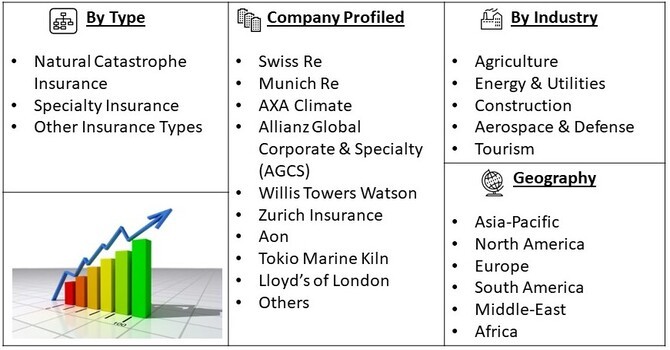
The Global parametric insurance market is segmented by type (Natural Catastrophe Insurance, Specialty Insurance, Other Insurance Types) By Industry Vertical (Agriculture, Energy & Utilities, Construction, Aerospace & Defense, Tourism) and geography (Asia-Pacific, North America, Europe, South America, and Middle-East and Africa). The report offers the market size and forecasts for revenue (USD million) for all the above segments.

Market Drivers

  • Increasing Climate-Related Risks

The rising frequency and severity of climate-related events, such as floods, hurricanes, and wildfires, are major drivers for the parametric insurance market. According to real-time data, 2023 saw record-breaking heat waves and natural disasters, particularly in regions like North America and Asia-Pacific, pushing businesses and governments to seek quicker and more reliable payout solutions. Traditional insurance models, which often involve lengthy claims processes, have been inadequate in addressing the urgent needs of affected regions. Parametric insurance, with its predefined triggers and faster payouts, is becoming the preferred choice for industries like agriculture and energy that are heavily impacted by climate change. As governments push for greater climate resilience, especially in vulnerable areas, the demand for parametric insurance will continue to grow.

  • Technological Advancements in Data Collection

Advances in data collection technologies, such as satellite imaging, IoT sensors, and artificial intelligence, are accelerating the growth of the parametric insurance market. These technologies enable real-time monitoring of triggers like weather conditions, commodity prices, and seismic activity, allowing for highly accurate and transparent risk assessments. For instance, companies in the renewable energy sector are increasingly using parametric insurance to hedge against risks related to fluctuating wind speeds or solar irradiance. The use of these advanced technologies is also driving the adoption of parametric solutions across sectors such as agriculture, where precision data on rainfall or drought can determine rapid payouts. This has been particularly relevant in 2023, as technology-driven insurance models help reduce uncertainty and increase trust among policyholders.

Market Restraints

One of the major restraints for the parametric insurance market is the high cost of premiums, which can deter potential clients, especially in emerging markets. Parametric policies require substantial investment in advanced technologies such as satellite imaging and real-time data monitoring, which increases the overall cost of the insurance product. Furthermore, despite the clear benefits, there is still limited awareness and understanding of parametric insurance in certain industries and regions. For instance, small and medium-sized enterprises (SMEs) in Latin America and Africa often lack the financial resources and technical expertise to adopt these insurance solutions, which hampers market penetration. Additionally, regulatory frameworks in many regions are not yet fully adapted to support the rapid adoption of parametric insurance, further slowing down its growth.

COVID-19 Impact On Parametric Insurance Market

The COVID-19 pandemic had a mixed impact on the parametric insurance market. On one hand, it slowed down the adoption of new policies in sectors like travel and tourism, which were heavily affected by the lockdowns and economic downturns. On the other hand, the pandemic highlighted the need for faster and more efficient insurance solutions, driving increased interest in parametric insurance for industries like agriculture and energy. The need for rapid financial recovery from pandemic-related disruptions prompted companies to explore parametric solutions, which offer quicker payouts compared to traditional models. The shift towards digitalization during the pandemic also accelerated the use of advanced technologies in parametric insurance, further boosting its appeal post-COVID.

Segmental Analysis

  • Agriculture Insurance Segment is Expected to Witness Significant Growth Over the Forecast Period

The agriculture insurance sub-segment in the parametric insurance market is seeing significant growth due to the increasing frequency of climate-related events like droughts, floods, and extreme temperatures. Real-time insights from 2023 show that many countries, especially in Asia-Pacific and Latin America, have faced crop failures due to unpredictable weather patterns, prompting farmers and governments to seek faster recovery solutions through parametric insurance. For instance, in India and Kenya, parametric policies tied to rainfall indexes have provided rapid payouts, helping farmers manage the risk of drought. The driving factors for this sub-segment include the rising need for food security, the impact of climate change on farming, and government initiatives to promote crop insurance. Technological advancements like satellite monitoring and IoT-enabled weather stations are also enhancing the accuracy and reliability of these parametric policies, making them more appealing to the agricultural sector.

  • Energy & Utilities Insurance Segment is Expected to Witness Significant Growth Over the Forecast Period

Energy and utilities companies are increasingly adopting parametric insurance to mitigate risks associated with weather fluctuations that affect renewable energy generation, such as solar and wind. In 2023, several European renewable energy firms used parametric solutions to hedge against reduced energy output caused by lower-than-expected wind speeds. The demand in this sub-segment is driven by the global shift towards renewable energy and the increasing volatility in weather patterns due to climate change. Additionally, governments' focus on sustainable energy policies has led to a surge in renewable energy projects, amplifying the need for insurance products that can provide quick payouts based on weather-related triggers. The energy and utilities sector is also benefiting from technological advancements in weather forecasting and data analytics, which are improving the accuracy of parametric insurance models, making them a vital tool for managing operational risks.

  • Asia Pacific Region is Expected to Witness Significant Growth Over the Forecast Period

The Asia-Pacific region is projected to witness significant growth in the parametric insurance market over the forecast period due to several factors. The region's high exposure to climate risks such as typhoons, floods, and earthquakes makes parametric insurance an attractive solution for faster recovery from natural disasters. Countries like China, Japan, India, and the Philippines are particularly vulnerable, and governments and businesses are increasingly adopting parametric insurance to mitigate these risks. The agricultural sector, a major contributor to the region’s economy, is also driving demand, as farmers look for ways to hedge against unpredictable weather patterns. Furthermore, advancements in satellite and data analytics technologies are making parametric insurance more accessible and reliable across the region. The Asia-Pacific market is expected to expand as insurers and technology firms collaborate to offer tailored products that meet the region’s unique needs.

Parametric Insurance Market Competitive Landscape

The competitive landscape of the parametric insurance market is becoming increasingly dynamic as key players invest in technological innovations and expand their product portfolios. Leading insurers are focusing on developing data-driven solutions to enhance the accuracy and reliability of their parametric offerings.

Major players in this market include

  • Swiss Re
  • Munich Re
  • AXA Climate
  • Allianz Global Corporate & Specialty (AGCS)
  • Willis Towers Watson
  • Zurich Insurance
  • Aon
  • Tokio Marine Kiln
  • Lloyd’s of London

Recent Development

  • In 2023, AXA Climate introduced a new parametric insurance product specifically designed to cover drought risks for farmers. This product uses satellite data to monitor rainfall and soil moisture levels, providing automatic payouts when predefined drought conditions are met. The solution was tailored to meet the needs of farmers in regions like sub-Saharan Africa and parts of Asia, where traditional insurance models have struggled to provide timely financial relief. The offering highlights AXA Climate’s commitment to integrating advanced technology to support sustainable agriculture while mitigating climate risks.
  • In early 2024, Swiss Re announced a partnership with agri-tech firm CropX to enhance its parametric insurance solutions in the agricultural sector. The collaboration leverages CropX's soil sensors and data analytics to improve the precision of parametric triggers, allowing for more accurate measurements of droughts and other weather conditions affecting crop yields. This development is aimed at expanding Swiss Re’s footprint in emerging markets, particularly in Asia and Latin America, where climate variability is a growing concern for the agriculture industry. The partnership underscores Swiss Re’s focus on innovation and data-driven insurance products in the face of rising climate risks.


Frequently Asked Questions (FAQ) :

Q1. What are the driving factors for the Global Parametric Insurance Market?

The global parametric insurance market is primarily driven by the increasing need for faster and more efficient claims processing. Traditional insurance models often involve lengthy assessments and negotiations, whereas parametric insurance pays out predefined amounts based on specific triggering events, such as natural disasters or weather conditions. This quick payout mechanism is appealing to businesses and individuals seeking immediate financial relief after an event. Additionally, the rising frequency and severity of climate-related disasters are prompting more organizations to seek innovative risk management solutions. The growing awareness of parametric insurance products among businesses, especially in agriculture, travel, and energy sectors, is further boosting market demand. As technology advances, the integration of big data and analytics is enhancing the precision of risk assessment and product offerings, making parametric insurance an increasingly attractive option.

Q2. What are the restraining factors for the Global Parametric Insurance market?

Despite its potential, the global parametric insurance market faces several restraining factors. One significant challenge is the limited understanding of parametric insurance products among consumers and businesses, leading to hesitancy in adoption. Many potential clients may prefer traditional insurance models due to their familiarity, even if parametric options offer faster payouts. Additionally, the market's reliance on accurate data for trigger events can create issues in terms of transparency and reliability. Inadequate data availability or inaccuracies can lead to disputes over payouts, undermining trust in the product. Regulatory challenges and varying acceptance across different jurisdictions can also pose hurdles for market growth. Lastly, competition from traditional insurance products, which may be perceived as more comprehensive, can limit the expansion of parametric insurance solutions.

Q3. Which segment is projected to hold the largest share of the Global Parametric Insurance market?

The agriculture segment is projected to hold the largest share of the global parametric insurance market. This is primarily due to the sector's vulnerability to climate risks, such as droughts, floods, and extreme weather conditions. Parametric insurance provides farmers with a safety net by offering payouts based on predefined weather indices, ensuring they receive timely financial support when adverse conditions occur. As agricultural practices become increasingly reliant on technology and data analytics, the accuracy and reliability of parametric insurance products in assessing risks are improving, further encouraging adoption. Moreover, governments and organizations are increasingly promoting parametric insurance solutions as a way to stabilize rural economies and support sustainable agricultural practices. This strong alignment with the agricultural sector's needs positions it as a key driver of growth in the parametric insurance market.

Q4. Which region holds the largest share of the Global Parametric Insurance market?

North America is expected to hold the largest share of the global parametric insurance market. The region benefits from a well-developed insurance infrastructure and a high level of awareness regarding innovative insurance solutions. The increasing frequency of natural disasters, such as hurricanes and wildfires, has heightened demand for parametric insurance as a quick and efficient risk management tool. Additionally, the presence of leading insurance companies and startups focusing on parametric products fosters a competitive environment that encourages innovation and market expansion. The agricultural sector in the U.S. and Canada also contributes significantly to the region's parametric insurance market, as farmers seek solutions to mitigate climate-related risks. With ongoing advancements in technology and data analytics, North America is well-positioned to maintain its dominance in the parametric insurance landscape.

Q5. Which are the prominent players in the Global Parametric Insurance market?

The global parametric insurance market features several prominent players known for their innovative approaches and market leadership. Swiss Re is a key player, offering a range of parametric insurance products tailored to various sectors, including agriculture and natural disaster coverage. Aon and Marsh & McLennan are also significant players, providing consulting and risk management services that incorporate parametric solutions for businesses. AXA and Zurich Insurance Group are recognized for their commitment to integrating parametric insurance into their product offerings, particularly in response to climate risks. Additionally, insurtech companies like Haven Life and Zego are disrupting the market with digital-first parametric solutions, appealing to a tech-savvy clientele. Through strategic partnerships and a focus on customer-centric products, these key players are shaping the future of the parametric insurance market.

TABLE OF CONTENTS

    1. EXECUTIVE SUMMARY

    • 1.1. Market Overview
    • 1.2. Key Findings
    • 1.3. Market Segmentation
    • 1.4. Competitive Landscape
    • 1.5. Challenges and Opportunities
    • 1.6. Future Outlook

    2. MARKET INTRODUCTION

    • 2.1. Definition
    • 2.2. Scope of the study
      • 2.2.1. Research Objective
      • 2.2.2. Assumption
      • 2.2.3. Limitations

    3. RESEARCH METHODOLOGY

    • 3.1. Overview
    • 3.2. Data Mining
    • 3.3. Secondary Research
    • 3.4. Primary Research
      • 3.4.1. Primary Interviews and Information Gathering Process
      • 3.4.2. Breakdown of Primary Respondents
    • 3.5. Forecasting Model
    • 3.6. Market Size Estimation
      • 3.6.1. Bottom-Up Approach
      • 3.6.2. Top-Down Approach
    • 3.7. Data Triangulation
    • 3.8. Validation

    4. MARKET DYNAMICS

    • 4.1. Overview
    • 4.2. Drivers
    • 4.3. Restraints
    • 4.4. Opportunities

    5. MARKET FACTOR ANALYSIS

    • 5.1. Value chain Analysis
    • 5.2. Porter's Five Forces Analysis
      • 5.2.1. Bargaining Power of Suppliers
      • 5.2.2. Bargaining Power of Buyers
      • 5.2.3. Threat of New Entrants
      • 5.2.4. Threat of Substitutes
      • 5.2.5. Intensity of Rivalry
    • 5.3. COVID-19 Impact Analysis
      • 5.3.1. Market Impact Analysis
      • 5.3.2. Regional Impact
      • 5.3.3. Opportunity and Threat Analysis

    6. PARAMETRIC INSURANCE MARKET, BY INSURANCE TYPE (USD BILLION)

    • 6.1. Index-Based Insurance
    • 6.2. Weather-Based Insurance
    • 6.3. Catastrophe Bonds
    • 6.4. Other Parametric Insurance Types

    7. PARAMETRIC INSURANCE MARKET, BY APPLICATION (USD BILLION)

    • 7.1. Agriculture
    • 7.2. Property and Casualty
    • 7.3. Energy
    • 7.4. Other Applications

    8. PARAMETRIC INSURANCE MARKET, BY DEPLOYMENT MODEL (USD BILLION)

    • 8.1. Cloud-Based
    • 8.2. On-Premise
    • 8.3. Hybrid

    9. PARAMETRIC INSURANCE MARKET, BY USE CASE (USD BILLION)

    • 9.1. Risk Mitigation
    • 9.2. Index Tracking
    • 9.3. Catastrophe Response
    • 9.4. Other Use Cases

    10. PARAMETRIC INSURANCE MARKET, BY REGIONAL (USD BILLION)

    • 10.1. North America
      • 10.1.1. US
      • 10.1.2. Canada
    • 10.2. Europe
      • 10.2.1. Germany
      • 10.2.2. UK
      • 10.2.3. France
      • 10.2.4. Russia
      • 10.2.5. Italy
      • 10.2.6. Spain
      • 10.2.7. Rest of Europe
    • 10.3. APAC
      • 10.3.1. China
      • 10.3.2. India
      • 10.3.3. Japan
      • 10.3.4. South Korea
      • 10.3.5. Malaysia
      • 10.3.6. Thailand
      • 10.3.7. Indonesia
      • 10.3.8. Rest of APAC
    • 10.4. South America
      • 10.4.1. Brazil
      • 10.4.2. Mexico
      • 10.4.3. Argentina
      • 10.4.4. Rest of South America
    • 10.5. MEA
      • 10.5.1. GCC Countries
      • 10.5.2. South Africa
      • 10.5.3. Rest of MEA

    11. COMPETITIVE LANDSCAPE

    • 11.1. Overview
    • 11.2. Competitive Analysis
    • 11.3. Market share Analysis
    • 11.4. Major Growth Strategy in the Parametric Insurance Market
    • 11.5. Competitive Benchmarking
    • 11.6. Leading Players in Terms of Number of Developments in the Parametric Insurance Market
    • 11.7. Key developments and growth strategies
      • 11.7.1. New Product Launch/Service Deployment
      • 11.7.2. Merger & Acquisitions
      • 11.7.3. Joint Ventures
    • 11.8. Major Players Financial Matrix
      • 11.8.1. Sales and Operating Income
      • 11.8.2. Major Players R&D Expenditure. 2023

    12. COMPANY PROFILES

    • 12.1. SCOR SE
      • 12.1.1. Financial Overview
      • 12.1.2. Products Offered
      • 12.1.3. Key Developments
      • 12.1.4. SWOT Analysis
      • 12.1.5. Key Strategies
    • 12.2. Lloyds Banking Group
      • 12.2.1. Financial Overview
      • 12.2.2. Products Offered
      • 12.2.3. Key Developments
      • 12.2.4. SWOT Analysis
      • 12.2.5. Key Strategies
    • 12.3. Sompo Japan Nipponkoa Holdings, Inc.
      • 12.3.1. Financial Overview
      • 12.3.2. Products Offered
      • 12.3.3. Key Developments
      • 12.3.4. SWOT Analysis
      • 12.3.5. Key Strategies
    • 12.4. Swiss Reinsurance Company
      • 12.4.1. Financial Overview
      • 12.4.2. Products Offered
      • 12.4.3. Key Developments
      • 12.4.4. SWOT Analysis
      • 12.4.5. Key Strategies
    • 12.5. Tokio Marine Holdings, Inc.
      • 12.5.1. Financial Overview
      • 12.5.2. Products Offered
      • 12.5.3. Key Developments
      • 12.5.4. SWOT Analysis
      • 12.5.5. Key Strategies
    • 12.6. Zurich Insurance Group Ltd.
      • 12.6.1. Financial Overview
      • 12.6.2. Products Offered
      • 12.6.3. Key Developments
      • 12.6.4. SWOT Analysis
      • 12.6.5. Key Strategies
    • 12.7. Munich Reinsurance Company
      • 12.7.1. Financial Overview
      • 12.7.2. Products Offered
      • 12.7.3. Key Developments
      • 12.7.4. SWOT Analysis
      • 12.7.5. Key Strategies
    • 12.8. Allianz SE
      • 12.8.1. Financial Overview
      • 12.8.2. Products Offered
      • 12.8.3. Key Developments
      • 12.8.4. SWOT Analysis
      • 12.8.5. Key Strategies
    • 12.9. Chubb Limited
      • 12.9.1. Financial Overview
      • 12.9.2. Products Offered
      • 12.9.3. Key Developments
      • 12.9.4. SWOT Analysis
      • 12.9.5. Key Strategies
    • 12.10. Everest Re Group, Ltd.
      • 12.10.1. Financial Overview
      • 12.10.2. Products Offered
      • 12.10.3. Key Developments
      • 12.10.4. SWOT Analysis
      • 12.10.5. Key Strategies
    • 12.11. AXA SA
      • 12.11.1. Financial Overview
      • 12.11.2. Products Offered
      • 12.11.3. Key Developments
      • 12.11.4. SWOT Analysis
      • 12.11.5. Key Strategies
    • 12.12. PartnerRe Ltd.
      • 12.12.1. Financial Overview
      • 12.12.2. Products Offered
      • 12.12.3. Key Developments
      • 12.12.4. SWOT Analysis
      • 12.12.5. Key Strategies
    • 12.13. Aon plc
      • 12.13.1. Financial Overview
      • 12.13.2. Products Offered
      • 12.13.3. Key Developments
      • 12.13.4. SWOT Analysis
      • 12.13.5. Key Strategies
    • 12.14. QBE Insurance Group Limited
      • 12.14.1. Financial Overview
      • 12.14.2. Products Offered
      • 12.14.3. Key Developments
      • 12.14.4. SWOT Analysis
      • 12.14.5. Key Strategies
    • 12.15. Hannover Re
      • 12.15.1. Financial Overview
      • 12.15.2. Products Offered
      • 12.15.3. Key Developments
      • 12.15.4. SWOT Analysis
      • 12.15.5. Key Strategies

    13. APPENDIX

    • 13.1. References
    LIST OF FIGURES
    FIGURE 1. MARKET SYNOPSIS
    FIGURE 2. NORTH AMERICA PARAMETRIC INSURANCE MARKET ANALYSIS
    FIGURE 3. US PARAMETRIC INSURANCE MARKET ANALYSIS BY INSURANCE TYPE
    FIGURE 4. US PARAMETRIC INSURANCE MARKET ANALYSIS BY APPLICATION
    FIGURE 5. US PARAMETRIC INSURANCE MARKET ANALYSIS BY DEPLOYMENT MODEL
    FIGURE 6. US PARAMETRIC INSURANCE MARKET ANALYSIS BY USE CASE
    FIGURE 7. US PARAMETRIC INSURANCE MARKET ANALYSIS BY REGIONAL
    FIGURE 8. CANADA PARAMETRIC INSURANCE MARKET ANALYSIS BY INSURANCE TYPE
    FIGURE 9. CANADA PARAMETRIC INSURANCE MARKET ANALYSIS BY APPLICATION
    FIGURE 10. CANADA PARAMETRIC INSURANCE MARKET ANALYSIS BY DEPLOYMENT MODEL
    FIGURE 11. CANADA PARAMETRIC INSURANCE MARKET ANALYSIS BY USE CASE
    FIGURE 12. CANADA PARAMETRIC INSURANCE MARKET ANALYSIS BY REGIONAL
    FIGURE 13. EUROPE PARAMETRIC INSURANCE MARKET ANALYSIS
    FIGURE 14. GERMANY PARAMETRIC INSURANCE MARKET ANALYSIS BY INSURANCE TYPE
    FIGURE 15. GERMANY PARAMETRIC INSURANCE MARKET ANALYSIS BY APPLICATION
    FIGURE 16. GERMANY PARAMETRIC INSURANCE MARKET ANALYSIS BY DEPLOYMENT MODEL
    FIGURE 17. GERMANY PARAMETRIC INSURANCE MARKET ANALYSIS BY USE CASE
    FIGURE 18. GERMANY PARAMETRIC INSURANCE MARKET ANALYSIS BY REGIONAL
    FIGURE 19. UK PARAMETRIC INSURANCE MARKET ANALYSIS BY INSURANCE TYPE
    FIGURE 20. UK PARAMETRIC INSURANCE MARKET ANALYSIS BY APPLICATION
    FIGURE 21. UK PARAMETRIC INSURANCE MARKET ANALYSIS BY DEPLOYMENT MODEL
    FIGURE 22. UK PARAMETRIC INSURANCE MARKET ANALYSIS BY USE CASE
    FIGURE 23. UK PARAMETRIC INSURANCE MARKET ANALYSIS BY REGIONAL
    FIGURE 24. FRANCE PARAMETRIC INSURANCE MARKET ANALYSIS BY INSURANCE TYPE
    FIGURE 25. FRANCE PARAMETRIC INSURANCE MARKET ANALYSIS BY APPLICATION
    FIGURE 26. FRANCE PARAMETRIC INSURANCE MARKET ANALYSIS BY DEPLOYMENT MODEL
    FIGURE 27. FRANCE PARAMETRIC INSURANCE MARKET ANALYSIS BY USE CASE
    FIGURE 28. FRANCE PARAMETRIC INSURANCE MARKET ANALYSIS BY REGIONAL
    FIGURE 29. RUSSIA PARAMETRIC INSURANCE MARKET ANALYSIS BY INSURANCE TYPE
    FIGURE 30. RUSSIA PARAMETRIC INSURANCE MARKET ANALYSIS BY APPLICATION
    FIGURE 31. RUSSIA PARAMETRIC INSURANCE MARKET ANALYSIS BY DEPLOYMENT MODEL
    FIGURE 32. RUSSIA PARAMETRIC INSURANCE MARKET ANALYSIS BY USE CASE
    FIGURE 33. RUSSIA PARAMETRIC INSURANCE MARKET ANALYSIS BY REGIONAL
    FIGURE 34. ITALY PARAMETRIC INSURANCE MARKET ANALYSIS BY INSURANCE TYPE
    FIGURE 35. ITALY PARAMETRIC INSURANCE MARKET ANALYSIS BY APPLICATION
    FIGURE 36. ITALY PARAMETRIC INSURANCE MARKET ANALYSIS BY DEPLOYMENT MODEL
    FIGURE 37. ITALY PARAMETRIC INSURANCE MARKET ANALYSIS BY USE CASE
    FIGURE 38. ITALY PARAMETRIC INSURANCE MARKET ANALYSIS BY REGIONAL
    FIGURE 39. SPAIN PARAMETRIC INSURANCE MARKET ANALYSIS BY INSURANCE TYPE
    FIGURE 40. SPAIN PARAMETRIC INSURANCE MARKET ANALYSIS BY APPLICATION
    FIGURE 41. SPAIN PARAMETRIC INSURANCE MARKET ANALYSIS BY DEPLOYMENT MODEL
    FIGURE 42. SPAIN PARAMETRIC INSURANCE MARKET ANALYSIS BY USE CASE
    FIGURE 43. SPAIN PARAMETRIC INSURANCE MARKET ANALYSIS BY REGIONAL
    FIGURE 44. REST OF EUROPE PARAMETRIC INSURANCE MARKET ANALYSIS BY INSURANCE TYPE
    FIGURE 45. REST OF EUROPE PARAMETRIC INSURANCE MARKET ANALYSIS BY APPLICATION
    FIGURE 46. REST OF EUROPE PARAMETRIC INSURANCE MARKET ANALYSIS BY DEPLOYMENT MODEL
    FIGURE 47. REST OF EUROPE PARAMETRIC INSURANCE MARKET ANALYSIS BY USE CASE
    FIGURE 48. REST OF EUROPE PARAMETRIC INSURANCE MARKET ANALYSIS BY REGIONAL
    FIGURE 49. APAC PARAMETRIC INSURANCE MARKET ANALYSIS
    FIGURE 50. CHINA PARAMETRIC INSURANCE MARKET ANALYSIS BY INSURANCE TYPE
    FIGURE 51. CHINA PARAMETRIC INSURANCE MARKET ANALYSIS BY APPLICATION
    FIGURE 52. CHINA PARAMETRIC INSURANCE MARKET ANALYSIS BY DEPLOYMENT MODEL
    FIGURE 53. CHINA PARAMETRIC INSURANCE MARKET ANALYSIS BY USE CASE
    FIGURE 54. CHINA PARAMETRIC INSURANCE MARKET ANALYSIS BY REGIONAL
    FIGURE 55. INDIA PARAMETRIC INSURANCE MARKET ANALYSIS BY INSURANCE TYPE
    FIGURE 56. INDIA PARAMETRIC INSURANCE MARKET ANALYSIS BY APPLICATION
    FIGURE 57. INDIA PARAMETRIC INSURANCE MARKET ANALYSIS BY DEPLOYMENT MODEL
    FIGURE 58. INDIA PARAMETRIC INSURANCE MARKET ANALYSIS BY USE CASE
    FIGURE 59. INDIA PARAMETRIC INSURANCE MARKET ANALYSIS BY REGIONAL
    FIGURE 60. JAPAN PARAMETRIC INSURANCE MARKET ANALYSIS BY INSURANCE TYPE
    FIGURE 61. JAPAN PARAMETRIC INSURANCE MARKET ANALYSIS BY APPLICATION
    FIGURE 62. JAPAN PARAMETRIC INSURANCE MARKET ANALYSIS BY DEPLOYMENT MODEL
    FIGURE 63. JAPAN PARAMETRIC INSURANCE MARKET ANALYSIS BY USE CASE
    FIGURE 64. JAPAN PARAMETRIC INSURANCE MARKET ANALYSIS BY REGIONAL
    FIGURE 65. SOUTH KOREA PARAMETRIC INSURANCE MARKET ANALYSIS BY INSURANCE TYPE
    FIGURE 66. SOUTH KOREA PARAMETRIC INSURANCE MARKET ANALYSIS BY APPLICATION
    FIGURE 67. SOUTH KOREA PARAMETRIC INSURANCE MARKET ANALYSIS BY DEPLOYMENT MODEL
    FIGURE 68. SOUTH KOREA PARAMETRIC INSURANCE MARKET ANALYSIS BY USE CASE
    FIGURE 69. SOUTH KOREA PARAMETRIC INSURANCE MARKET ANALYSIS BY REGIONAL
    FIGURE 70. MALAYSIA PARAMETRIC INSURANCE MARKET ANALYSIS BY INSURANCE TYPE
    FIGURE 71. MALAYSIA PARAMETRIC INSURANCE MARKET ANALYSIS BY APPLICATION
    FIGURE 72. MALAYSIA PARAMETRIC INSURANCE MARKET ANALYSIS BY DEPLOYMENT MODEL
    FIGURE 73. MALAYSIA PARAMETRIC INSURANCE MARKET ANALYSIS BY USE CASE
    FIGURE 74. MALAYSIA PARAMETRIC INSURANCE MARKET ANALYSIS BY REGIONAL
    FIGURE 75. THAILAND PARAMETRIC INSURANCE MARKET ANALYSIS BY INSURANCE TYPE
    FIGURE 76. THAILAND PARAMETRIC INSURANCE MARKET ANALYSIS BY APPLICATION
    FIGURE 77. THAILAND PARAMETRIC INSURANCE MARKET ANALYSIS BY DEPLOYMENT MODEL
    FIGURE 78. THAILAND PARAMETRIC INSURANCE MARKET ANALYSIS BY USE CASE
    FIGURE 79. THAILAND PARAMETRIC INSURANCE MARKET ANALYSIS BY REGIONAL
    FIGURE 80. INDONESIA PARAMETRIC INSURANCE MARKET ANALYSIS BY INSURANCE TYPE
    FIGURE 81. INDONESIA PARAMETRIC INSURANCE MARKET ANALYSIS BY APPLICATION
    FIGURE 82. INDONESIA PARAMETRIC INSURANCE MARKET ANALYSIS BY DEPLOYMENT MODEL
    FIGURE 83. INDONESIA PARAMETRIC INSURANCE MARKET ANALYSIS BY USE CASE
    FIGURE 84. INDONESIA PARAMETRIC INSURANCE MARKET ANALYSIS BY REGIONAL
    FIGURE 85. REST OF APAC PARAMETRIC INSURANCE MARKET ANALYSIS BY INSURANCE TYPE
    FIGURE 86. REST OF APAC PARAMETRIC INSURANCE MARKET ANALYSIS BY APPLICATION
    FIGURE 87. REST OF APAC PARAMETRIC INSURANCE MARKET ANALYSIS BY DEPLOYMENT MODEL
    FIGURE 88. REST OF APAC PARAMETRIC INSURANCE MARKET ANALYSIS BY USE CASE
    FIGURE 89. REST OF APAC PARAMETRIC INSURANCE MARKET ANALYSIS BY REGIONAL
    FIGURE 90. SOUTH AMERICA PARAMETRIC INSURANCE MARKET ANALYSIS
    FIGURE 91. BRAZIL PARAMETRIC INSURANCE MARKET ANALYSIS BY INSURANCE TYPE
    FIGURE 92. BRAZIL PARAMETRIC INSURANCE MARKET ANALYSIS BY APPLICATION
    FIGURE 93. BRAZIL PARAMETRIC INSURANCE MARKET ANALYSIS BY DEPLOYMENT MODEL
    FIGURE 94. BRAZIL PARAMETRIC INSURANCE MARKET ANALYSIS BY USE CASE
    FIGURE 95. BRAZIL PARAMETRIC INSURANCE MARKET ANALYSIS BY REGIONAL
    FIGURE 96. MEXICO PARAMETRIC INSURANCE MARKET ANALYSIS BY INSURANCE TYPE
    FIGURE 97. MEXICO PARAMETRIC INSURANCE MARKET ANALYSIS BY APPLICATION
    FIGURE 98. MEXICO PARAMETRIC INSURANCE MARKET ANALYSIS BY DEPLOYMENT MODEL
    FIGURE 99. MEXICO PARAMETRIC INSURANCE MARKET ANALYSIS BY USE CASE
    FIGURE 100. MEXICO PARAMETRIC INSURANCE MARKET ANALYSIS BY REGIONAL
    FIGURE 101. ARGENTINA PARAMETRIC INSURANCE MARKET ANALYSIS BY INSURANCE TYPE
    FIGURE 102. ARGENTINA PARAMETRIC INSURANCE MARKET ANALYSIS BY APPLICATION
    FIGURE 103. ARGENTINA PARAMETRIC INSURANCE MARKET ANALYSIS BY DEPLOYMENT MODEL
    FIGURE 104. ARGENTINA PARAMETRIC INSURANCE MARKET ANALYSIS BY USE CASE
    FIGURE 105. ARGENTINA PARAMETRIC INSURANCE MARKET ANALYSIS BY REGIONAL
    FIGURE 106. REST OF SOUTH AMERICA PARAMETRIC INSURANCE MARKET ANALYSIS BY INSURANCE TYPE
    FIGURE 107. REST OF SOUTH AMERICA PARAMETRIC INSURANCE MARKET ANALYSIS BY APPLICATION
    FIGURE 108. REST OF SOUTH AMERICA PARAMETRIC INSURANCE MARKET ANALYSIS BY DEPLOYMENT MODEL
    FIGURE 109. REST OF SOUTH AMERICA PARAMETRIC INSURANCE MARKET ANALYSIS BY USE CASE
    FIGURE 110. REST OF SOUTH AMERICA PARAMETRIC INSURANCE MARKET ANALYSIS BY REGIONAL
    FIGURE 111. MEA PARAMETRIC INSURANCE MARKET ANALYSIS
    FIGURE 112. GCC COUNTRIES PARAMETRIC INSURANCE MARKET ANALYSIS BY INSURANCE TYPE
    FIGURE 113. GCC COUNTRIES PARAMETRIC INSURANCE MARKET ANALYSIS BY APPLICATION
    FIGURE 114. GCC COUNTRIES PARAMETRIC INSURANCE MARKET ANALYSIS BY DEPLOYMENT MODEL
    FIGURE 115. GCC COUNTRIES PARAMETRIC INSURANCE MARKET ANALYSIS BY USE CASE
    FIGURE 116. GCC COUNTRIES PARAMETRIC INSURANCE MARKET ANALYSIS BY REGIONAL
    FIGURE 117. SOUTH AFRICA PARAMETRIC INSURANCE MARKET ANALYSIS BY INSURANCE TYPE
    FIGURE 118. SOUTH AFRICA PARAMETRIC INSURANCE MARKET ANALYSIS BY APPLICATION
    FIGURE 119. SOUTH AFRICA PARAMETRIC INSURANCE MARKET ANALYSIS BY DEPLOYMENT MODEL
    FIGURE 120. SOUTH AFRICA PARAMETRIC INSURANCE MARKET ANALYSIS BY USE CASE
    FIGURE 121. SOUTH AFRICA PARAMETRIC INSURANCE MARKET ANALYSIS BY REGIONAL
    FIGURE 122. REST OF MEA PARAMETRIC INSURANCE MARKET ANALYSIS BY INSURANCE TYPE
    FIGURE 123. REST OF MEA PARAMETRIC INSURANCE MARKET ANALYSIS BY APPLICATION
    FIGURE 124. REST OF MEA PARAMETRIC INSURANCE MARKET ANALYSIS BY DEPLOYMENT MODEL
    FIGURE 125. REST OF MEA PARAMETRIC INSURANCE MARKET ANALYSIS BY USE CASE
    FIGURE 126. REST OF MEA PARAMETRIC INSURANCE MARKET ANALYSIS BY REGIONAL
    FIGURE 127. KEY BUYING CRITERIA OF PARAMETRIC INSURANCE MARKET
    FIGURE 128. RESEARCH PROCESS OF MRFR
    FIGURE 129. DRO ANALYSIS OF PARAMETRIC INSURANCE MARKET
    FIGURE 130. DRIVERS IMPACT ANALYSIS: PARAMETRIC INSURANCE MARKET
    FIGURE 131. RESTRAINTS IMPACT ANALYSIS: PARAMETRIC INSURANCE MARKET
    FIGURE 132. SUPPLY / VALUE CHAIN: PARAMETRIC INSURANCE MARKET
    FIGURE 133. PARAMETRIC INSURANCE MARKET, BY INSURANCE TYPE, 2024 (% SHARE)
    FIGURE 134. PARAMETRIC INSURANCE MARKET, BY INSURANCE TYPE, 2019 TO 2032 (USD Billions)
    FIGURE 135. PARAMETRIC INSURANCE MARKET, BY APPLICATION, 2024 (% SHARE)
    FIGURE 136. PARAMETRIC INSURANCE MARKET, BY APPLICATION, 2019 TO 2032 (USD Billions)
    FIGURE 137. PARAMETRIC INSURANCE MARKET, BY DEPLOYMENT MODEL, 2024 (% SHARE)
    FIGURE 138. PARAMETRIC INSURANCE MARKET, BY DEPLOYMENT MODEL, 2019 TO 2032 (USD Billions)
    FIGURE 139. PARAMETRIC INSURANCE MARKET, BY USE CASE, 2024 (% SHARE)
    FIGURE 140. PARAMETRIC INSURANCE MARKET, BY USE CASE, 2019 TO 2032 (USD Billions)
    FIGURE 141. PARAMETRIC INSURANCE MARKET, BY REGIONAL, 2024 (% SHARE)
    FIGURE 142. PARAMETRIC INSURANCE MARKET, BY REGIONAL, 2019 TO 2032 (USD Billions)
    FIGURE 143. BENCHMARKING OF MAJOR COMPETITORS
    Research Process

    Data Library Research are conducted by industry experts who offer insight on industry structure, market segmentations technology assessment and competitive landscape (CL), and penetration, as well as on emerging trends. Their analysis is based on primary interviews (~ 80%) and secondary research (~ 20%) as well as years of professional expertise in their respective industries. Adding to this, by analysing historical trends and current market positions, our analysts predict where the market will be headed for the next five years. Furthermore, the varying trends of segment & categories geographically presented are also studied and the estimated based on the primary & secondary research.

    In this particular report from the supply side Data Library Research has conducted primary surveys (interviews) with the key level executives (VP, CEO’s, Marketing Director, Business Development Manager and SOFT) of the companies that active & prominent as well as the midsized organization

    FIGURE 1: DLR RESEARH PROCESS

    research-methodology1

    Primary Research

    Extensive primary research was conducted to gain a deeper insight of the market and industry performance. The analysis is based on both primary and secondary research as well as years of professional expertise in the respective industries.

    In addition to analysing current and historical trends, our analysts predict where the market is headed over the next five years.

    It varies by segment for these categories geographically presented in the list of market tables. Speaking about this particular report we have conducted primary surveys (interviews) with the key level executives (VP, CEO’s, Marketing Director, Business Development Manager and many more) of the major players active in the market.

    Secondary Research

    Secondary research was mainly used to collect and identify information useful for the extensive, technical, market-oriented, and Friend’s study of the Global Extra Neutral Alcohol. It was also used to obtain key information about major players, market classification and segmentation according to the industry trends, geographical markets, and developments related to the market and technology perspectives. For this study, analysts have gathered information from various credible sources, such as annual reports, sec filings, journals, white papers, SOFT presentations, and company web sites.

    Market Size Estimation

    Both, top-down and bottom-up approaches were used to estimate and validate the size of the Global market and to estimate the size of various other dependent submarkets in the overall Extra Neutral Alcohol. The key players in the market were identified through secondary research and their market contributions in the respective geographies were determined through primary and secondary research.

    Forecast Model

    research-methodology2

    Happy to Assist You

    If you have a question?

    [email protected]

    IND : +91 955 279 0357

    Browse Related Reports