3D Mask Machine Market Overview and Analysis

The 3D Mask Machine Market is valued at approximately USD 4.16 billion in 2025 and is anticipated to reach around USD 25.57 billion by 2032, growing with a CAGR of 21.25% from 2025-2032.

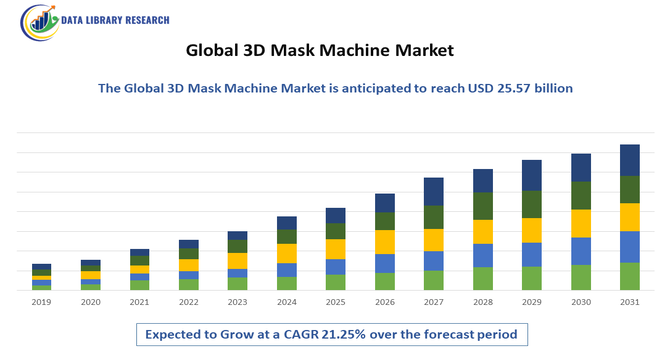
The Global 3D Mask Machine Market refers to the international industry involved in the production, development, and distribution of automated machinery designed to manufacture three-dimensional (3D) face masks, often used in medical, industrial, and consumer applications. These machines are equipped with advanced technologies like ultrasonic welding, high-speed cutting, and automated folding to create ergonomically shaped masks that fit the contours of the human face more effectively than traditional flat masks. The market is driven by rising demand for high-efficiency protective masks due to increasing health awareness, air pollution concerns, and pandemic preparedness, with significant growth observed across regions such as Asia-Pacific, North America, and Europe.

3D Mask Machine Market Latest Trends

The 3D mask machine market is seeing strong momentum driven by heightened health & safety awareness post COVID, which fuels demand for better protective equipment and personalized fit. Automation and advanced manufacturing technologies—such as 3D printing, additive production, machine vision, and AI enabled design—are becoming more integrated, enabling higher throughput, precision, and lower wastage. Sustainability is emerging as a major trend, with manufacturers seeking eco friendly, biodegradable, or reusable materials, and optimizing production to reduce environmental impact.

Segmentation: The Global 3D Mask Machine Market can be segmented by Product (Below ~100 masks per minute machines, 100 200 masks/min machines, 200 300 masks/min machines and Others (higher capacity, custom), Application (Medical / Healthcare Products, Labor, Consumer and Other Applications), Technology (Fully Automatic 3D Mask Machines, Semi Automatic 3D Mask Machines, Manual or less automated variants and Other Technologies), Material (Thermoplastic polymers, Elastomers or flexible materials and Biodegradable / eco friendly materials), and Geography (North America, Europe, Asia-Pacific, Latin America, Middle East & Africa). The report provides the value (in USD million) for the above segments.

Market Drivers:

  • Rising Demand for High-Performance Masks in Healthcare and Industry

The strongest drivers of the 3D mask machine market is the increasing need for high-quality, comfortable face masks, especially in healthcare and industrial settings. Unlike flat surgical masks, 3D masks offer a better fit, improved filtration, and reduced leakage—making them ideal for doctors, nurses, factory workers, and people in high-risk environments. The COVID-19 pandemic made everyone more aware of the importance of effective protective equipment, and that awareness hasn’t faded. Hospitals, manufacturing units, and even consumers now want masks that provide better protection and long-term comfort. As a result, demand for machines that can mass-produce these advanced, form-fitting masks has grown significantly across both developed and developing regions.

  • Advancements in Automation and Smart Manufacturing

Technological progress in automation and smart manufacturing is significantly boosting the 3D mask machine market. Today’s machines are no longer just mechanical—they’re equipped with AI, robotics, and computer vision systems to improve speed, accuracy, and consistency. This makes it easier and more cost-effective for manufacturers to produce large volumes of masks without compromising on quality. Features like automatic material feeding, ultrasonic welding, and real-time defect detection have become common, reducing human error and labor costs. These innovations make it possible for both large and small businesses to enter the mask production space, creating more demand for smart 3D mask machines. In short, better tech is making mask production faster, easier, and more profitable.

Market Restraints:

  • High Initial Investment and Technical Complexity

A major restraint for the Global 3D Mask Machine Market is the high upfront cost and technical complexity involved in purchasing and operating these machines. Fully automated 3D mask machines can be expensive, often requiring significant capital investment—not just for the equipment itself, but also for setting up supporting infrastructure like clean rooms, skilled labor, and quality control systems. Additionally, many small and medium enterprises (SMEs) lack the technical know-how to operate or maintain these machines, which often integrate advanced technologies like ultrasonic welding and programmable logic controllers (PLCs). This creates a barrier to entry, especially in developing economies where budget constraints and limited access to skilled technicians can slow market adoption and expansion.

Socio Economic Impact on  3D Mask Machine Market

The Global 3D Mask Machine Market exerts a significant socio-economic impact, primarily by boosting public health resilience and democratizing the manufacturing of essential personal protective equipment (PPE). Economically, the market drives innovation in additive manufacturing, creating high-skilled jobs in design, operation, and maintenance, while potentially shortening global supply chains by enabling decentralized, on-demand, and localized production. This speed and flexibility were critical during public health crises, allowing communities and hospitals to rapidly produce customized masks and components, thereby mitigating supply shortages and reducing the strain on conventional manufacturing and logistics. Socially, the technology enhances healthcare access by providing quicker and more tailored protective gear, though its high initial cost and the need for standardized quality certification present challenges to widespread adoption, particularly in developing economies.

Segmental Analysis:

  • 100 200 masks/min machines Segment is Expected to Witness Significant Growth Over the Forecast Period

The 100–200 masks per minute segment is projected to experience strong growth due to its ideal balance between production speed and operational efficiency. These machines are well-suited for mid-sized manufacturers looking to scale their output without investing in ultra-high-speed models, which often come with much higher costs and maintenance demands. As demand for 3D masks grows steadily in both medical and consumer sectors, this segment offers a flexible and cost-effective option. Additionally, these machines often come with semi-automatic or partially automated features, making them easier to operate in regions with moderate technical expertise. Their ability to deliver high output while maintaining reasonable energy and labor requirements makes them increasingly attractive in emerging markets across Asia-Pacific and Latin America.

  • Medical / Healthcare Products Segment is Expected to Witness Significant Growth Over the Forecast Period

The medical and healthcare products segment is expected to lead the growth in the 3D mask machine market due to the increasing demand for high-protection and ergonomic face masks in hospitals, clinics, and other care settings. Post-COVID, there has been a global shift toward higher safety standards and more effective personal protective equipment (PPE), especially for frontline workers. 3D masks are preferred in healthcare environments because they provide a closer facial fit and superior filtration efficiency, minimizing leakage and exposure risks. With many hospitals and medical device companies seeking to produce their own masks for better quality control and supply stability, the demand for advanced 3D mask machines tailored to medical standards is rising rapidly, particularly in North America, Europe, and parts of Asia.

  • Semi Automatic 3D Mask Machines Segment is Expected to Witness Significant Growth Over the Forecast Period

Semi-automatic 3D mask machines are gaining popularity, especially among small and medium enterprises (SMEs) and startups, due to their lower capital requirements and operational flexibility. These machines strike a practical balance between manual and fully automated production, allowing operators to manage part of the process while still benefiting from automation in critical steps like ultrasonic welding and shaping. As more businesses enter the protective mask market—especially in developing regions—semi-automatic machines offer an accessible way to start production without needing a large, skilled workforce. Their relatively easy maintenance and lower energy consumption also make them suitable for regions with limited industrial infrastructure. The segment’s growth is supported by rising local manufacturing initiatives and government support for PPE production capacity building.

  • North American Region is Expected to Witness Significant Growth Over the Forecast Period

The North American region is projected to experience significant growth in the 3D mask machine market due to strong healthcare infrastructure, rising demand for high-quality PPE, and increasing investment in domestic manufacturing. The COVID-19 pandemic exposed the vulnerabilities of global supply chains, prompting the U.S. and Canada to prioritize local production of essential medical supplies, including face masks.

Government initiatives and funding for PPE manufacturing, along with stricter workplace safety regulations, are driving demand for advanced 3D mask machines across healthcare, industrial, and commercial sectors. For instance, in July 2025, an article titled, “A comparative anthropometric analysis of U.S. female firefighters versus the general female population” reported that that female firefighters in the U.S. have distinct body measurements compared to the general female population, highlighting the need for specialized PPE sizing. For the U.S. 3D mask machine market, this drives demand for customized, well-fitting protective gear. Using 3D scanning and precise anthropometric data enables manufacturers to produce better-fitting masks, boosting market growth through tailored 3D mask solutions.

Additionally, the region’s focus on automation and adoption of smart manufacturing technologies aligns well with the latest features offered by modern mask machines, making North America a key growth hub over the forecast period. For instance, in June 2024, Rockwell Automation, Inc., released its 10th annual "State of Smart Manufacturing Report: Life Sciences Edition," based on insights from 143 industry leaders across 15 top manufacturing countries. This development underscores North America's strong emphasis on automation and smart manufacturing technologies, which perfectly complements the advanced capabilities of modern mask machines. As a result, North America is well-positioned to become a major growth hub for the 3D mask machine market throughout the forecast period, driven by the integration of cutting-edge automation and digital innovations in manufacturing processes.

 3D Mask Machine Market Competitive Landscape

The competitive landscape of the Global 3D Mask Machine Market is characterized by the presence of a mix of established machinery manufacturers and emerging players, primarily concentrated in Asia-Pacific, especially China, South Korea, and Japan. Key players compete on factors such as machine speed, automation level, pricing, customization, and after-sales service. Companies are increasingly focusing on innovation—integrating technologies like AI, IoT, and computer vision to enhance machine precision and efficiency. Strategic partnerships, expansion into new geographies, and investment in R&D are common approaches to gaining market share. Additionally, with rising global demand, many regional players are scaling up production and enhancing export capabilities to meet international standards, intensifying competition in both price-sensitive and premium market segments.

The 20 major players for above market are:

  • NCM Nonwoven Converting Machinery Co., Ltd.
  • KYD Automatic Mask Machine Factory
  • TESTEX Instrument Ltd.
  • TRM – Top Rank Machinery Inc.
  • Dongguan Huitong Automatic Machinery Technology Co., Ltd.
  • Mabotex Engineering
  • Broadfair Automation Equipment
  • Healthy Machinery
  • Chang Hong Machinery
  • DG South Nekon
  • Dongguan Li Cheng Mechanical Equipment
  • Shenzhen Rison Automation Co., Ltd.
  • Intamac Packaging Systems
  • DOOSAN Electronic Machinery & Equipment
  • Steady Ultrasonic
  • Ruhlamat
  • Hyojin Autotech
  • CNC VINA
  • Zhongshan Zhiqingsong Automatic Machinery
  • Shenzhen Chuangying Times Technology


Recent Development:

  • In July 2025, an article published in the journal, Thin Solid Films, by researchers of College of Intelligence Science and Technology, National University of Defense Technology, China, reported that the use of a 3D mask in the magnetron sputtering process significantly improves the uniformity of metal film deposition on fused silica resonators used in Hemispherical Resonator Gyroscopes (HRGs). Designed based on simulation data, the 3D mask optimizes the passage rate of sputtered atoms, enhancing film uniformity on the inner surface of the resonator. As a result, the radial inhomogeneity of the metal film is reduced from 11.9% to 3.5%, leading to more consistent damping behavior and only a 0.5% increase in damping inhomogeneity compared to conventional methods.


  • In June 2020, Food and Drug Administration (FDA) granted approval for the first 3D-printed face mask, developed by the VHA team, the 3D-printed "Stopgap" face mask is designed to serve as personal protective equipment (PPE), providing liquid barrier protection against the novel coronavirus for frontline medical workers.


Frequently Asked Questions (FAQ) :

Q1. What the main growth driving factors for this market?

The main growth driving factors for the 3D Mask Machine Market include the unprecedented surge in global demand for Personal Protective Equipment (PPE) like face masks, particularly following the COVID-19 pandemic. This is coupled with ongoing advancements in additive manufacturing technologies, such as improved speed, materials, and automation, which enable the efficient, high-volume production of masks. Furthermore, the increasing adoption of 3D printing across various industries, especially healthcare, and growing governmental support for decentralized and customized PPE production significantly propel the market forward.

Q2. What are the main restraining factors for this market?

Key restraining factors primarily revolve around cost and standardization challenges. The relatively high manufacturing cost of 3D-printed masks, especially the raw materials, can hinder widespread adoption among smaller enterprises. Additionally, there has been a documented lack of standardized testing methods and regulatory clarity for 3D-printed medical masks, which raises serious concerns regarding their protective capacity and effectiveness compared to traditional, certified PPE, thereby limiting their acceptance.

Q3. Which segment is expected to witness high growth?

Within the broader 3D mask production landscape, the segment for N95/KN95/FFP2 Mask Production Equipment is expected to witness significantly high growth. This is driven by the sustained demand for high-filtration respirators in both medical and industrial settings to protect against airborne diseases and particles. Furthermore, the increasing need for high-volume, automated production to ensure supply chain resilience and meet rising industrial safety mandates will continue to boost this specialized machine segment.

Q4. Who are the top major players for this market?

The top major players in this market are often leading companies from the broader 3D printing and industrial automation sectors who manufacture the specialized equipment. Key players include large, established firms like Stratasys, 3D Systems, EOS, HP, and General Electric (GE Additive). These companies leverage their expertise in additive manufacturing technology, materials science, and industrial-scale production systems to offer solutions for fabricating both customized and high-volume protective mask components.

Q5. Which country is the largest player?

The Asia-Pacific region, primarily driven by countries like China, Japan, and South Korea, holds the largest share in the related overall face mask and 3D printing markets and is a dominant manufacturing hub for 3D mask machines. This dominance is due to rapid industrialization, the strong presence of major electronics and semiconductor manufacturing, and significant investment in adopting advanced additive manufacturing technologies to boost their healthcare and industrial production capacity.

3D Mask Machine MARKET STUDY GLOBAL MARKET ANALYSIS, INSIGHTS AND FORECAST, 2023-2029

    1. Introduction

    • 1.1. Research Scope
    • 1.2. Market Segmentation
    • 1.3. Research Methodology
    • 1.4. Definitions and Assumptions

    2. Executive Summary

      3. Market Dynamics

      • 3.1. Market Drivers
      • 3.2. Market Restraints
      • 3.3. Market Opportunities

      4. Key Insights

      • 4.1. Key Emerging Trends – For Major Countries
      • 4.2. Latest Technological Advancement
      • 4.3. Regulatory Landscape
      • 4.4. Industry SWOT Analysis
      • 4.5. Porters Five Forces Analysis

      5. Global 3D Mask Machine Market Analysis (USD Billion), Insights and Forecast, 2018-2029

      • 5.1. Key Findings / Summary
      • 5.2. Market Analysis, Insights and Forecast – By Segment 1
        • 5.2.1. Sub-Segment 1
        • 5.2.2. Sub-Segment 2
      • 5.3. Market Analysis, Insights and Forecast – By Segment 2
        • 5.3.1. Sub-Segment 1
        • 5.3.2. Sub-Segment 2
        • 5.3.3. Sub-Segment 3
        • 5.3.4. Others
      • 5.4. Market Analysis, Insights and Forecast – By Segment 3
        • 5.4.1. Sub-Segment 1
        • 5.4.2. Sub-Segment 2
        • 5.4.3. Sub-Segment 3
        • 5.4.4. Others
      • 5.5. Market Analysis, Insights and Forecast – By Region
        • 5.5.1. North America
        • 5.5.2. Latin America
        • 5.5.3. Europe
        • 5.5.4. Asia Pacific
        • 5.5.5. Middle East and Africa

      6. North America 3D Mask Machine Market Analysis (USD Billion), Insights and Forecast, 2018-2029

      • 6.1. Key Findings / Summary
      • 6.2. Market Analysis, Insights and Forecast – By Segment 1
        • 6.2.1. Sub-Segment 1
        • 6.2.2. Sub-Segment 2
      • 6.3. Market Analysis, Insights and Forecast – By Segment 2
        • 6.3.1. Sub-Segment 1
        • 6.3.2. Sub-Segment 2
        • 6.3.3. Sub-Segment 3
        • 6.3.4. Others
      • 6.4. Market Analysis, Insights and Forecast – By Segment 3
        • 6.4.1. Sub-Segment 1
        • 6.4.2. Sub-Segment 2
        • 6.4.3. Sub-Segment 3
        • 6.4.4. Others
      • 6.5. Market Analysis, Insights and Forecast – By Country
        • 6.5.1. U.S.
        • 6.5.2. Canada

      7. Latin America 3D Mask Machine Market Analysis (USD Billion), Insights and Forecast, 2018-2029

      • 7.1. Key Findings / Summary
      • 7.2. Market Analysis, Insights and Forecast – By Segment 1
        • 7.2.1. Sub-Segment 1
        • 7.2.2. Sub-Segment 2
      • 7.3. Market Analysis, Insights and Forecast – By Segment 2
        • 7.3.1. Sub-Segment 1
        • 7.3.2. Sub-Segment 2
        • 7.3.3. Sub-Segment 3
        • 7.3.4. Others
      • 7.4. Market Analysis, Insights and Forecast – By Segment 3
        • 7.4.1. Sub-Segment 1
        • 7.4.2. Sub-Segment 2
        • 7.4.3. Sub-Segment 3
        • 7.4.4. Others
      • 7.5. Insights and Forecast – By Country
        • 7.5.1. Brazil
        • 7.5.2. Mexico
        • 7.5.3. Rest of Latin America

      8. Europe 3D Mask Machine Market Analysis (USD Billion), Insights and Forecast, 2018-2029

      • 8.1. Key Findings / Summary
      • 8.2. Market Analysis, Insights and Forecast – By Segment 1
        • 8.2.1. Sub-Segment 1
        • 8.2.2. Sub-Segment 2
      • 8.3. Market Analysis, Insights and Forecast – By Segment 2
        • 8.3.1. Sub-Segment 1
        • 8.3.2. Sub-Segment 2
        • 8.3.3. Sub-Segment 3
        • 8.3.4. Others
      • 8.4. Market Analysis, Insights and Forecast – By Segment 3
        • 8.4.1. Sub-Segment 1
        • 8.4.2. Sub-Segment 2
        • 8.4.3. Sub-Segment 3
        • 8.4.4. Others
      • 8.5. Market Analysis, Insights and Forecast – By Country
        • 8.5.1. UK
        • 8.5.2. Germany
        • 8.5.3. France
        • 8.5.4. Italy
        • 8.5.5. Spain
        • 8.5.6. Russia
        • 8.5.7. Rest of Europe

      9. Asia Pacific 3D Mask Machine Market Analysis (USD Billion), Insights and Forecast, 2018-2029

      • 9.1. Key Findings / Summary
      • 9.2. Market Analysis, Insights and Forecast – By Segment 1
        • 9.2.1. Sub-Segment 1
        • 9.2.2. Sub-Segment 2
      • 9.3. Market Analysis, Insights and Forecast – By Segment 2
        • 9.3.1. Sub-Segment 1
        • 9.3.2. Sub-Segment 2
        • 9.3.3. Sub-Segment 3
        • 9.3.4. Others
      • 9.4. Market Analysis, Insights and Forecast – By Segment 3
        • 9.4.1. Sub-Segment 1
        • 9.4.2. Sub-Segment 2
        • 9.4.3. Sub-Segment 3
        • 9.4.4. Others
      • 9.5. Market Analysis, Insights and Forecast – By Country
        • 9.5.1. China
        • 9.5.2. India
        • 9.5.3. Japan
        • 9.5.4. Australia
        • 9.5.5. South East Asia
        • 9.5.6. Rest of Asia Pacific

      10. Middle East & Africa 3D Mask Machine Market Analysis (USD Billion), Insights and Forecast, 2018-2029

      • 10.1. Key Findings / Summary
      • 10.2. Market Analysis, Insights and Forecast – By Segment 1
        • 10.2.1. Sub-Segment 1
        • 10.2.2. Sub-Segment 2
      • 10.3. Market Analysis, Insights and Forecast – By Segment 2
        • 10.3.1. Sub-Segment 1
        • 10.3.2. Sub-Segment 2
        • 10.3.3. Sub-Segment 3
        • 10.3.4. Others
      • 10.4. Market Analysis, Insights and Forecast – By Segment 3
        • 10.4.1. Sub-Segment 1
        • 10.4.2. Sub-Segment 2
        • 10.4.3. Sub-Segment 3
        • 10.4.4. Others
      • 10.5. Market Analysis, Insights and Forecast – By Country
        • 10.5.1. GCC
        • 10.5.2. South Africa
        • 10.5.3. Rest of Middle East & Africa

      11. Competitive Analysis

      • 11.1. Company Market Share Analysis, 2018
      • 11.2. Key Industry Developments
      • 11.3. Company Profile
        • 11.3.1. Company 1
          • 11.3.1.1. Business Overview
          • 11.3.1.2. Segment 1 & Service Offering
          • 11.3.1.3. Overall Revenue
          • 11.3.1.4. Geographic Presence
          • 11.3.1.5. Recent Development
        *Similar details will be provided for the following companies
        • 11.3.2. Company 2
        • 11.3.3. Company 3
        • 11.3.4. Company 4
        • 11.3.5. Company 5
        • 11.3.6. Company 6
        • 11.3.7. Company 7
        • 11.3.8. Company 8
        • 11.3.9. Company 9
        • 11.3.10. Company 10
        • 11.3.11. Company 11
        • 11.3.12. Company 12
      List of Figures

      Figure 1: Global 3D Mask Machine Market Revenue Breakdown (USD Billion, %) by Region, 2023 & 2029
      Figure 2: Global 3D Mask Machine Market Value Share (%), By Segment 1, 2023 & 2029
      Figure 3: Global 3D Mask Machine Market Forecast (USD Billion), by Sub-Segment 1, 2018-2029
      Figure 4: Global 3D Mask Machine Market Forecast (USD Billion), by Sub-Segment 2, 2018-2029
      Figure 5: Global 3D Mask Machine Market Value Share (%), By Segment 2, 2023 & 2029
      Figure 6: Global 3D Mask Machine Market Forecast (USD Billion), by Sub-Segment 1, 2018-2029
      Figure 7: Global 3D Mask Machine Market Forecast (USD Billion), by Sub-Segment 2, 2018-2029
      Figure 8: Global 3D Mask Machine Market Forecast (USD Billion), by Sub-Segment 3, 2018-2029
      Figure 9: Global 3D Mask Machine Market Forecast (USD Billion), by Others, 2018-2029
      Figure 10: Global 3D Mask Machine Market Value Share (%), By Segment 3, 2023 & 2029
      Figure 11: Global 3D Mask Machine Market Forecast (USD Billion), by Sub-Segment 1, 2018-2029
      Figure 12: Global 3D Mask Machine Market Forecast (USD Billion), by Sub-Segment 2, 2018-2029
      Figure 13: Global 3D Mask Machine Market Forecast (USD Billion), by Sub-Segment 3, 2018-2029
      Figure 14: Global 3D Mask Machine Market Forecast (USD Billion), by Others, 2018-2029
      Figure 15: Global 3D Mask Machine Market Value (USD Billion), by Region, 2023 & 2029
      Figure 16: North America 3D Mask Machine Market Value Share (%), By Segment 1, 2023 & 2029
      Figure 17: North America 3D Mask Machine Market Forecast (USD Billion), by Sub-Segment 1, 2018-2029
      Figure 18: North America 3D Mask Machine Market Forecast (USD Billion), by Sub-Segment 2, 2018-2029
      Figure 19: North America 3D Mask Machine Market Value Share (%), By Segment 2, 2023 & 2029
      Figure 20: North America 3D Mask Machine Market Forecast (USD Billion), by Sub-Segment 1, 2018-2029
      Figure 21: North America 3D Mask Machine Market Forecast (USD Billion), by Sub-Segment 2, 2018-2029
      Figure 22: North America 3D Mask Machine Market Forecast (USD Billion), by Sub-Segment 3, 2018-2029
      Figure 23: North America 3D Mask Machine Market Forecast (USD Billion), by Others, 2018-2029
      Figure 24: North America 3D Mask Machine Market Value Share (%), By Segment 3, 2023 & 2029
      Figure 25: North America 3D Mask Machine Market Forecast (USD Billion), by Sub-Segment 1, 2018-2029
      Figure 26: North America 3D Mask Machine Market Forecast (USD Billion), by Sub-Segment 2, 2018-2029
      Figure 27: North America 3D Mask Machine Market Forecast (USD Billion), by Sub-Segment 3, 2018-2029
      Figure 28: North America 3D Mask Machine Market Forecast (USD Billion), by Others, 2018-2029
      Figure 29: North America 3D Mask Machine Market Forecast (USD Billion), by U.S., 2018-2029
      Figure 30: North America 3D Mask Machine Market Forecast (USD Billion), by Canada, 2018-2029
      Figure 31: Latin America 3D Mask Machine Market Value Share (%), By Segment 1, 2023 & 2029
      Figure 32: Latin America 3D Mask Machine Market Forecast (USD Billion), by Sub-Segment 1, 2018-2029
      Figure 33: Latin America 3D Mask Machine Market Forecast (USD Billion), by Sub-Segment 2, 2018-2029
      Figure 34: Latin America 3D Mask Machine Market Value Share (%), By Segment 2, 2023 & 2029
      Figure 35: Latin America 3D Mask Machine Market Forecast (USD Billion), by Sub-Segment 1, 2018-2029
      Figure 36: Latin America 3D Mask Machine Market Forecast (USD Billion), by Sub-Segment 2, 2018-2029
      Figure 37: Latin America 3D Mask Machine Market Forecast (USD Billion), by Sub-Segment 3, 2018-2029
      Figure 38: Latin America 3D Mask Machine Market Forecast (USD Billion), by Others, 2018-2029
      Figure 39: Latin America 3D Mask Machine Market Value Share (%), By Segment 3, 2023 & 2029
      Figure 40: Latin America 3D Mask Machine Market Forecast (USD Billion), by Sub-Segment 1, 2018-2029
      Figure 41: Latin America 3D Mask Machine Market Forecast (USD Billion), by Sub-Segment 2, 2018-2029
      Figure 42: Latin America 3D Mask Machine Market Forecast (USD Billion), by Sub-Segment 3, 2018-2029
      Figure 43: Latin America 3D Mask Machine Market Forecast (USD Billion), by Others, 2018-2029
      Figure 44: Latin America 3D Mask Machine Market Forecast (USD Billion), by Brazil, 2018-2029
      Figure 45: Latin America 3D Mask Machine Market Forecast (USD Billion), by Mexico, 2018-2029
      Figure 46: Latin America 3D Mask Machine Market Forecast (USD Billion), by Rest of Latin America, 2018-2029
      Figure 47: Europe 3D Mask Machine Market Value Share (%), By Segment 1, 2023 & 2029
      Figure 48: Europe 3D Mask Machine Market Forecast (USD Billion), by Sub-Segment 1, 2018-2029
      Figure 49: Europe 3D Mask Machine Market Forecast (USD Billion), by Sub-Segment 2, 2018-2029
      Figure 50: Europe 3D Mask Machine Market Value Share (%), By Segment 2, 2023 & 2029
      Figure 51: Europe 3D Mask Machine Market Forecast (USD Billion), by Sub-Segment 1, 2018-2029
      Figure 52: Europe 3D Mask Machine Market Forecast (USD Billion), by Sub-Segment 2, 2018-2029
      Figure 53: Europe 3D Mask Machine Market Forecast (USD Billion), by Sub-Segment 3, 2018-2029
      Figure 54: Europe 3D Mask Machine Market Forecast (USD Billion), by Others, 2018-2029
      Figure 55: Europe 3D Mask Machine Market Value Share (%), By Segment 3, 2023 & 2029
      Figure 56: Europe 3D Mask Machine Market Forecast (USD Billion), by Sub-Segment 1, 2018-2029
      Figure 57: Europe 3D Mask Machine Market Forecast (USD Billion), by Sub-Segment 2, 2018-2029
      Figure 58: Europe 3D Mask Machine Market Forecast (USD Billion), by Sub-Segment 3, 2018-2029
      Figure 59: Europe 3D Mask Machine Market Forecast (USD Billion), by Others, 2018-2029
      Figure 60: Europe 3D Mask Machine Market Forecast (USD Billion), by U.K., 2018-2029
      Figure 61: Europe 3D Mask Machine Market Forecast (USD Billion), by Germany, 2018-2029
      Figure 62: Europe 3D Mask Machine Market Forecast (USD Billion), by France, 2018-2029
      Figure 63: Europe 3D Mask Machine Market Forecast (USD Billion), by Italy, 2018-2029
      Figure 64: Europe 3D Mask Machine Market Forecast (USD Billion), by Spain, 2018-2029
      Figure 65: Europe 3D Mask Machine Market Forecast (USD Billion), by Russia, 2018-2029
      Figure 66: Europe 3D Mask Machine Market Forecast (USD Billion), by Rest of Europe, 2018-2029
      Figure 67: Asia Pacific 3D Mask Machine Market Value Share (%), By Segment 1, 2023 & 2029
      Figure 68: Asia Pacific 3D Mask Machine Market Forecast (USD Billion), by Sub-Segment 1, 2018-2029
      Figure 69: Asia Pacific 3D Mask Machine Market Forecast (USD Billion), by Sub-Segment 2, 2018-2029
      Figure 70: Asia Pacific 3D Mask Machine Market Value Share (%), By Segment 2, 2023 & 2029
      Figure 71: Asia Pacific 3D Mask Machine Market Forecast (USD Billion), by Sub-Segment 1, 2018-2029
      Figure 72: Asia Pacific 3D Mask Machine Market Forecast (USD Billion), by Sub-Segment 2, 2018-2029
      Figure 73: Asia Pacific 3D Mask Machine Market Forecast (USD Billion), by Sub-Segment 3, 2018-2029
      Figure 74: Asia Pacific 3D Mask Machine Market Forecast (USD Billion), by Others, 2018-2029
      Figure 75: Asia Pacific 3D Mask Machine Market Value Share (%), By Segment 3, 2023 & 2029
      Figure 76: Asia Pacific 3D Mask Machine Market Forecast (USD Billion), by Sub-Segment 1, 2018-2029
      Figure 77: Asia Pacific 3D Mask Machine Market Forecast (USD Billion), by Sub-Segment 2, 2018-2029
      Figure 78: Asia Pacific 3D Mask Machine Market Forecast (USD Billion), by Sub-Segment 3, 2018-2029
      Figure 79: Asia Pacific 3D Mask Machine Market Forecast (USD Billion), by Others, 2018-2029
      Figure 80: Asia Pacific 3D Mask Machine Market Forecast (USD Billion), by China, 2018-2029
      Figure 81: Asia Pacific 3D Mask Machine Market Forecast (USD Billion), by India, 2018-2029
      Figure 82: Asia Pacific 3D Mask Machine Market Forecast (USD Billion), by Japan, 2018-2029
      Figure 83: Asia Pacific 3D Mask Machine Market Forecast (USD Billion), by Australia, 2018-2029
      Figure 84: Asia Pacific 3D Mask Machine Market Forecast (USD Billion), by Southeast Asia, 2018-2029
      Figure 85: Asia Pacific 3D Mask Machine Market Forecast (USD Billion), by Rest of Asia Pacific, 2018-2029
      Figure 86: Middle East & Africa 3D Mask Machine Market Value Share (%), By Segment 1, 2023 & 2029
      Figure 87: Middle East & Africa 3D Mask Machine Market Forecast (USD Billion), by Sub-Segment 1, 2018-2029
      Figure 88: Middle East & Africa 3D Mask Machine Market Forecast (USD Billion), by Sub-Segment 2, 2018-2029
      Figure 89: Middle East & Africa 3D Mask Machine Market Value Share (%), By Segment 2, 2023 & 2029
      Figure 90: Middle East & Africa 3D Mask Machine Market Forecast (USD Billion), by Sub-Segment 1, 2018-2029
      Figure 91: Middle East & Africa 3D Mask Machine Market Forecast (USD Billion), by Sub-Segment 2, 2018-2029
      Figure 92: Middle East & Africa 3D Mask Machine Market Forecast (USD Billion), by Sub-Segment 3, 2018-2029
      Figure 93: Middle East & Africa 3D Mask Machine Market Forecast (USD Billion), by Others, 2018-2029
      Figure 94: Middle East & Africa 3D Mask Machine Market Value Share (%), By Segment 3, 2023 & 2029
      Figure 95: Middle East & Africa 3D Mask Machine Market Forecast (USD Billion), by Sub-Segment 1, 2018-2029
      Figure 96: Middle East & Africa 3D Mask Machine Market Forecast (USD Billion), by Sub-Segment 2, 2018-2029
      Figure 97: Middle East & Africa 3D Mask Machine Market Forecast (USD Billion), by Sub-Segment 3, 2018-2029
      Figure 98: Middle East & Africa 3D Mask Machine Market Forecast (USD Billion), by Others, 2018-2029
      Figure 99: Middle East & Africa 3D Mask Machine Market Forecast (USD Billion), by GCC, 2018-2029
      Figure 100: Middle East & Africa 3D Mask Machine Market Forecast (USD Billion), by South Africa, 2018-2029
      Figure 101: Middle East & Africa 3D Mask Machine Market Forecast (USD Billion), by Rest of Middle East & Africa, 2018-2029 
      List of Tables
      Table 1: Global 3D Mask Machine Market Revenue (USD Billion) Forecast, by Segment 1, 2018-2029
      Table 2: Global 3D Mask Machine Market Revenue (USD Billion) Forecast, by Segment 2, 2018-2029
      Table 3: Global 3D Mask Machine Market Revenue (USD Billion) Forecast, by Segment 3, 2018-2029
      Table 4: Global 3D Mask Machine Market Revenue (USD Billion) Forecast, by Region, 2018-2029
      Table 5: North America 3D Mask Machine Market Revenue (USD Billion) Forecast, by Segment 1, 2018-2029
      Table 6: North America 3D Mask Machine Market Revenue (USD Billion) Forecast, by Segment 2, 2018-2029
      Table 7: North America 3D Mask Machine Market Revenue (USD Billion) Forecast, by Segment 3, 2018-2029
      Table 8: North America 3D Mask Machine Market Revenue (USD Billion) Forecast, by Country, 2018-2029
      Table 9: Europe 3D Mask Machine Market Revenue (USD Billion) Forecast, by Segment 1, 2018-2029
      Table 10: Europe 3D Mask Machine Market Revenue (USD Billion) Forecast, by Segment 2, 2018-2029
      Table 11: Europe 3D Mask Machine Market Revenue (USD Billion) Forecast, by Segment 3, 2018-2029
      Table 12: Europe 3D Mask Machine Market Revenue (USD Billion) Forecast, by Country, 2018-2029
      Table 13: Latin America 3D Mask Machine Market Revenue (USD Billion) Forecast, by Segment 1, 2018-2029
      Table 14: Latin America 3D Mask Machine Market Revenue (USD Billion) Forecast, by Segment 2, 2018-2029
      Table 15: Latin America 3D Mask Machine Market Revenue (USD Billion) Forecast, by Segment 3, 2018-2029
      Table 16: Latin America 3D Mask Machine Market Revenue (USD Billion) Forecast, by Country, 2018-2029
      Table 17: Asia Pacific 3D Mask Machine Market Revenue (USD Billion) Forecast, by Segment 1, 2018-2029
      Table 18: Asia Pacific 3D Mask Machine Market Revenue (USD Billion) Forecast, by Segment 2, 2018-2029
      Table 19: Asia Pacific 3D Mask Machine Market Revenue (USD Billion) Forecast, by Segment 3, 2018-2029
      Table 20: Asia Pacific 3D Mask Machine Market Revenue (USD Billion) Forecast, by Country, 2018-2029
      Table 21: Middle East & Africa 3D Mask Machine Market Revenue (USD Billion) Forecast, by Segment 1, 2018-2029
      Table 22: Middle East & Africa 3D Mask Machine Market Revenue (USD Billion) Forecast, by Segment 2, 2018-2029
      Table 23: Middle East & Africa 3D Mask Machine Market Revenue (USD Billion) Forecast, by Segment 3, 2018-2029
      Table 24: Middle East & Africa 3D Mask Machine Market Revenue (USD Billion) Forecast, by Country, 2018-2029
      Research Process

      Data Library Research are conducted by industry experts who offer insight on industry structure, market segmentations technology assessment and competitive landscape (CL), and penetration, as well as on emerging trends. Their analysis is based on primary interviews (~ 80%) and secondary research (~ 20%) as well as years of professional expertise in their respective industries. Adding to this, by analysing historical trends and current market positions, our analysts predict where the market will be headed for the next five years. Furthermore, the varying trends of segment & categories geographically presented are also studied and the estimated based on the primary & secondary research.

      In this particular report from the supply side Data Library Research has conducted primary surveys (interviews) with the key level executives (VP, CEO’s, Marketing Director, Business Development Manager and SOFT) of the companies that active & prominent as well as the midsized organization

      FIGURE 1: DLR RESEARH PROCESS

      research-methodology1

      Primary Research

      Extensive primary research was conducted to gain a deeper insight of the market and industry performance. The analysis is based on both primary and secondary research as well as years of professional expertise in the respective industries.

      In addition to analysing current and historical trends, our analysts predict where the market is headed over the next five years.

      It varies by segment for these categories geographically presented in the list of market tables. Speaking about this particular report we have conducted primary surveys (interviews) with the key level executives (VP, CEO’s, Marketing Director, Business Development Manager and many more) of the major players active in the market.

      Secondary Research

      Secondary research was mainly used to collect and identify information useful for the extensive, technical, market-oriented, and Friend’s study of the Global Extra Neutral Alcohol. It was also used to obtain key information about major players, market classification and segmentation according to the industry trends, geographical markets, and developments related to the market and technology perspectives. For this study, analysts have gathered information from various credible sources, such as annual reports, sec filings, journals, white papers, SOFT presentations, and company web sites.

      Market Size Estimation

      Both, top-down and bottom-up approaches were used to estimate and validate the size of the Global market and to estimate the size of various other dependent submarkets in the overall Extra Neutral Alcohol. The key players in the market were identified through secondary research and their market contributions in the respective geographies were determined through primary and secondary research.

      Forecast Model

      research-methodology2

      Happy to Assist You

      If you have a question?

      info@datalibraryresearch.com

      IND : +91 955 279 0357

      Browse Related Reports