Aerospace Line Maintenance Market Overview and Analysis
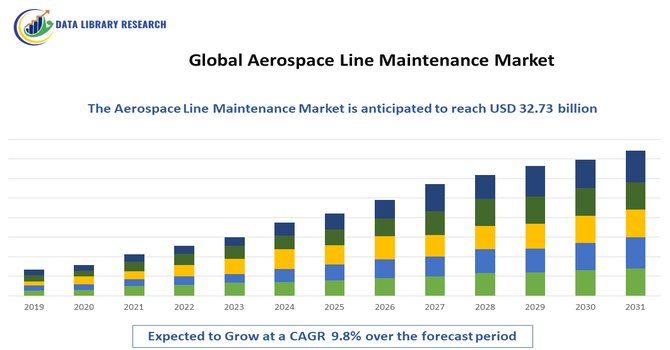
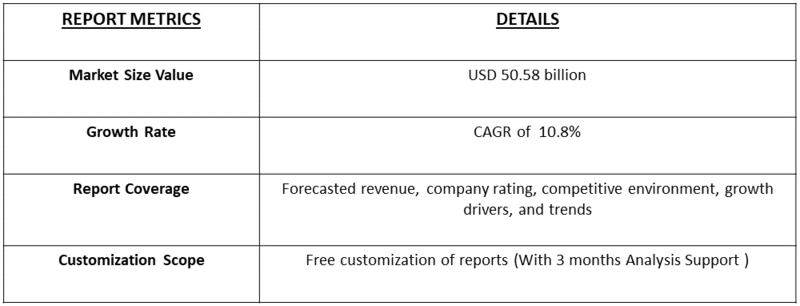
- The Global Aerospace Line Maintenance Market size was valued at USD 23.14 billion in 2025 and is projected to reach USD 32.73 billion by 2032, exhibiting a CAGR of 10.8% during the forecast period, 2025-2032.
Get Complete Analysis Of The Report - Download Updated Free Sample PDF
The Global Aerospace Line Maintenance Market refers to the sector focused on routine, on-the-ground servicing and inspections of aircraft to ensure safety, reliability, and regulatory compliance. It includes activities such as engine checks, avionics testing, fluid refills, and minor repairs conducted between flights. This market is driven by increasing air travel, aging aircraft fleets, and airline demand for quick, efficient turnaround times to minimize downtime and maintain operational efficiency worldwide.
The Global Aerospace Line Maintenance Market is primarily driven by the rapid growth in air travel, especially short-haul and regional flights, which require frequent and quick aircraft checks to ensure safety and operational efficiency. Modern aircraft are increasingly complex, demanding specialized electronic troubleshooting and maintenance at the gate.
Aerospace Line Maintenance Market Latest Trends
The global aircraft line maintenance market is evolving rapidly due to technological innovations. Airlines and service providers are increasingly using AI-based predictive analytics and IoT sensors to detect potential issues before they cause flight delays. Augmented reality is helping technicians troubleshoot remotely, while electronic logbooks simplify compliance and record-keeping. There is also a growing focus on eco-friendly materials and sustainable practices. These trends are enabling maintenance teams to work faster, improve accuracy, reduce downtime, and ensure aircraft remain operational and safe, meeting the increasing demands of global air travel.
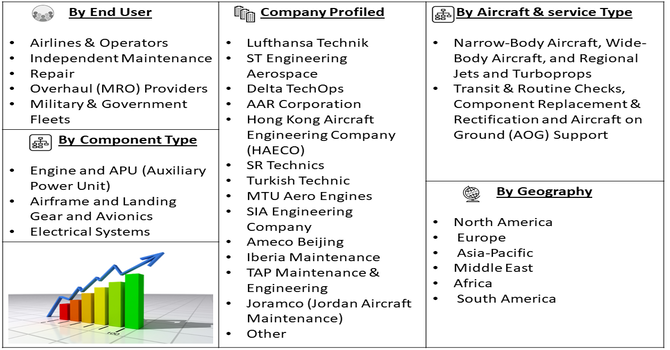
Segmentation: The Global Aircraft Line Maintenance Market is Segmented by Service Type (Transit & Routine Checks, Component Replacement & Rectification and Aircraft on Ground (AOG) Support), Aircraft Type (Narrow-Body Aircraft, Wide-Body Aircraft, and Regional Jets and Turboprops), Component Type (Engine and APU (Auxiliary Power Unit), Airframe and Landing Gear and Avionics and Electrical Systems), End User (Airlines & Operators, Independent Maintenance, Repair, and Overhaul (MRO) Providers and Military & Government Fleets), and Geography (North America, Europe, Asia-Pacific, Middle East and Africa, and South America). The report provides the value (in USD million) for the above segments.
For Detailed Market Segmentation - Get a Free Sample PDF
Market Drivers:
- Exponential Surge in Air Traffic and Fleet Size
The most powerful catalyst for the line maintenance market is the unrelenting growth in global flight movements and the total size of the commercial fleet. As developing economies—particularly in the Asia-Pacific and Middle East—expand their domestic and international routes, the number of daily takeoffs and landings increases exponentially. Every single flight cycle requires a transit check, a turn-around check, or a quick technical stop check, all falling under line maintenance. This constant activity ensures that demand is directly proportional to flight frequency, forcing airlines to rely heavily on swift, efficient ramp services to meet their demanding scheduling and utilization targets, regardless of the aircraft type.
- Technological Integration and Demand for MRO Specialization
The integration of advanced avionics, complex fly-by-wire systems, and data-driven engines necessitates a higher level of technical sophistication for gate-side troubleshooting. Line maintenance is evolving from simple visual checks to complex digital diagnostic work, requiring specialized tooling and licensed expertise for the latest airframes like the A350 and 787. This complexity often pushes airlines to outsource to major independent MRO (Maintenance, Repair, and Overhaul) providers who can afford the costly training and equipment, effectively driving revenue towards global maintenance specialists who offer broad, specialized coverage across multiple jurisdictions.
Market Restraints
- Critical Shortage of Licensed Technicians
The primary factor significantly hindering market growth is the acute, worldwide shortage of highly qualified and appropriately licensed aircraft maintenance engineers (AMEs), specifically those certified for line maintenance operations. This constraint is worsened by an aging workforce nearing retirement and the time-consuming, expensive nature of obtaining specialized type ratings for newer aircraft models. The scarcity of qualified staff inflates labor costs, often leading to service backlogs and increased ground time for aircraft. Furthermore, this limits the ability of MROs and airlines to rapidly scale operations in new or rapidly growing geographical hubs, dampening overall market expansion capacity.
Socio economic Impact on Aerospace Line Maintenance Market
Line maintenance is vital for aviation safety and has significant economic benefits. The demand for skilled maintenance technicians creates employment opportunities and supports local economies. Efficient and predictive maintenance reduces flight delays and cancellations, improving airline reliability and passenger satisfaction. Outsourcing maintenance helps airlines save costs, which can be reinvested or passed on to consumers. As the industry adopts sustainable practices, environmental benefits also emerge, contributing to a greener aviation sector while ensuring continued growth and technological advancement in line maintenance services.
Segmental Analysis:
- Transit & Routine Checks segment is expected to witness highest growth over the forecast period
The transit and routine checks segment is expected to see the highest growth because airlines need frequent inspections to keep planes safe and on schedule. These checks are quick, preventive, and performed between flights or at scheduled intervals, ensuring that minor issues are caught before they become major problems. With the increase in air travel and tighter schedules, airlines rely heavily on these inspections to minimize delays. Advances in digital tools, predictive maintenance, and mobile diagnostics make routine checks faster and more efficient, further driving demand in this segment across global fleets.
- Wide-Body Aircraft segment is expected to witness highest growth over the forecast period
The wide-body aircraft segment is predicted to grow the fastest due to rising long-haul passenger travel and cargo transport. Airlines are investing in larger planes to carry more passengers and goods over longer distances efficiently. Modern wide-body aircraft are more fuel-efficient, comfortable, and technologically advanced, making them an attractive option for airlines operating international routes. Growth in global trade, tourism, and cross-continental travel further boosts demand. Maintenance needs for these large aircraft, including engines, avionics, and airframes, create a steady requirement for MRO services, driving growth in this segment over the forecast period.
- Airframe and Landing Gear segment is expected to witness highest growth over the forecast period
The airframe and landing gear segment is expected to experience high growth as these components are critical for aircraft safety and performance. Landing gear and airframe inspections, repairs, and overhauls are essential due to constant wear from takeoffs, landings, and turbulence. Increasing airline fleets and the introduction of more sophisticated aircraft with advanced structural components are raising demand for specialized MRO services. Additionally, stricter safety regulations and longer service life requirements for aircraft encourage frequent maintenance of these components. This consistent need for inspection, repair, and replacement is driving growth in the airframe and landing gear segment.
- Airlines & Operators segment is expected to witness highest growth over the forecast period
The airlines and operators segment is expected to witness the highest growth because commercial carriers are the primary users of maintenance, repair, and overhaul services. As air travel continues to rebound globally, airlines require regular maintenance to ensure safety, compliance, and operational efficiency. Operators are increasingly outsourcing MRO services to save costs and focus on core operations. Technological advancements like predictive maintenance, digital tracking, and automation help airlines reduce downtime and manage their fleets more efficiently. Rising air passenger traffic, fleet expansion, and the need to comply with stringent aviation regulations are all contributing to rapid growth in this segment.
- North American Region is expected to witness highest growth over the forecast period
North America is expected to see the highest growth in the aerospace MRO market due to its large and mature aviation industry. The United States has one of the busiest airspaces in the world, with high passenger traffic, extensive domestic and international routes, and a large fleet of commercial aircraft.
Strong government regulations, advanced technological adoption, and the presence of major airlines and independent MRO providers drive demand for high-quality maintenance services. Investments in predictive maintenance, digital tools, and advanced repair facilities further strengthen the market. The combination of rising air travel and sophisticated infrastructure makes North America the fastest-growing region.
Additionally, North America benefits from a well-established network of maintenance, repair, and overhaul (MRO) facilities capable of handling complex aircraft systems and components. The presence of leading aerospace manufacturers and global MRO service providers fosters innovation and efficiency, while continuous training programs ensure a skilled workforce. Growing focus on sustainability, fuel efficiency, and reducing aircraft downtime has further accelerated investments in advanced MRO solutions, reinforcing North America’s position as the leading and fastest-growing region in the global aerospace MRO market.
To Learn More About This Report - Request a Free Sample Copy
Aerospace Line Maintenance Market Competitive Landscape
Competition in the line maintenance market comes from both airline-owned units and specialized third-party maintenance providers. Major players, such as Lufthansa Technik, ST Engineering, AFI KLM E&M, and SR Technics, dominate the sector, while smaller providers gain ground through digital solutions and outsourced services. Airlines are increasingly outsourcing line maintenance to reduce costs and improve flexibility. Companies are investing in predictive technologies, remote diagnostics, and faster turnaround capabilities to stand out. Expansion into regional airports and global networks is also helping providers capture more business and offer better service coverage.
The major players for above market:
- Lufthansa Technik
- Air France–KLM Engineering & Maintenance (AFI KLM E&M)
- ST Engineering Aerospace
- Delta TechOps
- AAR Corporation
- Hong Kong Aircraft Engineering Company (HAECO)
- SR Technics
- Turkish Technic
- MTU Aero Engines
- SIA Engineering Company
- Ameco Beijing
- Iberia Maintenance
- TAP Maintenance & Engineering
- Joramco (Jordan Aircraft Maintenance)
- Sabena Technics
- FL Technics
- Aeroman
- GAMECO (Guangzhou Aircraft Maintenance)
- Aviation Technical Services (ATS)
- EgyptAir Maintenance & Engineering
Recent Development
- In November 2025, Palantir and FTAI Aviation Ltd., announced a multi-year strategic partnership. Under this agreement, FTAI leveraged Palantir’s Artificial Intelligence Platform (AIP) across its worldwide maintenance operations. The collaboration aimed to enhance operational efficiency, improve predictive maintenance, and optimize resource allocation across FTAI’s global facilities, strengthening the company’s ability to deliver timely, high-quality maintenance services while integrating advanced AI-driven insights into its workflows.
- In November 2025, Collins Aerospace, was selected by Qatar Airways to implement its Ascentia analytics solution across the airline’s 52 Boeing 787 aircraft. Announced at the Dubai Air Show, the deployment of Ascentia aimed to transform fleet maintenance management by enhancing reliability, lowering operational costs, and streamlining processes. The solution also sought to improve passenger experience by minimizing disruptions and delays, allowing Qatar Airways to operate more efficiently while leveraging advanced analytics for predictive maintenance and overall fleet optimization.
Frequently Asked Questions (FAQ) :
Q1. What are the main growth-driving factors for this market?
The market is growing mainly because more people are flying, especially on short regional trips, which means aircraft need frequent quick checks. Modern planes are more complex and need specialized electronic troubleshooting. Airlines also want to keep planes flying as much as possible, so fast, efficient maintenance is essential to reduce downtime.
Q2. What are the main restraining factors for this market?
The shortage of skilled line maintenance engineers, especially those trained on newer aircraft. This raises labor costs and can cause delays. Busy airport space and unexpected maintenance needs also disrupt schedules and add operational risks.
Q3. Which segment is expected to witness high growth?
The growth of the wide-body aircraft segment is primarily driven by the rising demand for long-haul international travel and cargo transport. Airlines are increasingly opting for larger aircraft to maximize passenger capacity and reduce per-seat operating costs on high-traffic routes. Additionally, the expansion of global trade and e-commerce is boosting demand for efficient cargo carriers.
Q4. Who are the top major players for this market?
Key players include Lufthansa Technik, ST Engineering Aerospace, AFI KLM E&M, and SR Technics. They compete by expanding networks, offering quick Aircraft on Ground (AOG) support, and servicing a wide range of airframes and engines globally.
Q5. Which country is the largest player?
The United States leads the market due to high domestic air traffic, frequent departures, and numerous airline MRO providers. Strong FAA regulations and a technology-focused environment make it a highly active line maintenance market.
List of Figures
Figure 1: Global Aerospace Line Maintenance Market Revenue Breakdown (USD Billion, %) by Region, 2022 & 2029
Figure 2: Global Aerospace Line Maintenance Market Value Share (%), By Segment 1, 2022 & 2029
Figure 3: Global Aerospace Line Maintenance Market Forecast (USD Billion), by Sub-Segment 1, 2018-2029
Figure 4: Global Aerospace Line Maintenance Market Forecast (USD Billion), by Sub-Segment 2, 2018-2029
Figure 5: Global Aerospace Line Maintenance Market Value Share (%), By Segment 2, 2022 & 2029
Figure 6: Global Aerospace Line Maintenance Market Forecast (USD Billion), by Sub-Segment 1, 2018-2029
Figure 7: Global Aerospace Line Maintenance Market Forecast (USD Billion), by Sub-Segment 2, 2018-2029
Figure 8: Global Aerospace Line Maintenance Market Forecast (USD Billion), by Sub-Segment 3, 2018-2029
Figure 9: Global Aerospace Line Maintenance Market Forecast (USD Billion), by Others, 2018-2029
Figure 10: Global Aerospace Line Maintenance Market Value Share (%), By Segment 3, 2022 & 2029
Figure 11: Global Aerospace Line Maintenance Market Forecast (USD Billion), by Sub-Segment 1, 2018-2029
Figure 12: Global Aerospace Line Maintenance Market Forecast (USD Billion), by Sub-Segment 2, 2018-2029
Figure 13: Global Aerospace Line Maintenance Market Forecast (USD Billion), by Sub-Segment 3, 2018-2029
Figure 14: Global Aerospace Line Maintenance Market Forecast (USD Billion), by Others, 2018-2029
Figure 15: Global Aerospace Line Maintenance Market Value (USD Billion), by Region, 2022 & 2029
Figure 16: North America Aerospace Line Maintenance Market Value Share (%), By Segment 1, 2022 & 2029
Figure 17: North America Aerospace Line Maintenance Market Forecast (USD Billion), by Sub-Segment 1, 2018-2029
Figure 18: North America Aerospace Line Maintenance Market Forecast (USD Billion), by Sub-Segment 2, 2018-2029
Figure 19: North America Aerospace Line Maintenance Market Value Share (%), By Segment 2, 2022 & 2029
Figure 20: North America Aerospace Line Maintenance Market Forecast (USD Billion), by Sub-Segment 1, 2018-2029
Figure 21: North America Aerospace Line Maintenance Market Forecast (USD Billion), by Sub-Segment 2, 2018-2029
Figure 22: North America Aerospace Line Maintenance Market Forecast (USD Billion), by Sub-Segment 3, 2018-2029
Figure 23: North America Aerospace Line Maintenance Market Forecast (USD Billion), by Others, 2018-2029
Figure 24: North America Aerospace Line Maintenance Market Value Share (%), By Segment 3, 2022 & 2029
Figure 25: North America Aerospace Line Maintenance Market Forecast (USD Billion), by Sub-Segment 1, 2018-2029
Figure 26: North America Aerospace Line Maintenance Market Forecast (USD Billion), by Sub-Segment 2, 2018-2029
Figure 27: North America Aerospace Line Maintenance Market Forecast (USD Billion), by Sub-Segment 3, 2018-2029
Figure 28: North America Aerospace Line Maintenance Market Forecast (USD Billion), by Others, 2018-2029
Figure 29: North America Aerospace Line Maintenance Market Forecast (USD Billion), by U.S., 2018-2029
Figure 30: North America Aerospace Line Maintenance Market Forecast (USD Billion), by Canada, 2018-2029
Figure 31: Latin America Aerospace Line Maintenance Market Value Share (%), By Segment 1, 2022 & 2029
Figure 32: Latin America Aerospace Line Maintenance Market Forecast (USD Billion), by Sub-Segment 1, 2018-2029
Figure 33: Latin America Aerospace Line Maintenance Market Forecast (USD Billion), by Sub-Segment 2, 2018-2029
Figure 34: Latin America Aerospace Line Maintenance Market Value Share (%), By Segment 2, 2022 & 2029
Figure 35: Latin America Aerospace Line Maintenance Market Forecast (USD Billion), by Sub-Segment 1, 2018-2029
Figure 36: Latin America Aerospace Line Maintenance Market Forecast (USD Billion), by Sub-Segment 2, 2018-2029
Figure 37: Latin America Aerospace Line Maintenance Market Forecast (USD Billion), by Sub-Segment 3, 2018-2029
Figure 38: Latin America Aerospace Line Maintenance Market Forecast (USD Billion), by Others, 2018-2029
Figure 39: Latin America Aerospace Line Maintenance Market Value Share (%), By Segment 3, 2022 & 2029
Figure 40: Latin America Aerospace Line Maintenance Market Forecast (USD Billion), by Sub-Segment 1, 2018-2029
Figure 41: Latin America Aerospace Line Maintenance Market Forecast (USD Billion), by Sub-Segment 2, 2018-2029
Figure 42: Latin America Aerospace Line Maintenance Market Forecast (USD Billion), by Sub-Segment 3, 2018-2029
Figure 43: Latin America Aerospace Line Maintenance Market Forecast (USD Billion), by Others, 2018-2029
Figure 44: Latin America Aerospace Line Maintenance Market Forecast (USD Billion), by Brazil, 2018-2029
Figure 45: Latin America Aerospace Line Maintenance Market Forecast (USD Billion), by Mexico, 2018-2029
Figure 46: Latin America Aerospace Line Maintenance Market Forecast (USD Billion), by Rest of Latin America, 2018-2029
Figure 47: Europe Aerospace Line Maintenance Market Value Share (%), By Segment 1, 2022 & 2029
Figure 48: Europe Aerospace Line Maintenance Market Forecast (USD Billion), by Sub-Segment 1, 2018-2029
Figure 49: Europe Aerospace Line Maintenance Market Forecast (USD Billion), by Sub-Segment 2, 2018-2029
Figure 50: Europe Aerospace Line Maintenance Market Value Share (%), By Segment 2, 2022 & 2029
Figure 51: Europe Aerospace Line Maintenance Market Forecast (USD Billion), by Sub-Segment 1, 2018-2029
Figure 52: Europe Aerospace Line Maintenance Market Forecast (USD Billion), by Sub-Segment 2, 2018-2029
Figure 53: Europe Aerospace Line Maintenance Market Forecast (USD Billion), by Sub-Segment 3, 2018-2029
Figure 54: Europe Aerospace Line Maintenance Market Forecast (USD Billion), by Others, 2018-2029
Figure 55: Europe Aerospace Line Maintenance Market Value Share (%), By Segment 3, 2022 & 2029
Figure 56: Europe Aerospace Line Maintenance Market Forecast (USD Billion), by Sub-Segment 1, 2018-2029
Figure 57: Europe Aerospace Line Maintenance Market Forecast (USD Billion), by Sub-Segment 2, 2018-2029
Figure 58: Europe Aerospace Line Maintenance Market Forecast (USD Billion), by Sub-Segment 3, 2018-2029
Figure 59: Europe Aerospace Line Maintenance Market Forecast (USD Billion), by Others, 2018-2029
Figure 60: Europe Aerospace Line Maintenance Market Forecast (USD Billion), by U.K., 2018-2029
Figure 61: Europe Aerospace Line Maintenance Market Forecast (USD Billion), by Germany, 2018-2029
Figure 62: Europe Aerospace Line Maintenance Market Forecast (USD Billion), by France, 2018-2029
Figure 63: Europe Aerospace Line Maintenance Market Forecast (USD Billion), by Italy, 2018-2029
Figure 64: Europe Aerospace Line Maintenance Market Forecast (USD Billion), by Spain, 2018-2029
Figure 65: Europe Aerospace Line Maintenance Market Forecast (USD Billion), by Russia, 2018-2029
Figure 66: Europe Aerospace Line Maintenance Market Forecast (USD Billion), by Rest of Europe, 2018-2029
Figure 67: Asia Pacific Aerospace Line Maintenance Market Value Share (%), By Segment 1, 2022 & 2029
Figure 68: Asia Pacific Aerospace Line Maintenance Market Forecast (USD Billion), by Sub-Segment 1, 2018-2029
Figure 69: Asia Pacific Aerospace Line Maintenance Market Forecast (USD Billion), by Sub-Segment 2, 2018-2029
Figure 70: Asia Pacific Aerospace Line Maintenance Market Value Share (%), By Segment 2, 2022 & 2029
Figure 71: Asia Pacific Aerospace Line Maintenance Market Forecast (USD Billion), by Sub-Segment 1, 2018-2029
Figure 72: Asia Pacific Aerospace Line Maintenance Market Forecast (USD Billion), by Sub-Segment 2, 2018-2029
Figure 73: Asia Pacific Aerospace Line Maintenance Market Forecast (USD Billion), by Sub-Segment 3, 2018-2029
Figure 74: Asia Pacific Aerospace Line Maintenance Market Forecast (USD Billion), by Others, 2018-2029
Figure 75: Asia Pacific Aerospace Line Maintenance Market Value Share (%), By Segment 3, 2022 & 2029
Figure 76: Asia Pacific Aerospace Line Maintenance Market Forecast (USD Billion), by Sub-Segment 1, 2018-2029
Figure 77: Asia Pacific Aerospace Line Maintenance Market Forecast (USD Billion), by Sub-Segment 2, 2018-2029
Figure 78: Asia Pacific Aerospace Line Maintenance Market Forecast (USD Billion), by Sub-Segment 3, 2018-2029
Figure 79: Asia Pacific Aerospace Line Maintenance Market Forecast (USD Billion), by Others, 2018-2029
Figure 80: Asia Pacific Aerospace Line Maintenance Market Forecast (USD Billion), by China, 2018-2029
Figure 81: Asia Pacific Aerospace Line Maintenance Market Forecast (USD Billion), by India, 2018-2029
Figure 82: Asia Pacific Aerospace Line Maintenance Market Forecast (USD Billion), by Japan, 2018-2029
Figure 83: Asia Pacific Aerospace Line Maintenance Market Forecast (USD Billion), by Australia, 2018-2029
Figure 84: Asia Pacific Aerospace Line Maintenance Market Forecast (USD Billion), by Southeast Asia, 2018-2029
Figure 85: Asia Pacific Aerospace Line Maintenance Market Forecast (USD Billion), by Rest of Asia Pacific, 2018-2029
Figure 86: Middle East & Africa Aerospace Line Maintenance Market Value Share (%), By Segment 1, 2022 & 2029
Figure 87: Middle East & Africa Aerospace Line Maintenance Market Forecast (USD Billion), by Sub-Segment 1, 2018-2029
Figure 88: Middle East & Africa Aerospace Line Maintenance Market Forecast (USD Billion), by Sub-Segment 2, 2018-2029
Figure 89: Middle East & Africa Aerospace Line Maintenance Market Value Share (%), By Segment 2, 2022 & 2029
Figure 90: Middle East & Africa Aerospace Line Maintenance Market Forecast (USD Billion), by Sub-Segment 1, 2018-2029
Figure 91: Middle East & Africa Aerospace Line Maintenance Market Forecast (USD Billion), by Sub-Segment 2, 2018-2029
Figure 92: Middle East & Africa Aerospace Line Maintenance Market Forecast (USD Billion), by Sub-Segment 3, 2018-2029
Figure 93: Middle East & Africa Aerospace Line Maintenance Market Forecast (USD Billion), by Others, 2018-2029
Figure 94: Middle East & Africa Aerospace Line Maintenance Market Value Share (%), By Segment 3, 2022 & 2029
Figure 95: Middle East & Africa Aerospace Line Maintenance Market Forecast (USD Billion), by Sub-Segment 1, 2018-2029
Figure 96: Middle East & Africa Aerospace Line Maintenance Market Forecast (USD Billion), by Sub-Segment 2, 2018-2029
Figure 97: Middle East & Africa Aerospace Line Maintenance Market Forecast (USD Billion), by Sub-Segment 3, 2018-2029
Figure 98: Middle East & Africa Aerospace Line Maintenance Market Forecast (USD Billion), by Others, 2018-2029
Figure 99: Middle East & Africa Aerospace Line Maintenance Market Forecast (USD Billion), by GCC, 2018-2029
Figure 100: Middle East & Africa Aerospace Line Maintenance Market Forecast (USD Billion), by South Africa, 2018-2029
Figure 101: Middle East & Africa Aerospace Line Maintenance Market Forecast (USD Billion), by Rest of Middle East & Africa, 2018-2029
List of Tables
Table 1: Global Aerospace Line Maintenance Market Revenue (USD Billion) Forecast, by Segment 1, 2018-2029
Table 2: Global Aerospace Line Maintenance Market Revenue (USD Billion) Forecast, by Segment 2, 2018-2029
Table 3: Global Aerospace Line Maintenance Market Revenue (USD Billion) Forecast, by Segment 3, 2018-2029
Table 4: Global Aerospace Line Maintenance Market Revenue (USD Billion) Forecast, by Region, 2018-2029
Table 5: North America Aerospace Line Maintenance Market Revenue (USD Billion) Forecast, by Segment 1, 2018-2029
Table 6: North America Aerospace Line Maintenance Market Revenue (USD Billion) Forecast, by Segment 2, 2018-2029
Table 7: North America Aerospace Line Maintenance Market Revenue (USD Billion) Forecast, by Segment 3, 2018-2029
Table 8: North America Aerospace Line Maintenance Market Revenue (USD Billion) Forecast, by Country, 2018-2029
Table 9: Europe Aerospace Line Maintenance Market Revenue (USD Billion) Forecast, by Segment 1, 2018-2029
Table 10: Europe Aerospace Line Maintenance Market Revenue (USD Billion) Forecast, by Segment 2, 2018-2029
Table 11: Europe Aerospace Line Maintenance Market Revenue (USD Billion) Forecast, by Segment 3, 2018-2029
Table 12: Europe Aerospace Line Maintenance Market Revenue (USD Billion) Forecast, by Country, 2018-2029
Table 13: Latin America Aerospace Line Maintenance Market Revenue (USD Billion) Forecast, by Segment 1, 2018-2029
Table 14: Latin America Aerospace Line Maintenance Market Revenue (USD Billion) Forecast, by Segment 2, 2018-2029
Table 15: Latin America Aerospace Line Maintenance Market Revenue (USD Billion) Forecast, by Segment 3, 2018-2029
Table 16: Latin America Aerospace Line Maintenance Market Revenue (USD Billion) Forecast, by Country, 2018-2029
Table 17: Asia Pacific Aerospace Line Maintenance Market Revenue (USD Billion) Forecast, by Segment 1, 2018-2029
Table 18: Asia Pacific Aerospace Line Maintenance Market Revenue (USD Billion) Forecast, by Segment 2, 2018-2029
Table 19: Asia Pacific Aerospace Line Maintenance Market Revenue (USD Billion) Forecast, by Segment 3, 2018-2029
Table 20: Asia Pacific Aerospace Line Maintenance Market Revenue (USD Billion) Forecast, by Country, 2018-2029
Table 21: Middle East & Africa Aerospace Line Maintenance Market Revenue (USD Billion) Forecast, by Segment 1, 2018-2029
Table 22: Middle East & Africa Aerospace Line Maintenance Market Revenue (USD Billion) Forecast, by Segment 2, 2018-2029
Table 23: Middle East & Africa Aerospace Line Maintenance Market Revenue (USD Billion) Forecast, by Segment 3, 2018-2029
Table 24: Middle East & Africa Aerospace Line Maintenance Market Revenue (USD Billion) Forecast, by Country, 2018-2029
Research Process
Data Library Research are conducted by industry experts who offer insight on
industry structure, market segmentations technology assessment and competitive landscape (CL), and penetration, as well as on emerging trends. Their analysis is based on primary interviews (~ 80%) and secondary research (~ 20%) as well as years of professional expertise in their respective industries. Adding to this, by analysing historical trends and current market positions, our analysts predict where the market will be headed for the next five years. Furthermore, the varying trends of segment & categories geographically presented are also studied and the estimated based on the primary & secondary research.
In this particular report from the supply side Data Library Research has conducted primary surveys (interviews) with the key level executives (VP, CEO’s, Marketing Director, Business Development Manager
and SOFT) of the companies that active & prominent as well as the midsized organization
FIGURE 1: DLR RESEARH PROCESS
![research-methodology1]()
Primary Research
Extensive primary research was conducted to gain a deeper insight of the market and industry performance. The analysis is based on both primary and secondary research as well as years of professional expertise in the respective industries.
In addition to analysing current and historical trends, our analysts predict where the market is headed over the next five years.
It varies by segment for these categories geographically presented in the list of market tables. Speaking about this particular report we have conducted primary surveys (interviews) with the key level executives (VP, CEO’s, Marketing Director, Business Development Manager and many more) of the major players active in the market.
Secondary Research
Secondary research was mainly used to collect and identify information useful for the extensive, technical, market-oriented, and Friend’s study of the Global Extra Neutral Alcohol. It was also used to obtain key information about major players, market classification and segmentation according to the industry trends, geographical markets, and developments related to the market and technology perspectives. For this study, analysts have gathered information from various credible sources, such as annual reports, sec filings, journals, white papers, SOFT presentations, and company web sites.
Market Size Estimation
Both, top-down and bottom-up approaches were used to estimate and validate the size of the Global market and to estimate the size of various other dependent submarkets in the overall Extra Neutral Alcohol. The key players in the market were identified through secondary research and their market contributions in the respective geographies were determined through primary and secondary research.
Forecast Model
![research-methodology2]()