Optical Fiber Delay Line Market Overview and Analysis
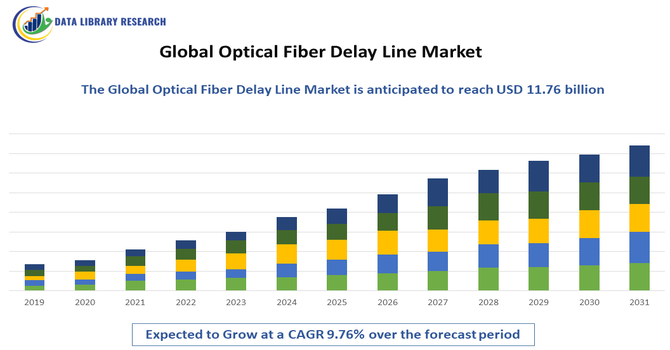
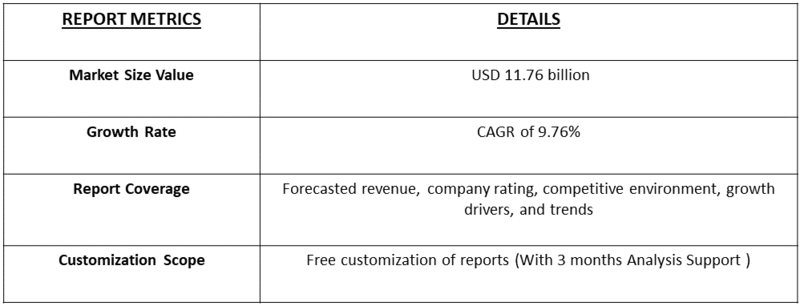
- The Global Optical Fiber Delay Line Market was valued around 2.87 billion in 2025 and expected to reach to USD 11.76 billion by 2032, growing with a CAGR of 9.76% from 2025-2032.
Get Complete Analysis Of The Report - Download Updated Free Sample PDF
The Global Optical Fiber Delay Line Market is experiencing steady growth driven by the expanding adoption of high-speed optical communication systems and the increasing demand for precise signal processing in telecommunications, defense, and sensing applications. Additionally, the surge in fiber-optic sensing technologies for industrial and structural monitoring, along with advancements in coherent optical transmission, further accelerates demand. The push for low-latency, high-bandwidth networks, coupled with continuous R&D investments in fiber-based delay technologies, strengthens the market’s growth momentum globally.
Optical Fiber Delay Line Market Latest Trends
The Global Optical Fiber Delay Line Market is seeing notable trends as demand for high-speed optical communications and precise signal processing grows across industries. A major trend is integration with advanced photonic and coherent technologies, enabling miniaturized, high-performance delay modules that support 5G infrastructure and future 6G research, improving latency control and system efficiency. Furthermore, regional emphasis on upgrading optical networks, especially in North America and Asia Pacific, is driving adoption alongside continuous R&D investment in fiber-based timing and synchronization technologies to enhance network performance and support expanding bandwidth needs.
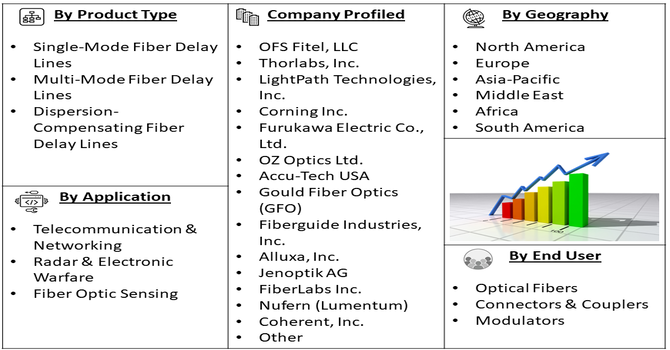
Segmentation: The Global Optical Fiber Delay Line Market is segmented By Type (Single-Mode Fiber Delay Lines, Multi-Mode Fiber Delay Lines, and Dispersion-Compensating Fiber Delay Lines), Component (Optical Fibers, Connectors & Couplers, Modulators), Application (Telecommunication & Networking, Radar & Electronic Warfare, Fiber Optic Sensing), Industry Vertical (Defense & Aerospace, IT & Telecom, Industrial Automation), and Geography (North America, Europe, Asia-Pacific, Middle East and Africa, and South America). The report provides the value (in USD million) for the above segments.
For Detailed Market Segmentation - Get a Free Sample PDF
Market Drivers:
- Growing Adoption of High-Speed Communication Networks
A major driver of the Global Optical Fiber Delay Line Market is the rapid expansion of high-speed communication networks, particularly 5G and the early development of 6G technologies. Optical fiber delay lines play a crucial role in timing control, synchronization, and signal processing for base stations, antennas, and photonic circuits used in these networks. As global data traffic accelerates, communication infrastructures require precise delay management to support massive connectivity, low latency, and high bandwidth performance. Moreover, telecommunication operators are upgrading legacy networks to fiber-rich architectures, increasing the demand for optical delay solutions. The rising integration of photonic components and coherent optical systems further enhances the need for advanced delay lines, driving continuous market growth.
- Increasing Demand for Precision in Defense, Aerospace, and Radar Systems
Another significant driver is the rising use of optical fiber delay lines in defense and aerospace applications, especially for radar, electronic warfare (EW), and signal simulation systems. These delay lines enable highly accurate timing adjustments, phase shifting, and signal propagation control, which are essential for modern radar imaging, target tracking, and threat detection. As global defense budgets rise and countries invest in next-generation warfare technologies, the requirement for precise and stable delay components grows rapidly. Additionally, the shift from electronic to photonic-based systems in defense enhances performance in harsh environments by offering greater immunity to electromagnetic interference. This makes optical fiber delay lines indispensable for mission-critical applications, contributing strongly to market expansion.
Market Restraints:
- High Cost of Advanced Optical Components and System Integration
The major restraints limiting market growth is the high cost associated with optical fiber delay line components, particularly in advanced or tunable systems. Precision optical fibers, modulators, couplers, and control units require sophisticated manufacturing and tight tolerances, driving up production costs. Additionally, integrating these components into photonic systems—such as radar, telecommunication networks, or sensing equipment—demands specialized expertise and expensive testing infrastructure. This makes adoption challenging for small and mid-scale manufacturers or research institutions with limited budgets. As a result, the high initial investment and ongoing maintenance expenses act as a significant barrier, slowing widespread deployment, especially in price-sensitive markets.
Socioeconomic Impact on Optical Fiber Delay Line Market
The socioeconomic impact of the Global Optical Fiber Delay Line Market is increasingly significant as demand for high-speed data transmission accelerates across industries. Growth in this market supports technological innovation in telecommunications, defense, and sensing applications, enabling more efficient network infrastructures and improved communication reliability. As companies adopt advanced fiber-based delay solutions, they generate new skilled employment opportunities in manufacturing, engineering, and research. Emerging economies benefit from increased investment in optical component production and expanded digital connectivity, helping bridge the digital divide.
Segmental Analysis:
- Single-Mode Fiber Delay Lines segment is expected to witness highest growth over the forecast period
Single-Mode Fiber Delay Lines dominate the market due to their superior signal transmission quality, low attenuation, and ability to support long-distance delay with minimal distortion. They are widely used in telecommunications, radar systems, and photonic signal processing where high precision and low loss are essential. As global optical networks expand and demand for high-speed data communication grows, this segment continues to contribute significantly to the market’s overall value in USD million.
- Optical Fibers segment is expected to witness highest growth over the forecast period
Optical Fibers form the foundation of delay line systems and hold a major share in the component segment. Their high reliability, low dispersion, and scalability make them indispensable for generating stable and accurate delays across telecommunication and sensing applications. Increasing deployment of fiber-rich communication infrastructure and advancements in specialty fibers further enhance the value contribution of this segment, driving sustained growth across diverse industries.
- Telecommunication & Networking segment is expected to witness highest growth over the forecast period
The Telecommunication & Networking segment is the largest application area, supported by rapid expansion of high-speed networks, cloud services, and fiber-based Internet infrastructure. Optical fiber delay lines play a critical role in synchronization, phase matching, signal buffering, and latency control within modern communication systems. With global 5G rollout and early 6G research, the demand for precise timing and delay solutions is increasing, making this segment a major revenue generator.
- IT & Telecom segment is expected to witness highest growth over the forecast period
The IT & Telecom industry represents a primary vertical due to its large-scale adoption of photonic components and high reliance on precise signal management. Fiber delay lines enhance network performance, support coherent optical transmission, and improve data processing efficiency. As digital transformation accelerates and bandwidth needs rise, telecom operators increasingly invest in advanced optical technologies, boosting the value of this segment in the global market.
- North America segment is expected to witness highest growth over the forecast period
North America accounts for a strong share of the market owing to its advanced telecommunications infrastructure, active defense research programs, and leadership in photonics innovation. The region’s investments in 5G deployment, electronic warfare systems, and optical sensing technologies create steady demand for optical fiber delay lines. The presence of leading research institutions and technology companies further enhances the region’s contribution to market value in USD million.
In addition, North America’s supportive regulatory environment and strong funding ecosystem accelerate commercialization of advanced optical components, reinforcing its dominant market position. Government initiatives promoting broadband expansion and network modernization continue to drive large-scale adoption of fiber-based technologies across both urban and rural areas. The region also benefits from a mature supply chain, enabling efficient production, integration, and testing of optical fiber delay lines for aerospace, defense, and high-performance computing applications.
Get Complete Analysis Of The Report - Download Updated Free Sample PDF
Optical Fiber Delay Line Market Competitive Landscape
The Global Optical Fiber Delay Line Market is highly competitive, with key players focusing on technological innovation, strategic collaborations, and regional expansion to strengthen their market presence. Companies are investing in advanced photonic technologies, tunable delay lines, and integrated solutions to meet the growing demand from telecommunications, defense, aerospace, and sensing applications.
The major players for this market are:
- OFS Fitel, LLC
- Thorlabs, Inc.
- LightPath Technologies, Inc.
- Corning Inc.
- Furukawa Electric Co., Ltd.
- OZ Optics Ltd.
- Accu-Tech USA
- Gould Fiber Optics (GFO)
- Fiberguide Industries, Inc.
- Alluxa, Inc.
- Jenoptik AG
- FiberLabs Inc.
- Nufern (Lumentum)
- Coherent, Inc.
- Keysight Technologies, Inc.
- Sumitomo Electric Industries, Ltd.
- Advanced Fiber Products
- Alnair Labs, Inc.
- iXblue Photonics
- Boston Applied Technologies
Frequently Asked Questions (FAQ) :
Q1. What are the main growth-driving factors for this market?
The primary driver is the massive global demand for high-speed data transmission and low latency. This includes the widespread rollout of 5G networks, the expansion of large data centers, and the growing use of cloud computing services. Fiber delay lines are essential for managing signals and ensuring network timing accuracy in these complex systems.
Q2. What are the main restraining factors for this market?
The major constraint is the high initial cost and complexity of deploying new fiber optic infrastructure. Installing cables underground or over long distances requires significant financial investment, engineering work, and often faces regulatory hurdles and delays in obtaining necessary permits, especially in rural areas.
Q3. Which segment is expected to witness high growth?
The IT & Telecom segment is poised for the highest growth due to rising data traffic, rapid 5G rollout, increasing cloud adoption, and expanding fiber-optic networks. Demand for high-speed, low-latency communication solutions further accelerates the need for optical fiber delay lines.
Q4. Who are the top major players for this market?
The market is led by major technology and fiber manufacturing giants. Key players include Corning Incorporated, Sumitomo Electric Industries Ltd., and Prysmian Group. These companies dominate by providing the raw fiber, cables, and specialized components necessary for building and maintaining global communication infrastructure.
Q5. Which country is the largest player?
The United States is considered the largest single-country market player in terms of revenue. This dominance is due to heavy investment in 5G and fiber-to-the-home (FTTH) infrastructure, especially with strong government backing and the presence of numerous leading technology and fiber manufacturing corporations.
List of Figures
Figure 1: Global Optical Fiber Delay Line Market Revenue Breakdown (USD Billion, %) by Region, 2022 & 2029
Figure 2: Global Optical Fiber Delay Line Market Value Share (%), By Segment 1, 2022 & 2029
Figure 3: Global Optical Fiber Delay Line Market Forecast (USD Billion), by Sub-Segment 1, 2018-2029
Figure 4: Global Optical Fiber Delay Line Market Forecast (USD Billion), by Sub-Segment 2, 2018-2029
Figure 5: Global Optical Fiber Delay Line Market Value Share (%), By Segment 2, 2022 & 2029
Figure 6: Global Optical Fiber Delay Line Market Forecast (USD Billion), by Sub-Segment 1, 2018-2029
Figure 7: Global Optical Fiber Delay Line Market Forecast (USD Billion), by Sub-Segment 2, 2018-2029
Figure 8: Global Optical Fiber Delay Line Market Forecast (USD Billion), by Sub-Segment 3, 2018-2029
Figure 9: Global Optical Fiber Delay Line Market Forecast (USD Billion), by Others, 2018-2029
Figure 10: Global Optical Fiber Delay Line Market Value Share (%), By Segment 3, 2022 & 2029
Figure 11: Global Optical Fiber Delay Line Market Forecast (USD Billion), by Sub-Segment 1, 2018-2029
Figure 12: Global Optical Fiber Delay Line Market Forecast (USD Billion), by Sub-Segment 2, 2018-2029
Figure 13: Global Optical Fiber Delay Line Market Forecast (USD Billion), by Sub-Segment 3, 2018-2029
Figure 14: Global Optical Fiber Delay Line Market Forecast (USD Billion), by Others, 2018-2029
Figure 15: Global Optical Fiber Delay Line Market Value (USD Billion), by Region, 2022 & 2029
Figure 16: North America Optical Fiber Delay Line Market Value Share (%), By Segment 1, 2022 & 2029
Figure 17: North America Optical Fiber Delay Line Market Forecast (USD Billion), by Sub-Segment 1, 2018-2029
Figure 18: North America Optical Fiber Delay Line Market Forecast (USD Billion), by Sub-Segment 2, 2018-2029
Figure 19: North America Optical Fiber Delay Line Market Value Share (%), By Segment 2, 2022 & 2029
Figure 20: North America Optical Fiber Delay Line Market Forecast (USD Billion), by Sub-Segment 1, 2018-2029
Figure 21: North America Optical Fiber Delay Line Market Forecast (USD Billion), by Sub-Segment 2, 2018-2029
Figure 22: North America Optical Fiber Delay Line Market Forecast (USD Billion), by Sub-Segment 3, 2018-2029
Figure 23: North America Optical Fiber Delay Line Market Forecast (USD Billion), by Others, 2018-2029
Figure 24: North America Optical Fiber Delay Line Market Value Share (%), By Segment 3, 2022 & 2029
Figure 25: North America Optical Fiber Delay Line Market Forecast (USD Billion), by Sub-Segment 1, 2018-2029
Figure 26: North America Optical Fiber Delay Line Market Forecast (USD Billion), by Sub-Segment 2, 2018-2029
Figure 27: North America Optical Fiber Delay Line Market Forecast (USD Billion), by Sub-Segment 3, 2018-2029
Figure 28: North America Optical Fiber Delay Line Market Forecast (USD Billion), by Others, 2018-2029
Figure 29: North America Optical Fiber Delay Line Market Forecast (USD Billion), by U.S., 2018-2029
Figure 30: North America Optical Fiber Delay Line Market Forecast (USD Billion), by Canada, 2018-2029
Figure 31: Latin America Optical Fiber Delay Line Market Value Share (%), By Segment 1, 2022 & 2029
Figure 32: Latin America Optical Fiber Delay Line Market Forecast (USD Billion), by Sub-Segment 1, 2018-2029
Figure 33: Latin America Optical Fiber Delay Line Market Forecast (USD Billion), by Sub-Segment 2, 2018-2029
Figure 34: Latin America Optical Fiber Delay Line Market Value Share (%), By Segment 2, 2022 & 2029
Figure 35: Latin America Optical Fiber Delay Line Market Forecast (USD Billion), by Sub-Segment 1, 2018-2029
Figure 36: Latin America Optical Fiber Delay Line Market Forecast (USD Billion), by Sub-Segment 2, 2018-2029
Figure 37: Latin America Optical Fiber Delay Line Market Forecast (USD Billion), by Sub-Segment 3, 2018-2029
Figure 38: Latin America Optical Fiber Delay Line Market Forecast (USD Billion), by Others, 2018-2029
Figure 39: Latin America Optical Fiber Delay Line Market Value Share (%), By Segment 3, 2022 & 2029
Figure 40: Latin America Optical Fiber Delay Line Market Forecast (USD Billion), by Sub-Segment 1, 2018-2029
Figure 41: Latin America Optical Fiber Delay Line Market Forecast (USD Billion), by Sub-Segment 2, 2018-2029
Figure 42: Latin America Optical Fiber Delay Line Market Forecast (USD Billion), by Sub-Segment 3, 2018-2029
Figure 43: Latin America Optical Fiber Delay Line Market Forecast (USD Billion), by Others, 2018-2029
Figure 44: Latin America Optical Fiber Delay Line Market Forecast (USD Billion), by Brazil, 2018-2029
Figure 45: Latin America Optical Fiber Delay Line Market Forecast (USD Billion), by Mexico, 2018-2029
Figure 46: Latin America Optical Fiber Delay Line Market Forecast (USD Billion), by Rest of Latin America, 2018-2029
Figure 47: Europe Optical Fiber Delay Line Market Value Share (%), By Segment 1, 2022 & 2029
Figure 48: Europe Optical Fiber Delay Line Market Forecast (USD Billion), by Sub-Segment 1, 2018-2029
Figure 49: Europe Optical Fiber Delay Line Market Forecast (USD Billion), by Sub-Segment 2, 2018-2029
Figure 50: Europe Optical Fiber Delay Line Market Value Share (%), By Segment 2, 2022 & 2029
Figure 51: Europe Optical Fiber Delay Line Market Forecast (USD Billion), by Sub-Segment 1, 2018-2029
Figure 52: Europe Optical Fiber Delay Line Market Forecast (USD Billion), by Sub-Segment 2, 2018-2029
Figure 53: Europe Optical Fiber Delay Line Market Forecast (USD Billion), by Sub-Segment 3, 2018-2029
Figure 54: Europe Optical Fiber Delay Line Market Forecast (USD Billion), by Others, 2018-2029
Figure 55: Europe Optical Fiber Delay Line Market Value Share (%), By Segment 3, 2022 & 2029
Figure 56: Europe Optical Fiber Delay Line Market Forecast (USD Billion), by Sub-Segment 1, 2018-2029
Figure 57: Europe Optical Fiber Delay Line Market Forecast (USD Billion), by Sub-Segment 2, 2018-2029
Figure 58: Europe Optical Fiber Delay Line Market Forecast (USD Billion), by Sub-Segment 3, 2018-2029
Figure 59: Europe Optical Fiber Delay Line Market Forecast (USD Billion), by Others, 2018-2029
Figure 60: Europe Optical Fiber Delay Line Market Forecast (USD Billion), by U.K., 2018-2029
Figure 61: Europe Optical Fiber Delay Line Market Forecast (USD Billion), by Germany, 2018-2029
Figure 62: Europe Optical Fiber Delay Line Market Forecast (USD Billion), by France, 2018-2029
Figure 63: Europe Optical Fiber Delay Line Market Forecast (USD Billion), by Italy, 2018-2029
Figure 64: Europe Optical Fiber Delay Line Market Forecast (USD Billion), by Spain, 2018-2029
Figure 65: Europe Optical Fiber Delay Line Market Forecast (USD Billion), by Russia, 2018-2029
Figure 66: Europe Optical Fiber Delay Line Market Forecast (USD Billion), by Rest of Europe, 2018-2029
Figure 67: Asia Pacific Optical Fiber Delay Line Market Value Share (%), By Segment 1, 2022 & 2029
Figure 68: Asia Pacific Optical Fiber Delay Line Market Forecast (USD Billion), by Sub-Segment 1, 2018-2029
Figure 69: Asia Pacific Optical Fiber Delay Line Market Forecast (USD Billion), by Sub-Segment 2, 2018-2029
Figure 70: Asia Pacific Optical Fiber Delay Line Market Value Share (%), By Segment 2, 2022 & 2029
Figure 71: Asia Pacific Optical Fiber Delay Line Market Forecast (USD Billion), by Sub-Segment 1, 2018-2029
Figure 72: Asia Pacific Optical Fiber Delay Line Market Forecast (USD Billion), by Sub-Segment 2, 2018-2029
Figure 73: Asia Pacific Optical Fiber Delay Line Market Forecast (USD Billion), by Sub-Segment 3, 2018-2029
Figure 74: Asia Pacific Optical Fiber Delay Line Market Forecast (USD Billion), by Others, 2018-2029
Figure 75: Asia Pacific Optical Fiber Delay Line Market Value Share (%), By Segment 3, 2022 & 2029
Figure 76: Asia Pacific Optical Fiber Delay Line Market Forecast (USD Billion), by Sub-Segment 1, 2018-2029
Figure 77: Asia Pacific Optical Fiber Delay Line Market Forecast (USD Billion), by Sub-Segment 2, 2018-2029
Figure 78: Asia Pacific Optical Fiber Delay Line Market Forecast (USD Billion), by Sub-Segment 3, 2018-2029
Figure 79: Asia Pacific Optical Fiber Delay Line Market Forecast (USD Billion), by Others, 2018-2029
Figure 80: Asia Pacific Optical Fiber Delay Line Market Forecast (USD Billion), by China, 2018-2029
Figure 81: Asia Pacific Optical Fiber Delay Line Market Forecast (USD Billion), by India, 2018-2029
Figure 82: Asia Pacific Optical Fiber Delay Line Market Forecast (USD Billion), by Japan, 2018-2029
Figure 83: Asia Pacific Optical Fiber Delay Line Market Forecast (USD Billion), by Australia, 2018-2029
Figure 84: Asia Pacific Optical Fiber Delay Line Market Forecast (USD Billion), by Southeast Asia, 2018-2029
Figure 85: Asia Pacific Optical Fiber Delay Line Market Forecast (USD Billion), by Rest of Asia Pacific, 2018-2029
Figure 86: Middle East & Africa Optical Fiber Delay Line Market Value Share (%), By Segment 1, 2022 & 2029
Figure 87: Middle East & Africa Optical Fiber Delay Line Market Forecast (USD Billion), by Sub-Segment 1, 2018-2029
Figure 88: Middle East & Africa Optical Fiber Delay Line Market Forecast (USD Billion), by Sub-Segment 2, 2018-2029
Figure 89: Middle East & Africa Optical Fiber Delay Line Market Value Share (%), By Segment 2, 2022 & 2029
Figure 90: Middle East & Africa Optical Fiber Delay Line Market Forecast (USD Billion), by Sub-Segment 1, 2018-2029
Figure 91: Middle East & Africa Optical Fiber Delay Line Market Forecast (USD Billion), by Sub-Segment 2, 2018-2029
Figure 92: Middle East & Africa Optical Fiber Delay Line Market Forecast (USD Billion), by Sub-Segment 3, 2018-2029
Figure 93: Middle East & Africa Optical Fiber Delay Line Market Forecast (USD Billion), by Others, 2018-2029
Figure 94: Middle East & Africa Optical Fiber Delay Line Market Value Share (%), By Segment 3, 2022 & 2029
Figure 95: Middle East & Africa Optical Fiber Delay Line Market Forecast (USD Billion), by Sub-Segment 1, 2018-2029
Figure 96: Middle East & Africa Optical Fiber Delay Line Market Forecast (USD Billion), by Sub-Segment 2, 2018-2029
Figure 97: Middle East & Africa Optical Fiber Delay Line Market Forecast (USD Billion), by Sub-Segment 3, 2018-2029
Figure 98: Middle East & Africa Optical Fiber Delay Line Market Forecast (USD Billion), by Others, 2018-2029
Figure 99: Middle East & Africa Optical Fiber Delay Line Market Forecast (USD Billion), by GCC, 2018-2029
Figure 100: Middle East & Africa Optical Fiber Delay Line Market Forecast (USD Billion), by South Africa, 2018-2029
Figure 101: Middle East & Africa Optical Fiber Delay Line Market Forecast (USD Billion), by Rest of Middle East & Africa, 2018-2029
List of Tables
Table 1: Global Optical Fiber Delay Line Market Revenue (USD Billion) Forecast, by Segment 1, 2018-2029
Table 2: Global Optical Fiber Delay Line Market Revenue (USD Billion) Forecast, by Segment 2, 2018-2029
Table 3: Global Optical Fiber Delay Line Market Revenue (USD Billion) Forecast, by Segment 3, 2018-2029
Table 4: Global Optical Fiber Delay Line Market Revenue (USD Billion) Forecast, by Region, 2018-2029
Table 5: North America Optical Fiber Delay Line Market Revenue (USD Billion) Forecast, by Segment 1, 2018-2029
Table 6: North America Optical Fiber Delay Line Market Revenue (USD Billion) Forecast, by Segment 2, 2018-2029
Table 7: North America Optical Fiber Delay Line Market Revenue (USD Billion) Forecast, by Segment 3, 2018-2029
Table 8: North America Optical Fiber Delay Line Market Revenue (USD Billion) Forecast, by Country, 2018-2029
Table 9: Europe Optical Fiber Delay Line Market Revenue (USD Billion) Forecast, by Segment 1, 2018-2029
Table 10: Europe Optical Fiber Delay Line Market Revenue (USD Billion) Forecast, by Segment 2, 2018-2029
Table 11: Europe Optical Fiber Delay Line Market Revenue (USD Billion) Forecast, by Segment 3, 2018-2029
Table 12: Europe Optical Fiber Delay Line Market Revenue (USD Billion) Forecast, by Country, 2018-2029
Table 13: Latin America Optical Fiber Delay Line Market Revenue (USD Billion) Forecast, by Segment 1, 2018-2029
Table 14: Latin America Optical Fiber Delay Line Market Revenue (USD Billion) Forecast, by Segment 2, 2018-2029
Table 15: Latin America Optical Fiber Delay Line Market Revenue (USD Billion) Forecast, by Segment 3, 2018-2029
Table 16: Latin America Optical Fiber Delay Line Market Revenue (USD Billion) Forecast, by Country, 2018-2029
Table 17: Asia Pacific Optical Fiber Delay Line Market Revenue (USD Billion) Forecast, by Segment 1, 2018-2029
Table 18: Asia Pacific Optical Fiber Delay Line Market Revenue (USD Billion) Forecast, by Segment 2, 2018-2029
Table 19: Asia Pacific Optical Fiber Delay Line Market Revenue (USD Billion) Forecast, by Segment 3, 2018-2029
Table 20: Asia Pacific Optical Fiber Delay Line Market Revenue (USD Billion) Forecast, by Country, 2018-2029
Table 21: Middle East & Africa Optical Fiber Delay Line Market Revenue (USD Billion) Forecast, by Segment 1, 2018-2029
Table 22: Middle East & Africa Optical Fiber Delay Line Market Revenue (USD Billion) Forecast, by Segment 2, 2018-2029
Table 23: Middle East & Africa Optical Fiber Delay Line Market Revenue (USD Billion) Forecast, by Segment 3, 2018-2029
Table 24: Middle East & Africa Optical Fiber Delay Line Market Revenue (USD Billion) Forecast, by Country, 2018-2029
Research Process
Data Library Research are conducted by industry experts who offer insight on
industry structure, market segmentations technology assessment and competitive landscape (CL), and penetration, as well as on emerging trends. Their analysis is based on primary interviews (~ 80%) and secondary research (~ 20%) as well as years of professional expertise in their respective industries. Adding to this, by analysing historical trends and current market positions, our analysts predict where the market will be headed for the next five years. Furthermore, the varying trends of segment & categories geographically presented are also studied and the estimated based on the primary & secondary research.
In this particular report from the supply side Data Library Research has conducted primary surveys (interviews) with the key level executives (VP, CEO’s, Marketing Director, Business Development Manager
and SOFT) of the companies that active & prominent as well as the midsized organization
FIGURE 1: DLR RESEARH PROCESS
![research-methodology1]()
Primary Research
Extensive primary research was conducted to gain a deeper insight of the market and industry performance. The analysis is based on both primary and secondary research as well as years of professional expertise in the respective industries.
In addition to analysing current and historical trends, our analysts predict where the market is headed over the next five years.
It varies by segment for these categories geographically presented in the list of market tables. Speaking about this particular report we have conducted primary surveys (interviews) with the key level executives (VP, CEO’s, Marketing Director, Business Development Manager and many more) of the major players active in the market.
Secondary Research
Secondary research was mainly used to collect and identify information useful for the extensive, technical, market-oriented, and Friend’s study of the Global Extra Neutral Alcohol. It was also used to obtain key information about major players, market classification and segmentation according to the industry trends, geographical markets, and developments related to the market and technology perspectives. For this study, analysts have gathered information from various credible sources, such as annual reports, sec filings, journals, white papers, SOFT presentations, and company web sites.
Market Size Estimation
Both, top-down and bottom-up approaches were used to estimate and validate the size of the Global market and to estimate the size of various other dependent submarkets in the overall Extra Neutral Alcohol. The key players in the market were identified through secondary research and their market contributions in the respective geographies were determined through primary and secondary research.
Forecast Model
![research-methodology2]()