Artificial Pancreas (AP) Market Overview and Analysis

  • The Global Artificial Pancreas (AP) Market is currently valued at USD 332.3 million in 2026 to reach USD 881.0 million by 2033, registering a CAGR of 10.7% from 2025-2032.

Artificial Pancreas (AP) Market

Get Complete Analysis Of The Report - Download Updated Free Sample PDF

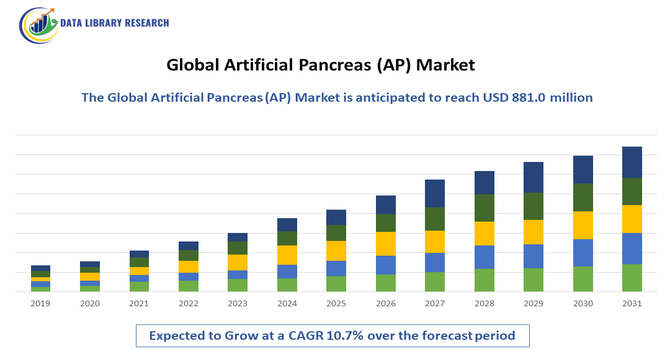
The Global Artificial Pancreas (AP) Market refers to the development, production, and adoption of automated insulin delivery systems designed to help people with diabetes manage their blood glucose levels more effectively. These systems combine continuous glucose monitors (CGMs) with insulin pumps and smart algorithms to mimic the functions of a healthy pancreas. Market growth is driven by the rising prevalence of diabetes, increasing awareness of advanced management solutions, and technological innovations in sensors, software, and wearable devices.

Artificial Pancreas (AP) Market Latest Trends

The Global Artificial Pancreas (AP) Market is witnessing rapid growth driven by technological advancements in continuous glucose monitoring (CGM), smart insulin pumps, and algorithm-based automated insulin delivery (AID) systems. There is a growing adoption of hybrid and fully closed-loop AP systems that reduce hypoglycemia risk and improve glycemic control. Integration with smartphone apps and cloud-based data platforms allows real-time monitoring and remote healthcare management. Increasing focus on wearable, user-friendly devices and the development of AI-driven adaptive insulin algorithms are shaping market trends.

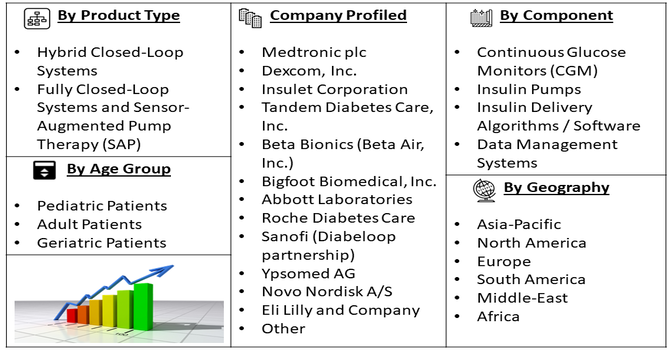
Segmentation: The Global Artificial Pancreas (AP) Market is segmented by Product Type (Hybrid Closed-Loop Systems, Fully Closed-Loop Systems and Sensor-Augmented Pump Therapy (SAP)), Component (Continuous Glucose Monitors (CGM), Insulin Pumps, Insulin Delivery Algorithms / Software and Data Management Systems), Age Group (Pediatric Patients, Adult Patients and Geriatric Patients), and Geography (North America, Europe, Asia-Pacific, Middle East and Africa, and South America). The report provides the value (in USD million) for the above segments.

Artificial Pancreas (AP) Market Segment

For Detailed Market Segmentation - Get a Free Sample PDF

Market Drivers:

  • Rising Diabetes Prevalence and Demand for Automated Glucose Management

The growing prevalence of type 1 diabetes and increasing awareness of the benefits of tight glycemic control have driven demand for artificial pancreas (AP) systems globally. For instance, an article published by Science Direct, reported that an estimated 9.5 million people are living with type 1 diabetes (T1D) in 2024, marking a 13% increase from 8.4 million in 2021. Of these, 1.0 million are aged 0–14 years and 0.8 million are aged 15–19 years. In 2024, over 500,000 new T1D cases were diagnosed worldwide, and approximately 174,000 people died from T1D, including around 30,000 individuals under 25 who were never formally diagnosed, highlighting a significant global health burden among children and adolescents.

Patients and clinicians seek automated solutions to reduce the burden of frequent glucose monitoring and insulin dosing. Hybrid and fully closed-loop systems provide improved time-in-range, reduced hypoglycemia, and enhanced quality of life. Technological advancements in continuous glucose monitors (CGMs), insulin pumps, and smart algorithms have further boosted adoption. Rising patient awareness, supportive healthcare policies, and the need for personalized diabetes management continue to accelerate growth in the global AP market.

  • Technological Advancements and Integration of Smart Algorithms

Continuous innovation in sensor accuracy, insulin delivery mechanisms, and AI-driven algorithms has been a key driver for the artificial pancreas market. Integration of continuous glucose monitoring with smart insulin pumps and adaptive software allows real-time, automated insulin adjustments, enhancing treatment efficacy. Cloud-based data management and smartphone connectivity further improve patient monitoring and engagement.

Ongoing R&D in fully closed-loop systems and machine-learning algorithms is expanding market offerings, making AP systems more user-friendly and reliable. For instance, in 2025, research published by IISc, scientits developed and tested population-specific adaptive control algorithms for an Android-based artificial pancreas (AP) system for Type-1 Diabetes Mellitus patients. Using bolus and basal model predictive control, neuro-adaptive learning, and unscented Kalman filters, the system personalized insulin delivery based on patient data. Clinical trials and FDA-approved in-silico simulations demonstrated autonomous glucose regulation, robustness, and efficacy, highlighting its potential to advance fully closed-loop AP systems and improve diabetes management for millions of patients.

Market Restraints:

  • High Cost and Limited Accessibility

High costs of artificial pancreas systems, including insulin pumps, continuous glucose monitors, and associated software, remain a significant restraint in market growth. Many patients, particularly in low- and middle-income countries, face financial barriers and limited insurance coverage, restricting widespread adoption. Additionally, complex device training, maintenance requirements, and limited availability in rural or underdeveloped regions further hinder accessibility. These factors reduce market penetration despite growing clinical demand. Addressing affordability, expanding reimbursement programs, and increasing patient education are critical to overcoming these challenges. Without these measures, the adoption of AP systems may remain concentrated in developed markets, limiting global market expansion.

Socioeconomic Impact on Artificial Pancreas (AP) Market

Artificial pancreas systems significantly improve the quality of life for patients with type 1 diabetes by reducing the burden of constant glucose monitoring and insulin management. Effective glucose control lowers the risk of long-term complications, such as neuropathy, retinopathy, and cardiovascular issues, which in turn reduces healthcare costs and productivity losses. Broader adoption of AP systems can alleviate societal healthcare burdens, particularly in countries with high diabetes prevalence. However, high device costs and insurance limitations can restrict accessibility, emphasizing the need for supportive reimbursement policies to ensure equitable access and maximize both individual and societal benefits.

Segmental Analysis:

  • Sensor-Augmented Pump Therapy (SAP) segment is expected to witness the highest growth over the forecast period

The Sensor-Augmented Pump Therapy (SAP) segment is expected to witness the highest growth over the forecast period due to its ability to combine continuous glucose monitoring (CGM) with insulin pump therapy for improved glycemic control. SAP systems provide real-time glucose data and alerts, allowing patients to adjust insulin delivery and reduce hypoglycemia risk. Increasing patient preference for integrated, user-friendly devices and rising physician adoption have fueled market expansion. Technological advancements, such as predictive low-glucose suspend and smart connectivity with mobile apps, further enhance usability. Growing awareness and accessibility of SAP therapy in both clinical and home settings are driving sustained growth globally.

  • Insulin Delivery Algorithms / Software segment is expected to witness the highest growth over the forecast period

The Insulin Delivery Algorithms / Software segment is projected to witness the highest growth over the forecast period due to the increasing adoption of intelligent, automated insulin delivery systems. Advanced algorithms integrate CGM data to adjust insulin doses in real time, improving time-in-range and reducing hypoglycemia. AI-based predictive models, cloud connectivity, and personalized treatment adjustments enhance therapy efficiency and patient compliance. Continuous research and development in adaptive algorithms for hybrid and fully closed-loop systems are increasing clinician confidence and adoption rates. These innovations make software a critical growth driver, supporting the broader expansion of artificial pancreas systems worldwide.

  • Paediatric Patients segment is expected to witness the highest growth over the forecast period

The paediatric patients segment is expected to witness the highest growth over the forecast period, driven by increasing diagnosis of type 1 diabetes in children and growing awareness of automated insulin delivery benefits. Artificial pancreas systems reduce caregiver burden, improve glycemic control, and minimize hypoglycemia in young patients. Pediatric-specific device designs, smaller pumps, and user-friendly interfaces enhance adoption. Regulatory approvals for pediatric use and increasing insurance coverage for children have further boosted market demand. Families and clinicians are increasingly adopting these advanced systems to improve quality of life, treatment adherence, and long-term outcomes, making the pediatric segment a key growth area in the global AP market.

  • North America Region is expected to witness the highest growth over the forecast period

North America is expected to witness the highest growth over the forecast period due to a high prevalence of type 1 diabetes, advanced healthcare infrastructure, and strong adoption of innovative diabetes technologies. Supportive reimbursement policies and government initiatives facilitating access to insulin pumps, continuous glucose monitors, and artificial pancreas systems have accelerated market expansion. @@@@ High patient awareness, strong R&D investment, and the presence of key market players like Medtronic, Dexcom, and Tandem Diabetes Care have further driven growth. For instance, in 2025, A University of Virginia study demonstrated that its artificial pancreas system, using “adaptive biobehavioral control” digital twin technology, improved Type 1 diabetes management. The system, updated biweekly and allowing user adjustments, increased time in a healthy blood-sugar range from 72% to 77% and slightly lowered average blood-glucose levels over six months.

Similarly, in 2025, Beta Bionics, Inc. announced plans to integrate its iLet Bionic Pancreas automated insulin delivery system with Abbott’s future dual glucose-ketone sensor in the U.S. The iLet, already compatible with FreeStyle Libre 3 Plus, automatically manages insulin dosing, reducing patient burden and reinforcing Beta Bionics and Abbott’s commitment to advanced diabetes care. Thus, the region leads in hybrid and fully closed-loop system adoption, establishing North America as the largest and fastest-growing market for artificial pancreas solutions globally.

Artificial Pancreas (AP) Market Table

To Learn More About This Report - Request a Free Sample Copy

Artificial Pancreas (AP) Market Competitive Landscape

The Global Artificial Pancreas Market is highly competitive, led by established medical device and diabetes technology companies. Key players focus on research and development of hybrid and fully closed-loop systems, integration with CGMs, and AI-driven algorithms to improve accuracy and user experience. Strategic collaborations, mergers, and acquisitions are common to expand technological capabilities and geographic presence. Companies differentiate through device innovation, patient support programs, and data management platforms. Regulatory approvals and clinical trial outcomes significantly influence market positioning. Emerging startups are also contributing to innovation, intensifying competition while fostering the development of cost-effective, user-friendly, and highly efficient AP solutions globally.

The major players for above market are:

  • Medtronic plc
  • Dexcom, Inc.
  • Insulet Corporation
  • Tandem Diabetes Care, Inc.
  • Beta Bionics (Beta Air, Inc.)
  • Bigfoot Biomedical, Inc.
  • Abbott Laboratories
  • Roche Diabetes Care
  • Sanofi (Diabeloop partnership)
  • Ypsomed AG
  • Novo Nordisk A/S
  • Eli Lilly and Company
  • Bigfoot Biomedical (acquired by Roche)
  • Sogung Co., Ltd. (future AP developers)
  • TypeZero Technologies (acquired by Dexcom)
  • Insulet / Horizon Therapeutics collaborations
  • Cellnovo Group
  • B. Braun Melsungen AG
  • Asante Solutions
  • Sano Intelligence (emerging CGM/AP innovators)

Recent Development

  • In July 2025, an article published by Journal of Diabetes Science and Technology reported that Diabetes Control and Complications Trial (DCCT) highlighted the importance of glucose control in reducing diabetes complications. Subsequent innovations advanced from capillary glucose monitoring to continuous glucose monitoring (CGM) and automated insulin delivery (AID) systems. Research explored algorithm-driven insulin pumps, alternative delivery routes, and additional sensors, supported by the National Institute of Diabetes and Digestive and Kidney Diseases.


  • In January 2025, an article published by Plos One, researchers developed a safe and efficient deep reinforcement learning (DRL)-based adaptive insulin delivery controller for type 1 diabetes, enhancing the PPO algorithm with ten improvements and a dual safety mechanism. In simulations, it achieved 87.45% time-in-range, reduced hypoglycemia, and eliminated severe events, marking a key step toward fully closed-loop artificial pancreas clinical implementation.


Frequently Asked Questions (FAQ) :

Q1. What are the main growth-driving factors for this market?

The market is growing because of the rising global prevalence of Type 1 diabetes and a growing preference for automated glucose management. Advances in sensor technology and "closed-loop" algorithms allow for real-time insulin adjustments, reducing the risk of hypoglycemia. Additionally, increasing healthcare spending and the desire for improved patient quality of life drive adoption.

Q2. What are the main restraining factors for this market?

Growth is limited by the high cost of these sophisticated devices and the ongoing expenses for disposable sensors and infusion sets. Strict regulatory approval processes for life-critical medical devices can delay new product launches. Furthermore, limited reimbursement policies in developing countries and the complexity of training patients to use the systems hinder widespread use.

Q3. Which segment is expected to witness high growth?

The Threshold Suspend/Hybrid Closed-Loop Systems segment is expected to see the highest growth. These devices are popular because they automatically stop insulin delivery when blood sugar drops too low and adjust basal rates throughout the day. Their ability to significantly reduce the daily burden of diabetes management makes them the preferred choice for patients.

Q4. Who are the top major players for this market?

The market is led by major medical technology firms specializing in diabetes care and insulin delivery. Key players include Medtronic, Tandem Diabetes Care, Insulet Corporation, Dexcom, and Abbott Laboratories. These companies dominate by integrating continuous glucose monitors with insulin pumps and developing user-friendly mobile apps for seamless data tracking and management.

Q5. Which country is the largest player?

The United States is the largest player in the artificial pancreas market. This is due to its high healthcare expenditure, advanced research facilities, and a large population of Type 1 diabetes patients. Favorable reimbursement through private insurance and Medicare, along with early FDA approvals for cutting-edge "smart" insulin systems, keeps the U.S. in the lead.

Artificial Pancreas (AP) MARKET STUDY GLOBAL MARKET ANALYSIS, INSIGHTS AND FORECAST, 2020-2027

    1. Introduction

    • 1.1. Research Scope
    • 1.2. Market Segmentation
    • 1.3. Research Methodology
    • 1.4. Definitions and Assumptions

    2. Executive Summary

      3. Market Dynamics

      • 3.1. Market Drivers
      • 3.2. Market Restraints
      • 3.3. Market Opportunities

      4. Key Insights

      • 4.1. Key Emerging Trends – For Major Countries
      • 4.2. Latest Technological Advancement
      • 4.3. Regulatory Landscape
      • 4.4. Industry SWOT Analysis
      • 4.5. Porters Five Forces Analysis

      5. Global Artificial Pancreas (AP) Market Analysis (USD Billion), Insights and Forecast, 2016-2027

      • 5.1. Key Findings / Summary
      • 5.2. Market Analysis, Insights and Forecast – By Segment 1
        • 5.2.1. Sub-Segment 1
        • 5.2.2. Sub-Segment 2
      • 5.3. Market Analysis, Insights and Forecast – By Segment 2
        • 5.3.1. Sub-Segment 1
        • 5.3.2. Sub-Segment 2
        • 5.3.3. Sub-Segment 3
        • 5.3.4. Others
      • 5.4. Market Analysis, Insights and Forecast – By Segment 3
        • 5.4.1. Sub-Segment 1
        • 5.4.2. Sub-Segment 2
        • 5.4.3. Sub-Segment 3
        • 5.4.4. Others
      • 5.5. Market Analysis, Insights and Forecast – By Region
        • 5.5.1. North America
        • 5.5.2. Latin America
        • 5.5.3. Europe
        • 5.5.4. Asia Pacific
        • 5.5.5. Middle East and Africa

      6. North America Artificial Pancreas (AP) Market Analysis (USD Billion), Insights and Forecast, 2016-2027

      • 6.1. Key Findings / Summary
      • 6.2. Market Analysis, Insights and Forecast – By Segment 1
        • 6.2.1. Sub-Segment 1
        • 6.2.2. Sub-Segment 2
      • 6.3. Market Analysis, Insights and Forecast – By Segment 2
        • 6.3.1. Sub-Segment 1
        • 6.3.2. Sub-Segment 2
        • 6.3.3. Sub-Segment 3
        • 6.3.4. Others
      • 6.4. Market Analysis, Insights and Forecast – By Segment 3
        • 6.4.1. Sub-Segment 1
        • 6.4.2. Sub-Segment 2
        • 6.4.3. Sub-Segment 3
        • 6.4.4. Others
      • 6.5. Market Analysis, Insights and Forecast – By Country
        • 6.5.1. U.S.
        • 6.5.2. Canada

      7. Latin America Artificial Pancreas (AP) Market Analysis (USD Billion), Insights and Forecast, 2016-2027

      • 7.1. Key Findings / Summary
      • 7.2. Market Analysis, Insights and Forecast – By Segment 1
        • 7.2.1. Sub-Segment 1
        • 7.2.2. Sub-Segment 2
      • 7.3. Market Analysis, Insights and Forecast – By Segment 2
        • 7.3.1. Sub-Segment 1
        • 7.3.2. Sub-Segment 2
        • 7.3.3. Sub-Segment 3
        • 7.3.4. Others
      • 7.4. Market Analysis, Insights and Forecast – By Segment 3
        • 7.4.1. Sub-Segment 1
        • 7.4.2. Sub-Segment 2
        • 7.4.3. Sub-Segment 3
        • 7.4.4. Others
      • 7.5. Insights and Forecast – By Country
        • 7.5.1. Brazil
        • 7.5.2. Mexico
        • 7.5.3. Rest of Latin America

      8. Europe Artificial Pancreas (AP) Market Analysis (USD Billion), Insights and Forecast, 2016-2027

      • 8.1. Key Findings / Summary
      • 8.2. Market Analysis, Insights and Forecast – By Segment 1
        • 8.2.1. Sub-Segment 1
        • 8.2.2. Sub-Segment 2
      • 8.3. Market Analysis, Insights and Forecast – By Segment 2
        • 8.3.1. Sub-Segment 1
        • 8.3.2. Sub-Segment 2
        • 8.3.3. Sub-Segment 3
        • 8.3.4. Others
      • 8.4. Market Analysis, Insights and Forecast – By Segment 3
        • 8.4.1. Sub-Segment 1
        • 8.4.2. Sub-Segment 2
        • 8.4.3. Sub-Segment 3
        • 8.4.4. Others
      • 8.5. Market Analysis, Insights and Forecast – By Country
        • 8.5.1. UK
        • 8.5.2. Germany
        • 8.5.3. France
        • 8.5.4. Italy
        • 8.5.5. Spain
        • 8.5.6. Russia
        • 8.5.7. Rest of Europe

      9. Asia Pacific Artificial Pancreas (AP) Market Analysis (USD Billion), Insights and Forecast, 2016-2027

      • 9.1. Key Findings / Summary
      • 9.2. Market Analysis, Insights and Forecast – By Segment 1
        • 9.2.1. Sub-Segment 1
        • 9.2.2. Sub-Segment 2
      • 9.3. Market Analysis, Insights and Forecast – By Segment 2
        • 9.3.1. Sub-Segment 1
        • 9.3.2. Sub-Segment 2
        • 9.3.3. Sub-Segment 3
        • 9.3.4. Others
      • 9.4. Market Analysis, Insights and Forecast – By Segment 3
        • 9.4.1. Sub-Segment 1
        • 9.4.2. Sub-Segment 2
        • 9.4.3. Sub-Segment 3
        • 9.4.4. Others
      • 9.5. Market Analysis, Insights and Forecast – By Country
        • 9.5.1. China
        • 9.5.2. India
        • 9.5.3. Japan
        • 9.5.4. Australia
        • 9.5.5. South East Asia
        • 9.5.6. Rest of Asia Pacific

      10. Middle East & Africa Artificial Pancreas (AP) Market Analysis (USD Billion), Insights and Forecast, 2016-2027

      • 10.1. Key Findings / Summary
      • 10.2. Market Analysis, Insights and Forecast – By Segment 1
        • 10.2.1. Sub-Segment 1
        • 10.2.2. Sub-Segment 2
      • 10.3. Market Analysis, Insights and Forecast – By Segment 2
        • 10.3.1. Sub-Segment 1
        • 10.3.2. Sub-Segment 2
        • 10.3.3. Sub-Segment 3
        • 10.3.4. Others
      • 10.4. Market Analysis, Insights and Forecast – By Segment 3
        • 10.4.1. Sub-Segment 1
        • 10.4.2. Sub-Segment 2
        • 10.4.3. Sub-Segment 3
        • 10.4.4. Others
      • 10.5. Market Analysis, Insights and Forecast – By Country
        • 10.5.1. GCC
        • 10.5.2. South Africa
        • 10.5.3. Rest of Middle East & Africa

      11. Competitive Analysis

      • 11.1. Company Market Share Analysis, 2018
      • 11.2. Key Industry Developments
      • 11.3. Company Profile
        • 11.3.1. Company 1
          • 11.3.1.1. Business Overview
          • 11.3.1.2. Segment 1 & Service Offering
          • 11.3.1.3. Overall Revenue
          • 11.3.1.4. Geographic Presence
          • 11.3.1.5. Recent Development
        *Similar details will be provided for the following companies
        • 11.3.2. Company 2
        • 11.3.3. Company 3
        • 11.3.4. Company 4
        • 11.3.5. Company 5
        • 11.3.6. Company 6
        • 11.3.7. Company 7
        • 11.3.8. Company 8
        • 11.3.9. Company 9
        • 11.3.10. Company 10
        • 11.3.11. Company 11
        • 11.3.12. Company 12
      List of Figures

      Figure 1: Global Artificial Pancreas (AP) Market Revenue Breakdown (USD Billion, %) by Region, 2019 & 2027
      Figure 2: Global Artificial Pancreas (AP) Market Value Share (%), By Segment 1, 2019 & 2027
      Figure 3: Global Artificial Pancreas (AP) Market Forecast (USD Billion), by Sub-Segment 1, 2016-2027
      Figure 4: Global Artificial Pancreas (AP) Market Forecast (USD Billion), by Sub-Segment 2, 2016-2027
      Figure 5: Global Artificial Pancreas (AP) Market Value Share (%), By Segment 2, 2019 & 2027
      Figure 6: Global Artificial Pancreas (AP) Market Forecast (USD Billion), by Sub-Segment 1, 2016-2027
      Figure 7: Global Artificial Pancreas (AP) Market Forecast (USD Billion), by Sub-Segment 2, 2016-2027
      Figure 8: Global Artificial Pancreas (AP) Market Forecast (USD Billion), by Sub-Segment 3, 2016-2027
      Figure 9: Global Artificial Pancreas (AP) Market Forecast (USD Billion), by Others, 2016-2027
      Figure 10: Global Artificial Pancreas (AP) Market Value Share (%), By Segment 3, 2019 & 2027
      Figure 11: Global Artificial Pancreas (AP) Market Forecast (USD Billion), by Sub-Segment 1, 2016-2027
      Figure 12: Global Artificial Pancreas (AP) Market Forecast (USD Billion), by Sub-Segment 2, 2016-2027
      Figure 13: Global Artificial Pancreas (AP) Market Forecast (USD Billion), by Sub-Segment 3, 2016-2027
      Figure 14: Global Artificial Pancreas (AP) Market Forecast (USD Billion), by Others, 2016-2027
      Figure 15: Global Artificial Pancreas (AP) Market Value (USD Billion), by Region, 2019 & 2027
      Figure 16: North America Artificial Pancreas (AP) Market Value Share (%), By Segment 1, 2019 & 2027
      Figure 17: North America Artificial Pancreas (AP) Market Forecast (USD Billion), by Sub-Segment 1, 2016-2027
      Figure 18: North America Artificial Pancreas (AP) Market Forecast (USD Billion), by Sub-Segment 2, 2016-2027
      Figure 19: North America Artificial Pancreas (AP) Market Value Share (%), By Segment 2, 2019 & 2027
      Figure 20: North America Artificial Pancreas (AP) Market Forecast (USD Billion), by Sub-Segment 1, 2016-2027
      Figure 21: North America Artificial Pancreas (AP) Market Forecast (USD Billion), by Sub-Segment 2, 2016-2027
      Figure 22: North America Artificial Pancreas (AP) Market Forecast (USD Billion), by Sub-Segment 3, 2016-2027
      Figure 23: North America Artificial Pancreas (AP) Market Forecast (USD Billion), by Others, 2016-2027
      Figure 24: North America Artificial Pancreas (AP) Market Value Share (%), By Segment 3, 2019 & 2027
      Figure 25: North America Artificial Pancreas (AP) Market Forecast (USD Billion), by Sub-Segment 1, 2016-2027
      Figure 26: North America Artificial Pancreas (AP) Market Forecast (USD Billion), by Sub-Segment 2, 2016-2027
      Figure 27: North America Artificial Pancreas (AP) Market Forecast (USD Billion), by Sub-Segment 3, 2016-2027
      Figure 28: North America Artificial Pancreas (AP) Market Forecast (USD Billion), by Others, 2016-2027
      Figure 29: North America Artificial Pancreas (AP) Market Forecast (USD Billion), by U.S., 2016-2027
      Figure 30: North America Artificial Pancreas (AP) Market Forecast (USD Billion), by Canada, 2016-2027
      Figure 31: Latin America Artificial Pancreas (AP) Market Value Share (%), By Segment 1, 2019 & 2027
      Figure 32: Latin America Artificial Pancreas (AP) Market Forecast (USD Billion), by Sub-Segment 1, 2016-2027
      Figure 33: Latin America Artificial Pancreas (AP) Market Forecast (USD Billion), by Sub-Segment 2, 2016-2027
      Figure 34: Latin America Artificial Pancreas (AP) Market Value Share (%), By Segment 2, 2019 & 2027
      Figure 35: Latin America Artificial Pancreas (AP) Market Forecast (USD Billion), by Sub-Segment 1, 2016-2027
      Figure 36: Latin America Artificial Pancreas (AP) Market Forecast (USD Billion), by Sub-Segment 2, 2016-2027
      Figure 37: Latin America Artificial Pancreas (AP) Market Forecast (USD Billion), by Sub-Segment 3, 2016-2027
      Figure 38: Latin America Artificial Pancreas (AP) Market Forecast (USD Billion), by Others, 2016-2027
      Figure 39: Latin America Artificial Pancreas (AP) Market Value Share (%), By Segment 3, 2019 & 2027
      Figure 40: Latin America Artificial Pancreas (AP) Market Forecast (USD Billion), by Sub-Segment 1, 2016-2027
      Figure 41: Latin America Artificial Pancreas (AP) Market Forecast (USD Billion), by Sub-Segment 2, 2016-2027
      Figure 42: Latin America Artificial Pancreas (AP) Market Forecast (USD Billion), by Sub-Segment 3, 2016-2027
      Figure 43: Latin America Artificial Pancreas (AP) Market Forecast (USD Billion), by Others, 2016-2027
      Figure 44: Latin America Artificial Pancreas (AP) Market Forecast (USD Billion), by Brazil, 2016-2027
      Figure 45: Latin America Artificial Pancreas (AP) Market Forecast (USD Billion), by Mexico, 2016-2027
      Figure 46: Latin America Artificial Pancreas (AP) Market Forecast (USD Billion), by Rest of Latin America, 2016-2027
      Figure 47: Europe Artificial Pancreas (AP) Market Value Share (%), By Segment 1, 2019 & 2027
      Figure 48: Europe Artificial Pancreas (AP) Market Forecast (USD Billion), by Sub-Segment 1, 2016-2027
      Figure 49: Europe Artificial Pancreas (AP) Market Forecast (USD Billion), by Sub-Segment 2, 2016-2027
      Figure 50: Europe Artificial Pancreas (AP) Market Value Share (%), By Segment 2, 2019 & 2027
      Figure 51: Europe Artificial Pancreas (AP) Market Forecast (USD Billion), by Sub-Segment 1, 2016-2027
      Figure 52: Europe Artificial Pancreas (AP) Market Forecast (USD Billion), by Sub-Segment 2, 2016-2027
      Figure 53: Europe Artificial Pancreas (AP) Market Forecast (USD Billion), by Sub-Segment 3, 2016-2027
      Figure 54: Europe Artificial Pancreas (AP) Market Forecast (USD Billion), by Others, 2016-2027
      Figure 55: Europe Artificial Pancreas (AP) Market Value Share (%), By Segment 3, 2019 & 2027
      Figure 56: Europe Artificial Pancreas (AP) Market Forecast (USD Billion), by Sub-Segment 1, 2016-2027
      Figure 57: Europe Artificial Pancreas (AP) Market Forecast (USD Billion), by Sub-Segment 2, 2016-2027
      Figure 58: Europe Artificial Pancreas (AP) Market Forecast (USD Billion), by Sub-Segment 3, 2016-2027
      Figure 59: Europe Artificial Pancreas (AP) Market Forecast (USD Billion), by Others, 2016-2027
      Figure 60: Europe Artificial Pancreas (AP) Market Forecast (USD Billion), by U.K., 2016-2027
      Figure 61: Europe Artificial Pancreas (AP) Market Forecast (USD Billion), by Germany, 2016-2027
      Figure 62: Europe Artificial Pancreas (AP) Market Forecast (USD Billion), by France, 2016-2027
      Figure 63: Europe Artificial Pancreas (AP) Market Forecast (USD Billion), by Italy, 2016-2027
      Figure 64: Europe Artificial Pancreas (AP) Market Forecast (USD Billion), by Spain, 2016-2027
      Figure 65: Europe Artificial Pancreas (AP) Market Forecast (USD Billion), by Russia, 2016-2027
      Figure 66: Europe Artificial Pancreas (AP) Market Forecast (USD Billion), by Rest of Europe, 2016-2027
      Figure 67: Asia Pacific Artificial Pancreas (AP) Market Value Share (%), By Segment 1, 2019 & 2027
      Figure 68: Asia Pacific Artificial Pancreas (AP) Market Forecast (USD Billion), by Sub-Segment 1, 2016-2027
      Figure 69: Asia Pacific Artificial Pancreas (AP) Market Forecast (USD Billion), by Sub-Segment 2, 2016-2027
      Figure 70: Asia Pacific Artificial Pancreas (AP) Market Value Share (%), By Segment 2, 2019 & 2027
      Figure 71: Asia Pacific Artificial Pancreas (AP) Market Forecast (USD Billion), by Sub-Segment 1, 2016-2027
      Figure 72: Asia Pacific Artificial Pancreas (AP) Market Forecast (USD Billion), by Sub-Segment 2, 2016-2027
      Figure 73: Asia Pacific Artificial Pancreas (AP) Market Forecast (USD Billion), by Sub-Segment 3, 2016-2027
      Figure 74: Asia Pacific Artificial Pancreas (AP) Market Forecast (USD Billion), by Others, 2016-2027
      Figure 75: Asia Pacific Artificial Pancreas (AP) Market Value Share (%), By Segment 3, 2019 & 2027
      Figure 76: Asia Pacific Artificial Pancreas (AP) Market Forecast (USD Billion), by Sub-Segment 1, 2016-2027
      Figure 77: Asia Pacific Artificial Pancreas (AP) Market Forecast (USD Billion), by Sub-Segment 2, 2016-2027
      Figure 78: Asia Pacific Artificial Pancreas (AP) Market Forecast (USD Billion), by Sub-Segment 3, 2016-2027
      Figure 79: Asia Pacific Artificial Pancreas (AP) Market Forecast (USD Billion), by Others, 2016-2027
      Figure 80: Asia Pacific Artificial Pancreas (AP) Market Forecast (USD Billion), by China, 2016-2027
      Figure 81: Asia Pacific Artificial Pancreas (AP) Market Forecast (USD Billion), by India, 2016-2027
      Figure 82: Asia Pacific Artificial Pancreas (AP) Market Forecast (USD Billion), by Japan, 2016-2027
      Figure 83: Asia Pacific Artificial Pancreas (AP) Market Forecast (USD Billion), by Australia, 2016-2027
      Figure 84: Asia Pacific Artificial Pancreas (AP) Market Forecast (USD Billion), by Southeast Asia, 2016-2027
      Figure 85: Asia Pacific Artificial Pancreas (AP) Market Forecast (USD Billion), by Rest of Asia Pacific, 2016-2027
      Figure 86: Middle East & Africa Artificial Pancreas (AP) Market Value Share (%), By Segment 1, 2019 & 2027
      Figure 87: Middle East & Africa Artificial Pancreas (AP) Market Forecast (USD Billion), by Sub-Segment 1, 2016-2027
      Figure 88: Middle East & Africa Artificial Pancreas (AP) Market Forecast (USD Billion), by Sub-Segment 2, 2016-2027
      Figure 89: Middle East & Africa Artificial Pancreas (AP) Market Value Share (%), By Segment 2, 2019 & 2027
      Figure 90: Middle East & Africa Artificial Pancreas (AP) Market Forecast (USD Billion), by Sub-Segment 1, 2016-2027
      Figure 91: Middle East & Africa Artificial Pancreas (AP) Market Forecast (USD Billion), by Sub-Segment 2, 2016-2027
      Figure 92: Middle East & Africa Artificial Pancreas (AP) Market Forecast (USD Billion), by Sub-Segment 3, 2016-2027
      Figure 93: Middle East & Africa Artificial Pancreas (AP) Market Forecast (USD Billion), by Others, 2016-2027
      Figure 94: Middle East & Africa Artificial Pancreas (AP) Market Value Share (%), By Segment 3, 2019 & 2027
      Figure 95: Middle East & Africa Artificial Pancreas (AP) Market Forecast (USD Billion), by Sub-Segment 1, 2016-2027
      Figure 96: Middle East & Africa Artificial Pancreas (AP) Market Forecast (USD Billion), by Sub-Segment 2, 2016-2027
      Figure 97: Middle East & Africa Artificial Pancreas (AP) Market Forecast (USD Billion), by Sub-Segment 3, 2016-2027
      Figure 98: Middle East & Africa Artificial Pancreas (AP) Market Forecast (USD Billion), by Others, 2016-2027
      Figure 99: Middle East & Africa Artificial Pancreas (AP) Market Forecast (USD Billion), by GCC, 2016-2027
      Figure 100: Middle East & Africa Artificial Pancreas (AP) Market Forecast (USD Billion), by South Africa, 2016-2027
      Figure 101: Middle East & Africa Artificial Pancreas (AP) Market Forecast (USD Billion), by Rest of Middle East & Africa, 2016-2027 
      List of Tables
      Table 1: Global Artificial Pancreas (AP) Market Revenue (USD Billion) Forecast, by Segment 1, 2016-2027
      Table 2: Global Artificial Pancreas (AP) Market Revenue (USD Billion) Forecast, by Segment 2, 2016-2027
      Table 3: Global Artificial Pancreas (AP) Market Revenue (USD Billion) Forecast, by Segment 3, 2016-2027
      Table 4: Global Artificial Pancreas (AP) Market Revenue (USD Billion) Forecast, by Region, 2016-2027
      Table 5: North America Artificial Pancreas (AP) Market Revenue (USD Billion) Forecast, by Segment 1, 2016-2027
      Table 6: North America Artificial Pancreas (AP) Market Revenue (USD Billion) Forecast, by Segment 2, 2016-2027
      Table 7: North America Artificial Pancreas (AP) Market Revenue (USD Billion) Forecast, by Segment 3, 2016-2027
      Table 8: North America Artificial Pancreas (AP) Market Revenue (USD Billion) Forecast, by Country, 2016-2027
      Table 9: Europe Artificial Pancreas (AP) Market Revenue (USD Billion) Forecast, by Segment 1, 2016-2027
      Table 10: Europe Artificial Pancreas (AP) Market Revenue (USD Billion) Forecast, by Segment 2, 2016-2027
      Table 11: Europe Artificial Pancreas (AP) Market Revenue (USD Billion) Forecast, by Segment 3, 2016-2027
      Table 12: Europe Artificial Pancreas (AP) Market Revenue (USD Billion) Forecast, by Country, 2016-2027
      Table 13: Latin America Artificial Pancreas (AP) Market Revenue (USD Billion) Forecast, by Segment 1, 2016-2027
      Table 14: Latin America Artificial Pancreas (AP) Market Revenue (USD Billion) Forecast, by Segment 2, 2016-2027
      Table 15: Latin America Artificial Pancreas (AP) Market Revenue (USD Billion) Forecast, by Segment 3, 2016-2027
      Table 16: Latin America Artificial Pancreas (AP) Market Revenue (USD Billion) Forecast, by Country, 2016-2027
      Table 17: Asia Pacific Artificial Pancreas (AP) Market Revenue (USD Billion) Forecast, by Segment 1, 2016-2027
      Table 18: Asia Pacific Artificial Pancreas (AP) Market Revenue (USD Billion) Forecast, by Segment 2, 2016-2027
      Table 19: Asia Pacific Artificial Pancreas (AP) Market Revenue (USD Billion) Forecast, by Segment 3, 2016-2027
      Table 20: Asia Pacific Artificial Pancreas (AP) Market Revenue (USD Billion) Forecast, by Country, 2016-2027
      Table 21: Middle East & Africa Artificial Pancreas (AP) Market Revenue (USD Billion) Forecast, by Segment 1, 2016-2027
      Table 22: Middle East & Africa Artificial Pancreas (AP) Market Revenue (USD Billion) Forecast, by Segment 2, 2016-2027
      Table 23: Middle East & Africa Artificial Pancreas (AP) Market Revenue (USD Billion) Forecast, by Segment 3, 2016-2027
      Table 24: Middle East & Africa Artificial Pancreas (AP) Market Revenue (USD Billion) Forecast, by Country, 2016-2027
      Research Process

      Data Library Research are conducted by industry experts who offer insight on industry structure, market segmentations technology assessment and competitive landscape (CL), and penetration, as well as on emerging trends. Their analysis is based on primary interviews (~ 80%) and secondary research (~ 20%) as well as years of professional expertise in their respective industries. Adding to this, by analysing historical trends and current market positions, our analysts predict where the market will be headed for the next five years. Furthermore, the varying trends of segment & categories geographically presented are also studied and the estimated based on the primary & secondary research.

      In this particular report from the supply side Data Library Research has conducted primary surveys (interviews) with the key level executives (VP, CEO’s, Marketing Director, Business Development Manager and SOFT) of the companies that active & prominent as well as the midsized organization

      FIGURE 1: DLR RESEARH PROCESS

      research-methodology1

      Primary Research

      Extensive primary research was conducted to gain a deeper insight of the market and industry performance. The analysis is based on both primary and secondary research as well as years of professional expertise in the respective industries.

      In addition to analysing current and historical trends, our analysts predict where the market is headed over the next five years.

      It varies by segment for these categories geographically presented in the list of market tables. Speaking about this particular report we have conducted primary surveys (interviews) with the key level executives (VP, CEO’s, Marketing Director, Business Development Manager and many more) of the major players active in the market.

      Secondary Research

      Secondary research was mainly used to collect and identify information useful for the extensive, technical, market-oriented, and Friend’s study of the Global Extra Neutral Alcohol. It was also used to obtain key information about major players, market classification and segmentation according to the industry trends, geographical markets, and developments related to the market and technology perspectives. For this study, analysts have gathered information from various credible sources, such as annual reports, sec filings, journals, white papers, SOFT presentations, and company web sites.

      Market Size Estimation

      Both, top-down and bottom-up approaches were used to estimate and validate the size of the Global market and to estimate the size of various other dependent submarkets in the overall Extra Neutral Alcohol. The key players in the market were identified through secondary research and their market contributions in the respective geographies were determined through primary and secondary research.

      Forecast Model

      research-methodology2