Automotive Vehicle Fleet Leasing Market Overview
In an automotive fleet leasing service, the firm that owns the fleet leases it to other businesses. Several manufacturing firms require a large fleet to deliver their goods and products, and they choose to lease one from a fleet leasing company. Furthermore, numerous businesses require a fleet of passenger vehicles to carry their staff.
Large-goods manufacturers either own or lease their fleet. The cost of managing and maintaining a fleet includes the cost of fuel, drivers, and other workers, as well as the cost of a management system and parking space. As a result, businesses prefer to lease fleet vehicles to avoid these additional fees, which is much less expensive than owning a fleet. As a result, the global vehicle fleet leasing market is booming. Furthermore, the global automotive vehicle fleet leasing market is being driven by the rapid expansion of the shared mobility, food and beverage, and manufacturing industries, as well as strict emission regulations.
Changes in emission standards around the world force fleet owners to replace older cars with newer ones; as a result, many fleet owners, including governments and other private businesses, choose fleet leasing. As a result, the global automotive vehicle fleet leasing market is thriving.
| Report Metric |
Details |
| Market size available for years |
2023–2030 |
| Base year considered |
2023 |
| Forecast period |
2024–2030 |
| Forecast unit |
Value (USD Million) |
| Segments covered |
Leasing Body, Vehicle Type, End-Use Industry, and Region. |
| Regions covered |
North America (the U.S. and Canada), Europe (UK, Germany, France, Italy, Spain, Russia, Rest of Europe), Asia-Pacific (China, India, Japan, Australia, South East Asia, Rest of Asia Pacific), Latin America and the Middle East and Africa (Brazil, Saudi Arabia, UAE, Rest of LAMEA) |
| Companies covered |
Enterprise Holdings, Wilmar Inc., Merchants Fleet, Ewald Automotive Group, Sixt Leasing, United Leasing & Finance, Caldwell Leasing, Element Fleet Management Corp., and Emkay. |
Covid-19 Impact on Automotive Vehicle Fleet Leasing Market
The outbreak of the covid-19 has a severe and swift impact on the automobile and transportation industry. This is majorly due to the shutdown of assembly plants in the US, interruptions across Europe in large-scale manufacturing, and disruption in the export of Chinese parts. In addition to this, the industry is dealing with reduced demand across the globe due to changes in customer behavior and shifts in a supply-demand chain. A recent study shows a 39% decline in sales of automotive all over the world. Moreover, the nationwide lockdowns have substantially affected the transportation sector. Restrictions on transportation accounted for a 45 to 55% decline in public as well as private transport sectors.
Automotive Vehicle Fleet Leasing Market Segment Overview
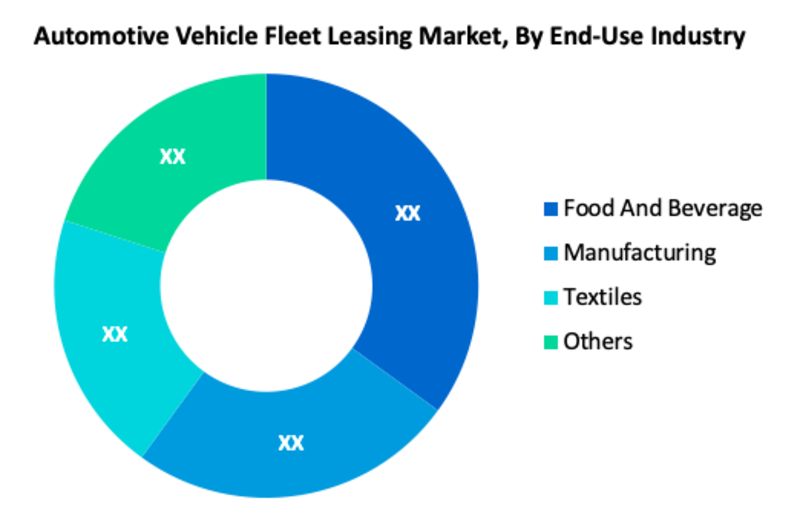
According to End-Use Industry, the Food And Beverage is one of the most prominent segments in the global Automotive Vehicle Fleet Leasing Market. The food and beverage industry has a significant demand for vehicle fleets. Food and beverage demand is increasing over the world, which can be attributed to increased population and rising per capita income. Individuals spend a significant portion of their daily income on food and beverage, which in turn stimulates the demand for food and beverage. As a result, in terms of revenue, the food and beverage segment accounted for a significant portion of the market.
Automotive Vehicle Fleet Leasing Market, By Leasing Body
· Government
· Private Business
Automotive Vehicle Fleet Leasing Market, By Vehicle Type
· Light commercial vehicles
· Heavy Commercial Vehicles
Automotive Vehicle Fleet Leasing Market, By End-Use Industry
· Food And Beverage
· Manufacturing
· Textiles
· Others
Automotive Vehicle Fleet Leasing Regional Overview
The global Automotive Vehicle Fleet Leasing market is divided into North America, Europe, Asia Pacific, Latin America, and the Middle East & Africa. Leading worldwide food and beverage, textile, and manufacturing industries are based in North America. Furthermore, because the region has a large number of fleet leasing companies, it holds a significant portion of the global automotive vehicle fleet leasing market. Furthermore, Asia Pacific is a global manufacturing hub, and the region is a major consumer of food and beverage, owing to the region's enormous population. The automotive fleet vehicle leasing market in the Asia Pacific is being propelled by the expansion of road infrastructure combined with an increase in per capita income across the region.
Automotive Vehicle Fleet Leasing Market, By Geography
· North America (US & Canada)
· Europe (UK, Germany, France, Italy, Spain, Russia & Rest of Europe)
· Asia-Pacific (Japan, China, India, Australia, & South Korea, & Rest of Asia-Pacific)
· LAMEA (Brazil, Saudi Arabia, UAE & Rest of LAMEA)
Automotive Vehicle Fleet Leasing Market, Key Players
· Enterprise Holdings
· Wilmar Inc.
· Merchants Fleet
· Ewald Automotive Group
· Sixt Leasing
· United Leasing & Finance
· Caldwell Leasing
· Element Fleet Management Corp.
· Emkay
Frequently Asked Questions (FAQ) :
Q1. What are the driving factors for the global Automotive Vehicle Fleet Leasing market?
The global automotive vehicle fleet leasing market is being driven by the rapid expansion of the shared mobility, food and beverage, and manufacturing industries, as well as strict emission regulations
Q2. Which Segments are covered in the global Automotive Vehicle Fleet Leasing market report?
Leasing Body, Vehicle Type, End-Use Industry, and Region. these segments are covered in the global Automotive Vehicle Fleet Leasing market report
Q3. Which segment is projected to hold the largest share in the global Automotive Vehicle Fleet Leasing market?
Food and Beverage segment is projected to hold the largest share in the global Automotive Vehicle Fleet Leasing market
Q4. Which region holds the largest share in the global Automotive Vehicle Fleet Leasing market?
North America holds the largest share in the global Automotive Vehicle Fleet Leasing market.
Q5. Which are the prominent players in the global Automotive Vehicle Fleet Leasing market?
Enterprise Holdings, Wilmar Inc., Merchants Fleet, Ewald Automotive Group, Sixt Leasing, United Leasing & Finance, Caldwell Leasing, Element Fleet Management Corp., and Emkay. are some key players in the global Automotive Vehicle Fleet Leasing market.
List of Figures
Figure 1: Global Automotive Fleet Leasing Market Revenue Breakdown (USD Billion, %) by Region, 2019 & 2027
Figure 2: Global Automotive Fleet Leasing Market Value Share (%), By Segment 1, 2019 & 2027
Figure 3: Global Automotive Fleet Leasing Market Forecast (USD Billion), by Sub-Segment 1, 2016-2027
Figure 4: Global Automotive Fleet Leasing Market Forecast (USD Billion), by Sub-Segment 2, 2016-2027
Figure 5: Global Automotive Fleet Leasing Market Value Share (%), By Segment 2, 2019 & 2027
Figure 6: Global Automotive Fleet Leasing Market Forecast (USD Billion), by Sub-Segment 1, 2016-2027
Figure 7: Global Automotive Fleet Leasing Market Forecast (USD Billion), by Sub-Segment 2, 2016-2027
Figure 8: Global Automotive Fleet Leasing Market Forecast (USD Billion), by Sub-Segment 3, 2016-2027
Figure 9: Global Automotive Fleet Leasing Market Forecast (USD Billion), by Others, 2016-2027
Figure 10: Global Automotive Fleet Leasing Market Value Share (%), By Segment 3, 2019 & 2027
Figure 11: Global Automotive Fleet Leasing Market Forecast (USD Billion), by Sub-Segment 1, 2016-2027
Figure 12: Global Automotive Fleet Leasing Market Forecast (USD Billion), by Sub-Segment 2, 2016-2027
Figure 13: Global Automotive Fleet Leasing Market Forecast (USD Billion), by Sub-Segment 3, 2016-2027
Figure 14: Global Automotive Fleet Leasing Market Forecast (USD Billion), by Others, 2016-2027
Figure 15: Global Automotive Fleet Leasing Market Value (USD Billion), by Region, 2019 & 2027
Figure 16: North America Automotive Fleet Leasing Market Value Share (%), By Segment 1, 2019 & 2027
Figure 17: North America Automotive Fleet Leasing Market Forecast (USD Billion), by Sub-Segment 1, 2016-2027
Figure 18: North America Automotive Fleet Leasing Market Forecast (USD Billion), by Sub-Segment 2, 2016-2027
Figure 19: North America Automotive Fleet Leasing Market Value Share (%), By Segment 2, 2019 & 2027
Figure 20: North America Automotive Fleet Leasing Market Forecast (USD Billion), by Sub-Segment 1, 2016-2027
Figure 21: North America Automotive Fleet Leasing Market Forecast (USD Billion), by Sub-Segment 2, 2016-2027
Figure 22: North America Automotive Fleet Leasing Market Forecast (USD Billion), by Sub-Segment 3, 2016-2027
Figure 23: North America Automotive Fleet Leasing Market Forecast (USD Billion), by Others, 2016-2027
Figure 24: North America Automotive Fleet Leasing Market Value Share (%), By Segment 3, 2019 & 2027
Figure 25: North America Automotive Fleet Leasing Market Forecast (USD Billion), by Sub-Segment 1, 2016-2027
Figure 26: North America Automotive Fleet Leasing Market Forecast (USD Billion), by Sub-Segment 2, 2016-2027
Figure 27: North America Automotive Fleet Leasing Market Forecast (USD Billion), by Sub-Segment 3, 2016-2027
Figure 28: North America Automotive Fleet Leasing Market Forecast (USD Billion), by Others, 2016-2027
Figure 29: North America Automotive Fleet Leasing Market Forecast (USD Billion), by U.S., 2016-2027
Figure 30: North America Automotive Fleet Leasing Market Forecast (USD Billion), by Canada, 2016-2027
Figure 31: Latin America Automotive Fleet Leasing Market Value Share (%), By Segment 1, 2019 & 2027
Figure 32: Latin America Automotive Fleet Leasing Market Forecast (USD Billion), by Sub-Segment 1, 2016-2027
Figure 33: Latin America Automotive Fleet Leasing Market Forecast (USD Billion), by Sub-Segment 2, 2016-2027
Figure 34: Latin America Automotive Fleet Leasing Market Value Share (%), By Segment 2, 2019 & 2027
Figure 35: Latin America Automotive Fleet Leasing Market Forecast (USD Billion), by Sub-Segment 1, 2016-2027
Figure 36: Latin America Automotive Fleet Leasing Market Forecast (USD Billion), by Sub-Segment 2, 2016-2027
Figure 37: Latin America Automotive Fleet Leasing Market Forecast (USD Billion), by Sub-Segment 3, 2016-2027
Figure 38: Latin America Automotive Fleet Leasing Market Forecast (USD Billion), by Others, 2016-2027
Figure 39: Latin America Automotive Fleet Leasing Market Value Share (%), By Segment 3, 2019 & 2027
Figure 40: Latin America Automotive Fleet Leasing Market Forecast (USD Billion), by Sub-Segment 1, 2016-2027
Figure 41: Latin America Automotive Fleet Leasing Market Forecast (USD Billion), by Sub-Segment 2, 2016-2027
Figure 42: Latin America Automotive Fleet Leasing Market Forecast (USD Billion), by Sub-Segment 3, 2016-2027
Figure 43: Latin America Automotive Fleet Leasing Market Forecast (USD Billion), by Others, 2016-2027
Figure 44: Latin America Automotive Fleet Leasing Market Forecast (USD Billion), by Brazil, 2016-2027
Figure 45: Latin America Automotive Fleet Leasing Market Forecast (USD Billion), by Mexico, 2016-2027
Figure 46: Latin America Automotive Fleet Leasing Market Forecast (USD Billion), by Rest of Latin America, 2016-2027
Figure 47: Europe Automotive Fleet Leasing Market Value Share (%), By Segment 1, 2019 & 2027
Figure 48: Europe Automotive Fleet Leasing Market Forecast (USD Billion), by Sub-Segment 1, 2016-2027
Figure 49: Europe Automotive Fleet Leasing Market Forecast (USD Billion), by Sub-Segment 2, 2016-2027
Figure 50: Europe Automotive Fleet Leasing Market Value Share (%), By Segment 2, 2019 & 2027
Figure 51: Europe Automotive Fleet Leasing Market Forecast (USD Billion), by Sub-Segment 1, 2016-2027
Figure 52: Europe Automotive Fleet Leasing Market Forecast (USD Billion), by Sub-Segment 2, 2016-2027
Figure 53: Europe Automotive Fleet Leasing Market Forecast (USD Billion), by Sub-Segment 3, 2016-2027
Figure 54: Europe Automotive Fleet Leasing Market Forecast (USD Billion), by Others, 2016-2027
Figure 55: Europe Automotive Fleet Leasing Market Value Share (%), By Segment 3, 2019 & 2027
Figure 56: Europe Automotive Fleet Leasing Market Forecast (USD Billion), by Sub-Segment 1, 2016-2027
Figure 57: Europe Automotive Fleet Leasing Market Forecast (USD Billion), by Sub-Segment 2, 2016-2027
Figure 58: Europe Automotive Fleet Leasing Market Forecast (USD Billion), by Sub-Segment 3, 2016-2027
Figure 59: Europe Automotive Fleet Leasing Market Forecast (USD Billion), by Others, 2016-2027
Figure 60: Europe Automotive Fleet Leasing Market Forecast (USD Billion), by U.K., 2016-2027
Figure 61: Europe Automotive Fleet Leasing Market Forecast (USD Billion), by Germany, 2016-2027
Figure 62: Europe Automotive Fleet Leasing Market Forecast (USD Billion), by France, 2016-2027
Figure 63: Europe Automotive Fleet Leasing Market Forecast (USD Billion), by Italy, 2016-2027
Figure 64: Europe Automotive Fleet Leasing Market Forecast (USD Billion), by Spain, 2016-2027
Figure 65: Europe Automotive Fleet Leasing Market Forecast (USD Billion), by Russia, 2016-2027
Figure 66: Europe Automotive Fleet Leasing Market Forecast (USD Billion), by Rest of Europe, 2016-2027
Figure 67: Asia Pacific Automotive Fleet Leasing Market Value Share (%), By Segment 1, 2019 & 2027
Figure 68: Asia Pacific Automotive Fleet Leasing Market Forecast (USD Billion), by Sub-Segment 1, 2016-2027
Figure 69: Asia Pacific Automotive Fleet Leasing Market Forecast (USD Billion), by Sub-Segment 2, 2016-2027
Figure 70: Asia Pacific Automotive Fleet Leasing Market Value Share (%), By Segment 2, 2019 & 2027
Figure 71: Asia Pacific Automotive Fleet Leasing Market Forecast (USD Billion), by Sub-Segment 1, 2016-2027
Figure 72: Asia Pacific Automotive Fleet Leasing Market Forecast (USD Billion), by Sub-Segment 2, 2016-2027
Figure 73: Asia Pacific Automotive Fleet Leasing Market Forecast (USD Billion), by Sub-Segment 3, 2016-2027
Figure 74: Asia Pacific Automotive Fleet Leasing Market Forecast (USD Billion), by Others, 2016-2027
Figure 75: Asia Pacific Automotive Fleet Leasing Market Value Share (%), By Segment 3, 2019 & 2027
Figure 76: Asia Pacific Automotive Fleet Leasing Market Forecast (USD Billion), by Sub-Segment 1, 2016-2027
Figure 77: Asia Pacific Automotive Fleet Leasing Market Forecast (USD Billion), by Sub-Segment 2, 2016-2027
Figure 78: Asia Pacific Automotive Fleet Leasing Market Forecast (USD Billion), by Sub-Segment 3, 2016-2027
Figure 79: Asia Pacific Automotive Fleet Leasing Market Forecast (USD Billion), by Others, 2016-2027
Figure 80: Asia Pacific Automotive Fleet Leasing Market Forecast (USD Billion), by China, 2016-2027
Figure 81: Asia Pacific Automotive Fleet Leasing Market Forecast (USD Billion), by India, 2016-2027
Figure 82: Asia Pacific Automotive Fleet Leasing Market Forecast (USD Billion), by Japan, 2016-2027
Figure 83: Asia Pacific Automotive Fleet Leasing Market Forecast (USD Billion), by Australia, 2016-2027
Figure 84: Asia Pacific Automotive Fleet Leasing Market Forecast (USD Billion), by Southeast Asia, 2016-2027
Figure 85: Asia Pacific Automotive Fleet Leasing Market Forecast (USD Billion), by Rest of Asia Pacific, 2016-2027
Figure 86: Middle East & Africa Automotive Fleet Leasing Market Value Share (%), By Segment 1, 2019 & 2027
Figure 87: Middle East & Africa Automotive Fleet Leasing Market Forecast (USD Billion), by Sub-Segment 1, 2016-2027
Figure 88: Middle East & Africa Automotive Fleet Leasing Market Forecast (USD Billion), by Sub-Segment 2, 2016-2027
Figure 89: Middle East & Africa Automotive Fleet Leasing Market Value Share (%), By Segment 2, 2019 & 2027
Figure 90: Middle East & Africa Automotive Fleet Leasing Market Forecast (USD Billion), by Sub-Segment 1, 2016-2027
Figure 91: Middle East & Africa Automotive Fleet Leasing Market Forecast (USD Billion), by Sub-Segment 2, 2016-2027
Figure 92: Middle East & Africa Automotive Fleet Leasing Market Forecast (USD Billion), by Sub-Segment 3, 2016-2027
Figure 93: Middle East & Africa Automotive Fleet Leasing Market Forecast (USD Billion), by Others, 2016-2027
Figure 94: Middle East & Africa Automotive Fleet Leasing Market Value Share (%), By Segment 3, 2019 & 2027
Figure 95: Middle East & Africa Automotive Fleet Leasing Market Forecast (USD Billion), by Sub-Segment 1, 2016-2027
Figure 96: Middle East & Africa Automotive Fleet Leasing Market Forecast (USD Billion), by Sub-Segment 2, 2016-2027
Figure 97: Middle East & Africa Automotive Fleet Leasing Market Forecast (USD Billion), by Sub-Segment 3, 2016-2027
Figure 98: Middle East & Africa Automotive Fleet Leasing Market Forecast (USD Billion), by Others, 2016-2027
Figure 99: Middle East & Africa Automotive Fleet Leasing Market Forecast (USD Billion), by GCC, 2016-2027
Figure 100: Middle East & Africa Automotive Fleet Leasing Market Forecast (USD Billion), by South Africa, 2016-2027
Figure 101: Middle East & Africa Automotive Fleet Leasing Market Forecast (USD Billion), by Rest of Middle East & Africa, 2016-2027
List of Tables
Table 1: Global Automotive Fleet Leasing Market Revenue (USD Billion) Forecast, by Segment 1, 2016-2027
Table 2: Global Automotive Fleet Leasing Market Revenue (USD Billion) Forecast, by Segment 2, 2016-2027
Table 3: Global Automotive Fleet Leasing Market Revenue (USD Billion) Forecast, by Segment 3, 2016-2027
Table 4: Global Automotive Fleet Leasing Market Revenue (USD Billion) Forecast, by Region, 2016-2027
Table 5: North America Automotive Fleet Leasing Market Revenue (USD Billion) Forecast, by Segment 1, 2016-2027
Table 6: North America Automotive Fleet Leasing Market Revenue (USD Billion) Forecast, by Segment 2, 2016-2027
Table 7: North America Automotive Fleet Leasing Market Revenue (USD Billion) Forecast, by Segment 3, 2016-2027
Table 8: North America Automotive Fleet Leasing Market Revenue (USD Billion) Forecast, by Country, 2016-2027
Table 9: Europe Automotive Fleet Leasing Market Revenue (USD Billion) Forecast, by Segment 1, 2016-2027
Table 10: Europe Automotive Fleet Leasing Market Revenue (USD Billion) Forecast, by Segment 2, 2016-2027
Table 11: Europe Automotive Fleet Leasing Market Revenue (USD Billion) Forecast, by Segment 3, 2016-2027
Table 12: Europe Automotive Fleet Leasing Market Revenue (USD Billion) Forecast, by Country, 2016-2027
Table 13: Latin America Automotive Fleet Leasing Market Revenue (USD Billion) Forecast, by Segment 1, 2016-2027
Table 14: Latin America Automotive Fleet Leasing Market Revenue (USD Billion) Forecast, by Segment 2, 2016-2027
Table 15: Latin America Automotive Fleet Leasing Market Revenue (USD Billion) Forecast, by Segment 3, 2016-2027
Table 16: Latin America Automotive Fleet Leasing Market Revenue (USD Billion) Forecast, by Country, 2016-2027
Table 17: Asia Pacific Automotive Fleet Leasing Market Revenue (USD Billion) Forecast, by Segment 1, 2016-2027
Table 18: Asia Pacific Automotive Fleet Leasing Market Revenue (USD Billion) Forecast, by Segment 2, 2016-2027
Table 19: Asia Pacific Automotive Fleet Leasing Market Revenue (USD Billion) Forecast, by Segment 3, 2016-2027
Table 20: Asia Pacific Automotive Fleet Leasing Market Revenue (USD Billion) Forecast, by Country, 2016-2027
Table 21: Middle East & Africa Automotive Fleet Leasing Market Revenue (USD Billion) Forecast, by Segment 1, 2016-2027
Table 22: Middle East & Africa Automotive Fleet Leasing Market Revenue (USD Billion) Forecast, by Segment 2, 2016-2027
Table 23: Middle East & Africa Automotive Fleet Leasing Market Revenue (USD Billion) Forecast, by Segment 3, 2016-2027
Table 24: Middle East & Africa Automotive Fleet Leasing Market Revenue (USD Billion) Forecast, by Country, 2016-2027
Research Process
Data Library Research are conducted by industry experts who offer insight on
industry structure, market segmentations technology assessment and competitive landscape (CL), and penetration, as well as on emerging trends. Their analysis is based on primary interviews (~ 80%) and secondary research (~ 20%) as well as years of professional expertise in their respective industries. Adding to this, by analysing historical trends and current market positions, our analysts predict where the market will be headed for the next five years. Furthermore, the varying trends of segment & categories geographically presented are also studied and the estimated based on the primary & secondary research.
In this particular report from the supply side Data Library Research has conducted primary surveys (interviews) with the key level executives (VP, CEO’s, Marketing Director, Business Development Manager
and SOFT) of the companies that active & prominent as well as the midsized organization
FIGURE 1: DLR RESEARH PROCESS
![research-methodology1]()
Primary Research
Extensive primary research was conducted to gain a deeper insight of the market and industry performance. The analysis is based on both primary and secondary research as well as years of professional expertise in the respective industries.
In addition to analysing current and historical trends, our analysts predict where the market is headed over the next five years.
It varies by segment for these categories geographically presented in the list of market tables. Speaking about this particular report we have conducted primary surveys (interviews) with the key level executives (VP, CEO’s, Marketing Director, Business Development Manager and many more) of the major players active in the market.
Secondary Research
Secondary research was mainly used to collect and identify information useful for the extensive, technical, market-oriented, and Friend’s study of the Global Extra Neutral Alcohol. It was also used to obtain key information about major players, market classification and segmentation according to the industry trends, geographical markets, and developments related to the market and technology perspectives. For this study, analysts have gathered information from various credible sources, such as annual reports, sec filings, journals, white papers, SOFT presentations, and company web sites.
Market Size Estimation
Both, top-down and bottom-up approaches were used to estimate and validate the size of the Global market and to estimate the size of various other dependent submarkets in the overall Extra Neutral Alcohol. The key players in the market were identified through secondary research and their market contributions in the respective geographies were determined through primary and secondary research.
Forecast Model
![research-methodology2]()