Recreational Vehicle (RV) Chassis Market Overview and Analysis

  • The Global Recreational Vehicle (RV) Chassis Market size was estimated at USD 67.70 billion in 2025 and is projected to reach USD 147.25 billion by 2032, growing with a CAGR of 12.23% from 2025-2032.

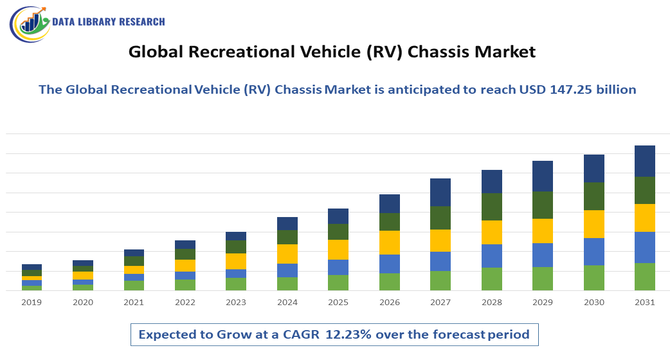
The Global Recreational Vehicle (RV) Chassis Market refers to the worldwide industry involved in the design, manufacture, and sale of the structural frameworks that serve as the foundation for recreational vehicles such as motorhomes, camper vans, and trailers. This market encompasses various types of chassis including motorized and towable platforms, catering to diverse consumer demands for travel and leisure. Driven by rising tourism, increasing disposable incomes, and a growing preference for outdoor and mobile lifestyles, the market is characterized by advancements in lightweight materials, enhanced safety features, and integration of smart technologies. Key players operate across regions to meet the expanding demand for durable, versatile, and efficient RV chassis solutions, making this market a critical segment within the broader automotive and recreational industries.

Recreational Vehicle (RV) Chassis Market Latest Trends

The Global RV Chassis Market is witnessing notable trends driven by evolving consumer preferences and technological innovation. Lightweight and fuel-efficient chassis are increasingly in demand, aligning with global sustainability goals and rising fuel costs. Electrification is gaining momentum, with manufacturers exploring hybrid and fully electric RV platforms. Smart technologies, including integrated telematics, advanced driver-assistance systems (ADAS), and real-time diagnostics, are becoming standard features. Additionally, the surge in remote work culture and digital nomadism has fueled interest in mobile living, prompting demand for customizable and multifunctional RV chassis. The market is also seeing growth in modular chassis designs to support a variety of RV configurations, enabling greater flexibility and catering to the increasing popularity of outdoor and adventure travel lifestyles.

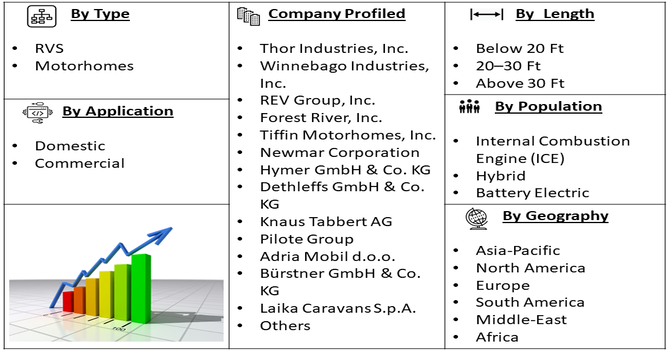
Segmentation: The Global Recreational Vehicle (RV) Chassis Market is segmented by Type (RVS and Motorhomes), Application (Domestic and Commercial), Propulsion (Internal Combustion Engine (ICE), Hybrid, and Battery Electric), Length (Below 20 Ft, 20–30 Ft, and Above 30 Ft), and Geography (North America, Europe, Asia-Pacific, Middle East and Africa, and South America). The report provides the value (in USD million) for the above segments.

Market Drivers:

  • Growing Demand for Outdoor and Mobile Lifestyles

The increasing popularity of outdoor recreation and mobile living is a significant driver for the RV chassis market. Consumers, particularly millennials and retirees, are seeking flexible travel options that offer autonomy, affordability, and a closer connection to nature. The post-pandemic era accelerated this trend, as travelers turned away from crowded hotels and airports in favor of self-contained, road-based travel. RVs—especially motorhomes and camper vans—allow for social distancing, remote work, and extended family vacations. This shift in lifestyle preferences has boosted RV sales and, by extension, the demand for robust, reliable, and customizable chassis platforms that can support various configurations and amenities, encouraging manufacturers to innovate and diversify their offerings to meet evolving consumer needs.

  • Technological Advancements in Chassis Design

Technological innovations in chassis design are driving significant growth in the RV industry. Advances in lightweight materials, electric drivetrains, and integrated safety systems are making RVs more efficient, durable, and user-friendly. Modern chassis are now engineered for better fuel economy, higher load-bearing capacity, and smoother ride quality. The introduction of electric and hybrid chassis also reflects a growing focus on sustainability and regulatory compliance, particularly in North America and Europe. Features such as modular architecture, advanced suspension systems, and digital monitoring tools enhance the overall value proposition for both manufacturers and consumers. These developments not only expand the design possibilities for RVs but also reduce operational costs, making RV ownership more accessible and appealing to a broader demographic.

Market Restraints:

  • Regulatory Restrictions and Urban Parking Limitations

The key restraints facing the global RV chassis market is the tightening of regulatory controls and urban parking restrictions, especially in major cities across North America and Europe. As urban populations grow, municipalities are increasingly limiting the use and storage of large vehicles like motorhomes on public streets and residential zones. These restrictions can deter potential buyers who lack private storage or who live in urban environments where RV use is impractical. Furthermore, emissions regulations are placing added pressure on manufacturers to transition to cleaner chassis technologies, which increases production costs. These legal and logistical barriers could slow the adoption of larger RVs and affect demand for specific chassis sizes, particularly in densely populated or regulated regions.

Socio Economic Impact on Recreational Vehicle (RV) Chassis Market

The RV chassis market plays a significant socio-economic role, particularly in regions where tourism, outdoor recreation, and mobile living are integral to local economies. Increased consumer interest in RV travel supports job creation across manufacturing, retail, maintenance, and tourism sectors. The market benefits from rising disposable incomes and changing lifestyles, particularly among retirees and younger travelers seeking affordable, flexible alternatives to traditional vacations. It also stimulates local economies as RV travelers often spend in rural and remote areas that typically see less tourist activity. Furthermore, the RV lifestyle's appeal during crises—such as pandemics—highlights its value in promoting social distancing while sustaining travel. The market's expansion reflects a broader shift toward experience-driven consumption and supports both economic growth and personal well-being.

Segmental Analysis:

  • Motorhomes segment is expected to witness highest growth over the forecast period

The motorhomes segment is projected to experience the highest growth in the RV chassis market due to rising consumer demand for all-in-one mobile living solutions. Motorhomes offer enhanced convenience, mobility, and luxury, making them especially appealing for extended travel and full-time RV lifestyles. Advances in chassis technology have improved fuel efficiency, handling, and durability, further boosting adoption. Additionally, increased interest in domestic tourism, especially post-pandemic, has shifted consumer preferences toward motorized RVs over towables. The surge in remote work and digital nomadism also supports demand for self-contained, drivable units. North America and Europe are key regions driving this growth, with strong infrastructure, disposable income, and a growing population of retirees seeking flexible travel options.

  • Commercial segment is expected to witness highest growth over the forecast period

The commercial segment within the RV chassis market is expected to register the highest growth due to expanding applications in mobile offices, medical units, food trucks, and rental fleets. Businesses are increasingly adopting customized RVs to serve remote and temporary locations, leveraging their mobility and self-sufficiency. Post-pandemic, mobile healthcare services and testing labs gained popularity, further validating RVs as viable commercial assets. Additionally, the event and tourism industries are investing in commercial RVs for transport, hospitality, and promotional purposes. Rental companies are also expanding fleets to meet growing demand from travelers who prefer short-term RV use without ownership. This trend is especially strong in urban centers and tourism hotspots, where mobile services offer cost-effective, flexible, and scalable solutions.

  • Internal Combustion Engine (ICE) segment is expected to witness highest growth over the forecast period

Despite the rise of electrification, the Internal Combustion Engine (ICE) segment is expected to dominate the RV chassis market over the forecast period, driven by existing infrastructure, affordability, and long-range capabilities. ICE-powered RVs offer extensive fueling networks, well-established maintenance ecosystems, and higher towing capacities, making them ideal for long-distance travel and heavy-duty applications. Many consumers, especially in North America, prefer diesel and gasoline engines due to familiarity and availability. Additionally, innovations in cleaner ICE technologies and compliance with stricter emission norms are helping prolong the segment’s relevance. While electric and hybrid models are gaining interest, ICE continues to be the most practical and cost-effective solution for most RV manufacturers and buyers in the current market landscape.

  • 20–30 Ft segment is expected to witness highest growth over the forecast period

The 20–30 ft RV chassis segment is poised for the highest growth, owing to its balance between maneuverability and space. This length category is ideal for families and couples seeking compact, yet comfortable living spaces without sacrificing drivability. It caters to both first-time RV buyers and experienced users looking to downsize without losing core amenities. RVs in this segment can access a wider range of campsites and parking spots, making them versatile for diverse travel needs. Manufacturers are increasingly focusing on this size range to meet growing demand, offering advanced features and lightweight chassis to improve performance and fuel efficiency. This segment’s affordability, practicality, and increasing popularity among younger travelers further contribute to its robust growth outlook.

  • North America region is expected to witness highest growth over the forecast period

North America is expected to lead the RV chassis market growth, supported by a strong RV culture, extensive road infrastructure, and high disposable incomes. The U.S. and Canada together represent a mature yet expanding market, with increasing interest in outdoor recreation, especially post-pandemic. Consumer trends favoring mobile lifestyles, remote work, and family-oriented travel have accelerated demand for both motorhomes and towables.

Additionally, a well-established RV manufacturing base, major players like Thor and Winnebago, and robust dealership networks enhance regional growth. For instance, in April 2024, the Los Angeles City Council expanded its overnight parking restrictions by adding 30 more streets where recreational vehicles longer than 22 feet are prohibited from parking between 2 a.m. and 6 a.m. This regulation is part of ongoing efforts to address street congestion and community concerns related to long-term RV parking in residential areas. This development highlights growing regulatory pressure in urban centers across North America concerning large recreational vehicles. Restrictions like these may influence consumer behavior, with potential buyers opting for smaller RVs under 22 feet, leading to a shift in chassis demand toward compact and lightweight platforms. It could also drive increased interest in towable RVs or Class B and C motorhomes that are easier to park and maneuver. For manufacturers, adapting to changing urban policies may mean prioritizing modular, city-friendly chassis designs and promoting innovations that balance size with livability. Long-term, such regulations could reshape regional product strategies and fuel demand for RVs tailored to tighter parking and zoning laws.

Government incentives for tourism and infrastructure development also support this market. With innovations in ICE and growing interest in hybrid models, North America remains the most lucrative region, attracting investment and innovation across the RV chassis value chain.

Recreational Vehicle (RV) Chassis Market Competitive Landscape

The competitive landscape of the Global RV Chassis Market is marked by the presence of both established automotive giants and specialized chassis manufacturers. Key players such as Ford, Mercedes-Benz, Fiat Chrysler, and Freightliner dominate the motorized segment, while companies like AL-KO and Lippert Components lead in towable chassis solutions. Intense competition is pushing firms to innovate through electric drivetrains, weight reduction techniques, and smart integration. Partnerships between chassis manufacturers and RV assemblers are growing, fostering customization and faster go-to-market strategies. Startups and regional players are also emerging, particularly in Asia-Pacific and Europe, capitalizing on local market demands. Competitive dynamics are further influenced by regulatory standards around emissions and safety, encouraging R&D investments and strategic expansions into emerging markets.

The 20 major players for above market are:

  • Thor Industries, Inc.
  • Winnebago Industries, Inc.
  • REV Group, Inc.
  • Forest River, Inc.
  • Tiffin Motorhomes, Inc.
  • Newmar Corporation
  • Hymer GmbH & Co. KG
  • Dethleffs GmbH & Co. KG
  • Knaus Tabbert AG
  • Pilote Group
  • Adria Mobil d.o.o.
  • Bürstner GmbH & Co. KG
  • Laika Caravans S.p.A.
  • Chausson (Trigano Group)
  • Rapido Group
  • Jayco, Inc.
  • Coachmen RV
  • Fleetwood RV, Inc.
  • Fiat (Stellantis)
  • Ford Motor Company

Recent Development

  • In May 2025, Winnebago, a leading recreational vehicle manufacturer with over 60 years of experience, launched the Thrive, a lightweight travel trailer that emphasizes modern design and enhanced comfort. The new model targets consumers seeking compact, stylish, and easy-to-tow RV options that don't compromise on livability. This move responds to rising demand from younger buyers and eco-conscious travelers looking for affordable, towable RVs with modern features. It is likely to boost the towable RV chassis segment, encouraging other manufacturers to innovate in lightweight materials and compact chassis design. The launch strengthens market competition and broadens consumer choice in the mid-range trailer category.


  • In September 2024, THOR Industries unveiled a hybrid Class A motorhome built on Harbinger’s electric vehicle (EV) chassis, boasting a 500-mile driving range. The company has scheduled deliveries for 2025, marking a significant milestone in the transition toward electrified recreational vehicles. This innovation addresses growing environmental concerns and the demand for cleaner, long-range travel options. The 500-mile range makes it one of the most practical electric RVs to date, setting a new benchmark for performance in the segment.


Frequently Asked Questions (FAQ) :

Q1. What the main growth driving factors for this market?

The primary growth drivers are the surging consumer interest in outdoor tourism, road trips, and flexible travel, particularly among millennials and Gen Z. Rising disposable incomes globally enable more people to invest in RVs. Furthermore, the increasing adoption of the "van life" and remote work trends, which necessitate a mobile living and working space, fuels demand for specialized chassis. Technological advancements in chassis design for improved fuel efficiency, safety features (like ADAS), and the push toward electric RV platforms also stimulate market expansion.

Q2. What are the main restraining factors for this market?

Major restraining factors include the high initial and maintenance costs associated with RV ownership, which deters budget-conscious consumers. Fluctuations in raw material prices, particularly for steel and aluminum used in chassis manufacturing, increase production costs and final vehicle prices. Additionally, an insufficient charging infrastructure for the emerging electric RV segment and the impact of economic downturns, which reduce discretionary spending on luxury items like RVs, pose significant market hurdles.

Q3. Which segment is expected to witness high growth?

The Motorhome Chassis segment, particularly for Class B and C motorhomes, is expected to witness high growth. Class B (camper van) chassis are highly sought after due to the "van life" trend, their compact size, and ease of driving and parking. The market is also seeing rapid growth in chassis designed for electric/hybrid RVs, driven by stringent emission regulations and growing consumer preference for sustainable travel, which necessitates specialized EV-ready chassis.

Q4. Who are the top major players for this market?

The RV Chassis market is dominated by a few major automotive and specialized chassis manufacturers that supply to RV builders. The top major players include Ford Motor Company (for their E-Series and Transit chassis), Fiat Chrysler Automobiles (Stellantis) (especially with the Fiat Ducato/Ram ProMaster chassis popular in Europe/North America), and Mercedes-Benz (with the Sprinter chassis). Specialized RV component suppliers like Freightliner Custom Chassis Corporation and Oshkosh Corporation are also key players for larger motorhomes.

Q5. Which country is the largest player?

The United States is the largest and most established country-level market player for the RV Chassis market, supported by a deep-rooted RV culture, vast road network, and a large population of outdoor enthusiasts. North America, as a whole (including the US and Canada), dominates in terms of overall RV sales and subsequent chassis demand. The region has the highest concentration of major RV manufacturers and a strong culture of using large motorhomes and towable RVs.

Recreational Vehicle (RV) Chassis MARKET STUDY GLOBAL MARKET ANALYSIS, INSIGHTS AND FORECAST, 2022-2029

    1. Introduction

    • 1.1. Research Scope
    • 1.2. Market Segmentation
    • 1.3. Research Methodology
    • 1.4. Definitions and Assumptions

    2. Executive Summary

      3. Market Dynamics

      • 3.1. Market Drivers
      • 3.2. Market Restraints
      • 3.3. Market Opportunities

      4. Key Insights

      • 4.1. Key Emerging Trends – For Major Countries
      • 4.2. Latest Technological Advancement
      • 4.3. Regulatory Landscape
      • 4.4. Industry SWOT Analysis
      • 4.5. Porters Five Forces Analysis

      5. Global Recreational Vehicle (RV) Chassis Market Analysis (USD Billion), Insights and Forecast, 2018-2029

      • 5.1. Key Findings / Summary
      • 5.2. Market Analysis, Insights and Forecast – By Segment 1
        • 5.2.1. Sub-Segment 1
        • 5.2.2. Sub-Segment 2
      • 5.3. Market Analysis, Insights and Forecast – By Segment 2
        • 5.3.1. Sub-Segment 1
        • 5.3.2. Sub-Segment 2
        • 5.3.3. Sub-Segment 3
        • 5.3.4. Others
      • 5.4. Market Analysis, Insights and Forecast – By Segment 3
        • 5.4.1. Sub-Segment 1
        • 5.4.2. Sub-Segment 2
        • 5.4.3. Sub-Segment 3
        • 5.4.4. Others
      • 5.5. Market Analysis, Insights and Forecast – By Region
        • 5.5.1. North America
        • 5.5.2. Latin America
        • 5.5.3. Europe
        • 5.5.4. Asia Pacific
        • 5.5.5. Middle East and Africa

      6. North America Recreational Vehicle (RV) Chassis Market Analysis (USD Billion), Insights and Forecast, 2018-2029

      • 6.1. Key Findings / Summary
      • 6.2. Market Analysis, Insights and Forecast – By Segment 1
        • 6.2.1. Sub-Segment 1
        • 6.2.2. Sub-Segment 2
      • 6.3. Market Analysis, Insights and Forecast – By Segment 2
        • 6.3.1. Sub-Segment 1
        • 6.3.2. Sub-Segment 2
        • 6.3.3. Sub-Segment 3
        • 6.3.4. Others
      • 6.4. Market Analysis, Insights and Forecast – By Segment 3
        • 6.4.1. Sub-Segment 1
        • 6.4.2. Sub-Segment 2
        • 6.4.3. Sub-Segment 3
        • 6.4.4. Others
      • 6.5. Market Analysis, Insights and Forecast – By Country
        • 6.5.1. U.S.
        • 6.5.2. Canada

      7. Latin America Recreational Vehicle (RV) Chassis Market Analysis (USD Billion), Insights and Forecast, 2018-2029

      • 7.1. Key Findings / Summary
      • 7.2. Market Analysis, Insights and Forecast – By Segment 1
        • 7.2.1. Sub-Segment 1
        • 7.2.2. Sub-Segment 2
      • 7.3. Market Analysis, Insights and Forecast – By Segment 2
        • 7.3.1. Sub-Segment 1
        • 7.3.2. Sub-Segment 2
        • 7.3.3. Sub-Segment 3
        • 7.3.4. Others
      • 7.4. Market Analysis, Insights and Forecast – By Segment 3
        • 7.4.1. Sub-Segment 1
        • 7.4.2. Sub-Segment 2
        • 7.4.3. Sub-Segment 3
        • 7.4.4. Others
      • 7.5. Insights and Forecast – By Country
        • 7.5.1. Brazil
        • 7.5.2. Mexico
        • 7.5.3. Rest of Latin America

      8. Europe Recreational Vehicle (RV) Chassis Market Analysis (USD Billion), Insights and Forecast, 2018-2029

      • 8.1. Key Findings / Summary
      • 8.2. Market Analysis, Insights and Forecast – By Segment 1
        • 8.2.1. Sub-Segment 1
        • 8.2.2. Sub-Segment 2
      • 8.3. Market Analysis, Insights and Forecast – By Segment 2
        • 8.3.1. Sub-Segment 1
        • 8.3.2. Sub-Segment 2
        • 8.3.3. Sub-Segment 3
        • 8.3.4. Others
      • 8.4. Market Analysis, Insights and Forecast – By Segment 3
        • 8.4.1. Sub-Segment 1
        • 8.4.2. Sub-Segment 2
        • 8.4.3. Sub-Segment 3
        • 8.4.4. Others
      • 8.5. Market Analysis, Insights and Forecast – By Country
        • 8.5.1. UK
        • 8.5.2. Germany
        • 8.5.3. France
        • 8.5.4. Italy
        • 8.5.5. Spain
        • 8.5.6. Russia
        • 8.5.7. Rest of Europe

      9. Asia Pacific Recreational Vehicle (RV) Chassis Market Analysis (USD Billion), Insights and Forecast, 2018-2029

      • 9.1. Key Findings / Summary
      • 9.2. Market Analysis, Insights and Forecast – By Segment 1
        • 9.2.1. Sub-Segment 1
        • 9.2.2. Sub-Segment 2
      • 9.3. Market Analysis, Insights and Forecast – By Segment 2
        • 9.3.1. Sub-Segment 1
        • 9.3.2. Sub-Segment 2
        • 9.3.3. Sub-Segment 3
        • 9.3.4. Others
      • 9.4. Market Analysis, Insights and Forecast – By Segment 3
        • 9.4.1. Sub-Segment 1
        • 9.4.2. Sub-Segment 2
        • 9.4.3. Sub-Segment 3
        • 9.4.4. Others
      • 9.5. Market Analysis, Insights and Forecast – By Country
        • 9.5.1. China
        • 9.5.2. India
        • 9.5.3. Japan
        • 9.5.4. Australia
        • 9.5.5. South East Asia
        • 9.5.6. Rest of Asia Pacific

      10. Middle East & Africa Recreational Vehicle (RV) Chassis Market Analysis (USD Billion), Insights and Forecast, 2018-2029

      • 10.1. Key Findings / Summary
      • 10.2. Market Analysis, Insights and Forecast – By Segment 1
        • 10.2.1. Sub-Segment 1
        • 10.2.2. Sub-Segment 2
      • 10.3. Market Analysis, Insights and Forecast – By Segment 2
        • 10.3.1. Sub-Segment 1
        • 10.3.2. Sub-Segment 2
        • 10.3.3. Sub-Segment 3
        • 10.3.4. Others
      • 10.4. Market Analysis, Insights and Forecast – By Segment 3
        • 10.4.1. Sub-Segment 1
        • 10.4.2. Sub-Segment 2
        • 10.4.3. Sub-Segment 3
        • 10.4.4. Others
      • 10.5. Market Analysis, Insights and Forecast – By Country
        • 10.5.1. GCC
        • 10.5.2. South Africa
        • 10.5.3. Rest of Middle East & Africa

      11. Competitive Analysis

      • 11.1. Company Market Share Analysis, 2018
      • 11.2. Key Industry Developments
      • 11.3. Company Profile
        • 11.3.1. Company 1
          • 11.3.1.1. Business Overview
          • 11.3.1.2. Segment 1 & Service Offering
          • 11.3.1.3. Overall Revenue
          • 11.3.1.4. Geographic Presence
          • 11.3.1.5. Recent Development
        *Similar details will be provided for the following companies
        • 11.3.2. Company 2
        • 11.3.3. Company 3
        • 11.3.4. Company 4
        • 11.3.5. Company 5
        • 11.3.6. Company 6
        • 11.3.7. Company 7
        • 11.3.8. Company 8
        • 11.3.9. Company 9
        • 11.3.10. Company 10
        • 11.3.11. Company 11
        • 11.3.12. Company 12
      List of Figures

      Figure 1: Global Recreational Vehicle (RV) Chassis Market Revenue Breakdown (USD Billion, %) by Region, 2022 & 2029
      Figure 2: Global Recreational Vehicle (RV) Chassis Market Value Share (%), By Segment 1, 2022 & 2029
      Figure 3: Global Recreational Vehicle (RV) Chassis Market Forecast (USD Billion), by Sub-Segment 1, 2018-2029
      Figure 4: Global Recreational Vehicle (RV) Chassis Market Forecast (USD Billion), by Sub-Segment 2, 2018-2029
      Figure 5: Global Recreational Vehicle (RV) Chassis Market Value Share (%), By Segment 2, 2022 & 2029
      Figure 6: Global Recreational Vehicle (RV) Chassis Market Forecast (USD Billion), by Sub-Segment 1, 2018-2029
      Figure 7: Global Recreational Vehicle (RV) Chassis Market Forecast (USD Billion), by Sub-Segment 2, 2018-2029
      Figure 8: Global Recreational Vehicle (RV) Chassis Market Forecast (USD Billion), by Sub-Segment 3, 2018-2029
      Figure 9: Global Recreational Vehicle (RV) Chassis Market Forecast (USD Billion), by Others, 2018-2029
      Figure 10: Global Recreational Vehicle (RV) Chassis Market Value Share (%), By Segment 3, 2022 & 2029
      Figure 11: Global Recreational Vehicle (RV) Chassis Market Forecast (USD Billion), by Sub-Segment 1, 2018-2029
      Figure 12: Global Recreational Vehicle (RV) Chassis Market Forecast (USD Billion), by Sub-Segment 2, 2018-2029
      Figure 13: Global Recreational Vehicle (RV) Chassis Market Forecast (USD Billion), by Sub-Segment 3, 2018-2029
      Figure 14: Global Recreational Vehicle (RV) Chassis Market Forecast (USD Billion), by Others, 2018-2029
      Figure 15: Global Recreational Vehicle (RV) Chassis Market Value (USD Billion), by Region, 2022 & 2029
      Figure 16: North America Recreational Vehicle (RV) Chassis Market Value Share (%), By Segment 1, 2022 & 2029
      Figure 17: North America Recreational Vehicle (RV) Chassis Market Forecast (USD Billion), by Sub-Segment 1, 2018-2029
      Figure 18: North America Recreational Vehicle (RV) Chassis Market Forecast (USD Billion), by Sub-Segment 2, 2018-2029
      Figure 19: North America Recreational Vehicle (RV) Chassis Market Value Share (%), By Segment 2, 2022 & 2029
      Figure 20: North America Recreational Vehicle (RV) Chassis Market Forecast (USD Billion), by Sub-Segment 1, 2018-2029
      Figure 21: North America Recreational Vehicle (RV) Chassis Market Forecast (USD Billion), by Sub-Segment 2, 2018-2029
      Figure 22: North America Recreational Vehicle (RV) Chassis Market Forecast (USD Billion), by Sub-Segment 3, 2018-2029
      Figure 23: North America Recreational Vehicle (RV) Chassis Market Forecast (USD Billion), by Others, 2018-2029
      Figure 24: North America Recreational Vehicle (RV) Chassis Market Value Share (%), By Segment 3, 2022 & 2029
      Figure 25: North America Recreational Vehicle (RV) Chassis Market Forecast (USD Billion), by Sub-Segment 1, 2018-2029
      Figure 26: North America Recreational Vehicle (RV) Chassis Market Forecast (USD Billion), by Sub-Segment 2, 2018-2029
      Figure 27: North America Recreational Vehicle (RV) Chassis Market Forecast (USD Billion), by Sub-Segment 3, 2018-2029
      Figure 28: North America Recreational Vehicle (RV) Chassis Market Forecast (USD Billion), by Others, 2018-2029
      Figure 29: North America Recreational Vehicle (RV) Chassis Market Forecast (USD Billion), by U.S., 2018-2029
      Figure 30: North America Recreational Vehicle (RV) Chassis Market Forecast (USD Billion), by Canada, 2018-2029
      Figure 31: Latin America Recreational Vehicle (RV) Chassis Market Value Share (%), By Segment 1, 2022 & 2029
      Figure 32: Latin America Recreational Vehicle (RV) Chassis Market Forecast (USD Billion), by Sub-Segment 1, 2018-2029
      Figure 33: Latin America Recreational Vehicle (RV) Chassis Market Forecast (USD Billion), by Sub-Segment 2, 2018-2029
      Figure 34: Latin America Recreational Vehicle (RV) Chassis Market Value Share (%), By Segment 2, 2022 & 2029
      Figure 35: Latin America Recreational Vehicle (RV) Chassis Market Forecast (USD Billion), by Sub-Segment 1, 2018-2029
      Figure 36: Latin America Recreational Vehicle (RV) Chassis Market Forecast (USD Billion), by Sub-Segment 2, 2018-2029
      Figure 37: Latin America Recreational Vehicle (RV) Chassis Market Forecast (USD Billion), by Sub-Segment 3, 2018-2029
      Figure 38: Latin America Recreational Vehicle (RV) Chassis Market Forecast (USD Billion), by Others, 2018-2029
      Figure 39: Latin America Recreational Vehicle (RV) Chassis Market Value Share (%), By Segment 3, 2022 & 2029
      Figure 40: Latin America Recreational Vehicle (RV) Chassis Market Forecast (USD Billion), by Sub-Segment 1, 2018-2029
      Figure 41: Latin America Recreational Vehicle (RV) Chassis Market Forecast (USD Billion), by Sub-Segment 2, 2018-2029
      Figure 42: Latin America Recreational Vehicle (RV) Chassis Market Forecast (USD Billion), by Sub-Segment 3, 2018-2029
      Figure 43: Latin America Recreational Vehicle (RV) Chassis Market Forecast (USD Billion), by Others, 2018-2029
      Figure 44: Latin America Recreational Vehicle (RV) Chassis Market Forecast (USD Billion), by Brazil, 2018-2029
      Figure 45: Latin America Recreational Vehicle (RV) Chassis Market Forecast (USD Billion), by Mexico, 2018-2029
      Figure 46: Latin America Recreational Vehicle (RV) Chassis Market Forecast (USD Billion), by Rest of Latin America, 2018-2029
      Figure 47: Europe Recreational Vehicle (RV) Chassis Market Value Share (%), By Segment 1, 2022 & 2029
      Figure 48: Europe Recreational Vehicle (RV) Chassis Market Forecast (USD Billion), by Sub-Segment 1, 2018-2029
      Figure 49: Europe Recreational Vehicle (RV) Chassis Market Forecast (USD Billion), by Sub-Segment 2, 2018-2029
      Figure 50: Europe Recreational Vehicle (RV) Chassis Market Value Share (%), By Segment 2, 2022 & 2029
      Figure 51: Europe Recreational Vehicle (RV) Chassis Market Forecast (USD Billion), by Sub-Segment 1, 2018-2029
      Figure 52: Europe Recreational Vehicle (RV) Chassis Market Forecast (USD Billion), by Sub-Segment 2, 2018-2029
      Figure 53: Europe Recreational Vehicle (RV) Chassis Market Forecast (USD Billion), by Sub-Segment 3, 2018-2029
      Figure 54: Europe Recreational Vehicle (RV) Chassis Market Forecast (USD Billion), by Others, 2018-2029
      Figure 55: Europe Recreational Vehicle (RV) Chassis Market Value Share (%), By Segment 3, 2022 & 2029
      Figure 56: Europe Recreational Vehicle (RV) Chassis Market Forecast (USD Billion), by Sub-Segment 1, 2018-2029
      Figure 57: Europe Recreational Vehicle (RV) Chassis Market Forecast (USD Billion), by Sub-Segment 2, 2018-2029
      Figure 58: Europe Recreational Vehicle (RV) Chassis Market Forecast (USD Billion), by Sub-Segment 3, 2018-2029
      Figure 59: Europe Recreational Vehicle (RV) Chassis Market Forecast (USD Billion), by Others, 2018-2029
      Figure 60: Europe Recreational Vehicle (RV) Chassis Market Forecast (USD Billion), by U.K., 2018-2029
      Figure 61: Europe Recreational Vehicle (RV) Chassis Market Forecast (USD Billion), by Germany, 2018-2029
      Figure 62: Europe Recreational Vehicle (RV) Chassis Market Forecast (USD Billion), by France, 2018-2029
      Figure 63: Europe Recreational Vehicle (RV) Chassis Market Forecast (USD Billion), by Italy, 2018-2029
      Figure 64: Europe Recreational Vehicle (RV) Chassis Market Forecast (USD Billion), by Spain, 2018-2029
      Figure 65: Europe Recreational Vehicle (RV) Chassis Market Forecast (USD Billion), by Russia, 2018-2029
      Figure 66: Europe Recreational Vehicle (RV) Chassis Market Forecast (USD Billion), by Rest of Europe, 2018-2029
      Figure 67: Asia Pacific Recreational Vehicle (RV) Chassis Market Value Share (%), By Segment 1, 2022 & 2029
      Figure 68: Asia Pacific Recreational Vehicle (RV) Chassis Market Forecast (USD Billion), by Sub-Segment 1, 2018-2029
      Figure 69: Asia Pacific Recreational Vehicle (RV) Chassis Market Forecast (USD Billion), by Sub-Segment 2, 2018-2029
      Figure 70: Asia Pacific Recreational Vehicle (RV) Chassis Market Value Share (%), By Segment 2, 2022 & 2029
      Figure 71: Asia Pacific Recreational Vehicle (RV) Chassis Market Forecast (USD Billion), by Sub-Segment 1, 2018-2029
      Figure 72: Asia Pacific Recreational Vehicle (RV) Chassis Market Forecast (USD Billion), by Sub-Segment 2, 2018-2029
      Figure 73: Asia Pacific Recreational Vehicle (RV) Chassis Market Forecast (USD Billion), by Sub-Segment 3, 2018-2029
      Figure 74: Asia Pacific Recreational Vehicle (RV) Chassis Market Forecast (USD Billion), by Others, 2018-2029
      Figure 75: Asia Pacific Recreational Vehicle (RV) Chassis Market Value Share (%), By Segment 3, 2022 & 2029
      Figure 76: Asia Pacific Recreational Vehicle (RV) Chassis Market Forecast (USD Billion), by Sub-Segment 1, 2018-2029
      Figure 77: Asia Pacific Recreational Vehicle (RV) Chassis Market Forecast (USD Billion), by Sub-Segment 2, 2018-2029
      Figure 78: Asia Pacific Recreational Vehicle (RV) Chassis Market Forecast (USD Billion), by Sub-Segment 3, 2018-2029
      Figure 79: Asia Pacific Recreational Vehicle (RV) Chassis Market Forecast (USD Billion), by Others, 2018-2029
      Figure 80: Asia Pacific Recreational Vehicle (RV) Chassis Market Forecast (USD Billion), by China, 2018-2029
      Figure 81: Asia Pacific Recreational Vehicle (RV) Chassis Market Forecast (USD Billion), by India, 2018-2029
      Figure 82: Asia Pacific Recreational Vehicle (RV) Chassis Market Forecast (USD Billion), by Japan, 2018-2029
      Figure 83: Asia Pacific Recreational Vehicle (RV) Chassis Market Forecast (USD Billion), by Australia, 2018-2029
      Figure 84: Asia Pacific Recreational Vehicle (RV) Chassis Market Forecast (USD Billion), by Southeast Asia, 2018-2029
      Figure 85: Asia Pacific Recreational Vehicle (RV) Chassis Market Forecast (USD Billion), by Rest of Asia Pacific, 2018-2029
      Figure 86: Middle East & Africa Recreational Vehicle (RV) Chassis Market Value Share (%), By Segment 1, 2022 & 2029
      Figure 87: Middle East & Africa Recreational Vehicle (RV) Chassis Market Forecast (USD Billion), by Sub-Segment 1, 2018-2029
      Figure 88: Middle East & Africa Recreational Vehicle (RV) Chassis Market Forecast (USD Billion), by Sub-Segment 2, 2018-2029
      Figure 89: Middle East & Africa Recreational Vehicle (RV) Chassis Market Value Share (%), By Segment 2, 2022 & 2029
      Figure 90: Middle East & Africa Recreational Vehicle (RV) Chassis Market Forecast (USD Billion), by Sub-Segment 1, 2018-2029
      Figure 91: Middle East & Africa Recreational Vehicle (RV) Chassis Market Forecast (USD Billion), by Sub-Segment 2, 2018-2029
      Figure 92: Middle East & Africa Recreational Vehicle (RV) Chassis Market Forecast (USD Billion), by Sub-Segment 3, 2018-2029
      Figure 93: Middle East & Africa Recreational Vehicle (RV) Chassis Market Forecast (USD Billion), by Others, 2018-2029
      Figure 94: Middle East & Africa Recreational Vehicle (RV) Chassis Market Value Share (%), By Segment 3, 2022 & 2029
      Figure 95: Middle East & Africa Recreational Vehicle (RV) Chassis Market Forecast (USD Billion), by Sub-Segment 1, 2018-2029
      Figure 96: Middle East & Africa Recreational Vehicle (RV) Chassis Market Forecast (USD Billion), by Sub-Segment 2, 2018-2029
      Figure 97: Middle East & Africa Recreational Vehicle (RV) Chassis Market Forecast (USD Billion), by Sub-Segment 3, 2018-2029
      Figure 98: Middle East & Africa Recreational Vehicle (RV) Chassis Market Forecast (USD Billion), by Others, 2018-2029
      Figure 99: Middle East & Africa Recreational Vehicle (RV) Chassis Market Forecast (USD Billion), by GCC, 2018-2029
      Figure 100: Middle East & Africa Recreational Vehicle (RV) Chassis Market Forecast (USD Billion), by South Africa, 2018-2029
      Figure 101: Middle East & Africa Recreational Vehicle (RV) Chassis Market Forecast (USD Billion), by Rest of Middle East & Africa, 2018-2029 
      List of Tables
      Table 1: Global Recreational Vehicle (RV) Chassis Market Revenue (USD Billion) Forecast, by Segment 1, 2018-2029
      Table 2: Global Recreational Vehicle (RV) Chassis Market Revenue (USD Billion) Forecast, by Segment 2, 2018-2029
      Table 3: Global Recreational Vehicle (RV) Chassis Market Revenue (USD Billion) Forecast, by Segment 3, 2018-2029
      Table 4: Global Recreational Vehicle (RV) Chassis Market Revenue (USD Billion) Forecast, by Region, 2018-2029
      Table 5: North America Recreational Vehicle (RV) Chassis Market Revenue (USD Billion) Forecast, by Segment 1, 2018-2029
      Table 6: North America Recreational Vehicle (RV) Chassis Market Revenue (USD Billion) Forecast, by Segment 2, 2018-2029
      Table 7: North America Recreational Vehicle (RV) Chassis Market Revenue (USD Billion) Forecast, by Segment 3, 2018-2029
      Table 8: North America Recreational Vehicle (RV) Chassis Market Revenue (USD Billion) Forecast, by Country, 2018-2029
      Table 9: Europe Recreational Vehicle (RV) Chassis Market Revenue (USD Billion) Forecast, by Segment 1, 2018-2029
      Table 10: Europe Recreational Vehicle (RV) Chassis Market Revenue (USD Billion) Forecast, by Segment 2, 2018-2029
      Table 11: Europe Recreational Vehicle (RV) Chassis Market Revenue (USD Billion) Forecast, by Segment 3, 2018-2029
      Table 12: Europe Recreational Vehicle (RV) Chassis Market Revenue (USD Billion) Forecast, by Country, 2018-2029
      Table 13: Latin America Recreational Vehicle (RV) Chassis Market Revenue (USD Billion) Forecast, by Segment 1, 2018-2029
      Table 14: Latin America Recreational Vehicle (RV) Chassis Market Revenue (USD Billion) Forecast, by Segment 2, 2018-2029
      Table 15: Latin America Recreational Vehicle (RV) Chassis Market Revenue (USD Billion) Forecast, by Segment 3, 2018-2029
      Table 16: Latin America Recreational Vehicle (RV) Chassis Market Revenue (USD Billion) Forecast, by Country, 2018-2029
      Table 17: Asia Pacific Recreational Vehicle (RV) Chassis Market Revenue (USD Billion) Forecast, by Segment 1, 2018-2029
      Table 18: Asia Pacific Recreational Vehicle (RV) Chassis Market Revenue (USD Billion) Forecast, by Segment 2, 2018-2029
      Table 19: Asia Pacific Recreational Vehicle (RV) Chassis Market Revenue (USD Billion) Forecast, by Segment 3, 2018-2029
      Table 20: Asia Pacific Recreational Vehicle (RV) Chassis Market Revenue (USD Billion) Forecast, by Country, 2018-2029
      Table 21: Middle East & Africa Recreational Vehicle (RV) Chassis Market Revenue (USD Billion) Forecast, by Segment 1, 2018-2029
      Table 22: Middle East & Africa Recreational Vehicle (RV) Chassis Market Revenue (USD Billion) Forecast, by Segment 2, 2018-2029
      Table 23: Middle East & Africa Recreational Vehicle (RV) Chassis Market Revenue (USD Billion) Forecast, by Segment 3, 2018-2029
      Table 24: Middle East & Africa Recreational Vehicle (RV) Chassis Market Revenue (USD Billion) Forecast, by Country, 2018-2029
      Research Process

      Data Library Research are conducted by industry experts who offer insight on industry structure, market segmentations technology assessment and competitive landscape (CL), and penetration, as well as on emerging trends. Their analysis is based on primary interviews (~ 80%) and secondary research (~ 20%) as well as years of professional expertise in their respective industries. Adding to this, by analysing historical trends and current market positions, our analysts predict where the market will be headed for the next five years. Furthermore, the varying trends of segment & categories geographically presented are also studied and the estimated based on the primary & secondary research.

      In this particular report from the supply side Data Library Research has conducted primary surveys (interviews) with the key level executives (VP, CEO’s, Marketing Director, Business Development Manager and SOFT) of the companies that active & prominent as well as the midsized organization

      FIGURE 1: DLR RESEARH PROCESS

      research-methodology1

      Primary Research

      Extensive primary research was conducted to gain a deeper insight of the market and industry performance. The analysis is based on both primary and secondary research as well as years of professional expertise in the respective industries.

      In addition to analysing current and historical trends, our analysts predict where the market is headed over the next five years.

      It varies by segment for these categories geographically presented in the list of market tables. Speaking about this particular report we have conducted primary surveys (interviews) with the key level executives (VP, CEO’s, Marketing Director, Business Development Manager and many more) of the major players active in the market.

      Secondary Research

      Secondary research was mainly used to collect and identify information useful for the extensive, technical, market-oriented, and Friend’s study of the Global Extra Neutral Alcohol. It was also used to obtain key information about major players, market classification and segmentation according to the industry trends, geographical markets, and developments related to the market and technology perspectives. For this study, analysts have gathered information from various credible sources, such as annual reports, sec filings, journals, white papers, SOFT presentations, and company web sites.

      Market Size Estimation

      Both, top-down and bottom-up approaches were used to estimate and validate the size of the Global market and to estimate the size of various other dependent submarkets in the overall Extra Neutral Alcohol. The key players in the market were identified through secondary research and their market contributions in the respective geographies were determined through primary and secondary research.

      Forecast Model

      research-methodology2

      Happy to Assist You

      If you have a question?

      info@datalibraryresearch.com

      IND : +91 955 279 0357

      Browse Related Reports