Buyer's Consolidation Solution Market Overview and Analysis
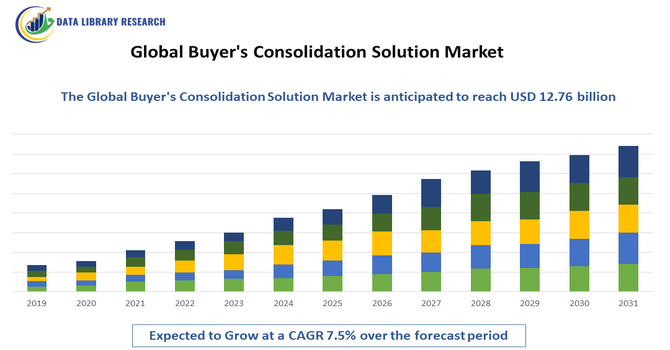
- This market is projected to reach over USD 12.76 billion by 2032, from USD 4.87 billion in 2025. The market is forecasted to expand at a healthy rate, with a CAGR of 7.5% over the forecast period, 2025-2032.
Get Complete Analysis Of The Report - Download Updated Free Sample PDF
The growth of the Global Buyer’s Consolidation Solution Market is primarily driven by the rapid expansion of international trade, increasing demand for efficient supply chain management, and the growing need to reduce logistics costs for importers and exporters. As businesses seek to optimize freight operations, buyer’s consolidation solutions enable multiple smaller shipments from different suppliers to be combined into a single full-container load, minimizing transportation expenses and improving delivery timelines. The surge in e-commerce, cross-border retailing, and just-in-time inventory practices has further intensified the adoption of these solutions.
Buyer's Consolidation Solution Market Latest Trends
The Global Buyer’s Consolidation Solution Market is currently shaped by several compelling trends. A major shift is the adoption of digital consolidation platforms leveraging AI, machine learning, and real-time analytics, which enable automated grouping of shipments, optimized routing, and seamless cross-border visibility. Another key trend is the increasing use of eco-conscious consolidation strategies, whereby companies combine smaller shipments into fuller loads to cut logistics costs, improve container utilization and reduce carbon emissions—aligning with wider sustainability goals. Moreover, the rapid expansion of e-commerce and multi-supplier global sourcing is driving demand for buyer’s consolidation services, as businesses seek to manage fragmented supplier shipments and complex supply chains more efficiently.
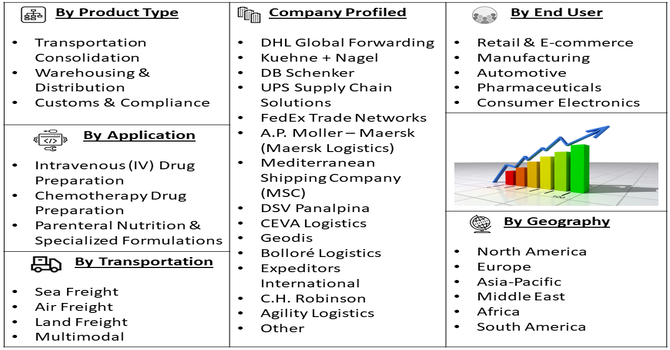
Segmentation: Global Buyer's Consolidation Solution Market is segmented by Service Type (Transportation Consolidation, Warehousing & Distribution, Customs & Compliance), Mode of Transportation (Sea Freight, Air Freight, Land Freight, Multimodal), End User (Retail & E-commerce, Manufacturing, Automotive, Pharmaceuticals, Consumer Electronics), and Geography (North America, Europe, Asia-Pacific, Middle East and Africa, and South America). The report provides the value (in USD million) for the above segments.
For Detailed Market Segmentation - Get a Free Sample PDF
Market Drivers:
- Growing Global Trade and Supply Chain Optimization Needs
The primary drivers of the Global Buyer’s Consolidation Solution Market is the rapid expansion of international trade and the increasing complexity of global supply chains. Companies sourcing goods from multiple suppliers or regions are increasingly turning to buyer’s consolidation services to optimize container utilization, reduce shipping costs, and improve overall logistics efficiency. For instance, in October 2025, Mahindra Logistics Limited expanded its Eastern India operations by launching two state-of-the-art Grade A warehouses in Guwahati and Agartala, adding over 400,000 sq. ft. of capacity. The facilities enhanced regional connectivity, operational efficiency, and distribution capabilities, addressing rising demand for integrated logistics. This expansion underscored the importance of supply chain optimization and consolidation solutions, contributing to the growth and adoption of global buyer’s consolidation solutions amid increasing global trade.
- Rising Demand from E-commerce and Retail Sectors
The surge in e-commerce and omnichannel retail has significantly boosted the need for efficient consolidation solutions. With retailers managing multiple suppliers and frequent smaller shipments, buyer’s consolidation services help in reducing last-mile delivery costs, warehouse congestion, and shipping time variability. For instance, in November 2025, Instacart partnered with Associated Food Stores to implement its white-label e-commerce solutions, Storefront and Storefront Pro, across over 45 banners. This collaboration enabled both owned and independent stores to quickly expand into online grocery, streamline order management, and improve delivery efficiency. The initiative accelerated the adoption of buyers’ consolidation solutions by enhancing supply chain coordination and meeting the rising demand from e-commerce and retail sectors in North America and globally.
Market Restraints
- Complexity of Coordination and Operational Management
The major restraints hindering the growth of the Global Buyer’s Consolidation Solution Market is the complexity of coordination and operational management involved in the consolidation process. Managing shipments from multiple suppliers, ensuring documentation accuracy, synchronizing delivery schedules, and maintaining cargo integrity require advanced logistics planning and robust digital infrastructure. Small and medium-sized enterprises (SMEs), in particular, often face difficulties in implementing such systems due to limited technical expertise and financial resources.
Socio-Economic Impact on Buyer's Consolidation Solution Market
The global buyer’s consolidation solution market has had a notable socioeconomic impact by streamlining procurement and supply chain operations for businesses worldwide. These solutions reduced costs, improved efficiency, and minimized delays by consolidating multiple suppliers and shipments into a single, manageable process. Companies could better manage inventory and resources, leading to higher productivity and profitability. Additionally, the market created jobs in logistics, IT, and supply chain management, encouraged technological innovation, and strengthened global trade networks, ultimately supporting economic growth while helping businesses deliver goods more reliably and efficiently to consumers.
Segmental Analysis:
- Transportation Consolidation segment is expected to witness the highest growth over the forecast period
The transportation consolidation segment holds a significant share of the market, as it focuses on combining smaller shipments from multiple suppliers into full container loads to optimize space utilization and reduce freight costs. This service is particularly beneficial for businesses importing goods from diverse suppliers, helping them minimize logistics expenses while improving delivery timelines. The rising trend of global sourcing and the need for efficient load management are driving the demand for transportation consolidation services across international trade networks.
- Sea Freight segment is expected to witness the highest growth over the forecast period
Sea freight dominates the buyer’s consolidation market due to its cost-effectiveness and suitability for bulk cargo movement across long distances. Many global shippers prefer sea freight for consolidated shipments as it offers scalability and lower per-unit costs compared to other transport modes. With the continuous expansion of global maritime trade routes and the adoption of digital freight platforms, sea freight consolidation has become a critical component for optimizing international supply chains, especially for industries like retail and manufacturing.
- Retail & E-commerce segment is expected to witness the highest growth over the forecast period
The retail and e-commerce segment is expected to witness the fastest growth during the forecast period. The surge in cross-border online shopping, coupled with the need to manage diverse supplier networks efficiently, has made consolidation solutions vital for e-commerce players. Retailers leverage buyer’s consolidation to reduce shipping costs, streamline inventory management, and accelerate delivery times. As consumer expectations for faster and more economical delivery rise, logistics providers are developing tailored consolidation models for e-commerce fulfillment centers.
- North America region is expected to witness the highest growth over the forecast period
The North America region is expected to witness the highest growth over the forecast period in the Global Buyer’s Consolidation Solution Market. This growth is driven by the region’s highly developed logistics infrastructure, advanced supply chain management systems, and the increasing adoption of digital freight and warehouse automation technologies.
The strong presence of major retail and e-commerce companies, such as Amazon, Walmart, and Target, has significantly increased the demand for efficient consolidation solutions to optimize inventory and transportation costs. For instance, in August 2025, Honeywell collaborated with Stereolabs to develop a mobile solution that accurately measured the size, volume, and weight of boxes and pallets in distribution centers. By combining stereoscopic AI cameras with SwiftDecoder software, the solution improved truck loading planning, shipment tracing, and delivery efficiency. This innovation enhanced supply chain optimization, reduced shipping costs, and supported the growth of buyers’ consolidation solutions in North America amid increasing global trade demands.
Similarly, in May 2025, Kao, a Japan-based FMCG manufacturer, streamlined its logistics operations across the Americas to enhance service levels and maintain a competitive edge. By optimizing supply chain processes and consolidating shipments, the company reduced costs, improved delivery efficiency, and better managed inventory. This strategic approach supported supply chain optimization and highlighted the growing adoption of buyers’ consolidation solutions in North America to meet increasing demands from global trade and fast-moving consumer markets.
Moreover, the growing emphasis on sustainability, reduced carbon emissions, and improved operational efficiency is pushing logistics providers to adopt consolidation strategies. Additionally, the rise in cross-border trade between the U.S., Canada, and Mexico under the USMCA agreement further supports market expansion, as companies seek streamlined, cost-effective solutions for international shipments.
| Report Matrics |
Details |
| Market Size Value |
USD 12.76 billion |
| Growth Rate |
CAGR of 7.5% |
| Forecast |
2026-2033 |
| Historical data |
2021-2024 |
| Base Year |
2025 |
| Report Coverage |
Forecasted revenue, company rating, competitive environment, growth drivers, and trends |
| Segment Coverage |
Type, Application, End-User, Geography |
| Regional Scope |
North America, Europe, Asia Pacific, Middle East |
| Customized scope |
Free customization of reports (With 3 months' analysis support) |
| To Learn More About This Report |
Request a Free Sample Copy |
Buyer's Consolidation Solution Market Competitive Landscape:
The competitive landscape is a mix of large global 3PLs, traditional freight forwarders, and fast-growing digital freight-consolidation platforms. Incumbent logistics providers compete on global network reach, carrier contracts, and end-to-end customs/warehouse capabilities, while digital natives differentiate with AI-driven load optimization, real-time visibility, and simplified booking/payment flows for multi-supplier consolidation. Strategic partnerships with carriers, e-commerce platforms, and regional warehousing hubs are common as firms seek scale and faster lead times. Sustainability (lower carbon per-unit shipment), compliance expertise, and value-added services (packaging, labeling, customs preclearance) are key differentiators. Price competitiveness, technology integration, and reliability of cross-border execution determine market leadership in this rapidly evolving segment.
Key Players:
- DHL Global Forwarding
- Kuehne + Nagel
- DB Schenker
- UPS Supply Chain Solutions
- FedEx Trade Networks
- A.P. Moller – Maersk (Maersk Logistics)
- Mediterranean Shipping Company (MSC)
- DSV Panalpina
- CEVA Logistics
- Geodis
- Bolloré Logistics
- Expeditors International
- C.H. Robinson
- Agility Logistics
- Kerry Logistics Network
- Nippon Express
- Sinotrans
- Flexport
- Freightos (WebCargo)
- ShipBob
Recent Development
- In November 2025, Logistics Reply, part of the Reply Group, expanded its collaboration with PUMA to optimize daily logistics operations and enhance user experience using GaliLEA, an AI-powered assistant on the LEA Reply platform. This partnership demonstrated the growing role of AI-driven solutions in streamlining procurement and supply chain processes, boosting efficiency, and reducing costs, thereby strengthening adoption and growth in the global buyer’s consolidation solution market.
- In January 2021, Zepto, as a 10-minute delivery start-up, grew into one of India’s largest quick-commerce companies. By combining NX Logistics India’s expertise with Zepto’s innovative model, the partnership enhanced efficiency, reduced delivery times, and streamlined supply chain operations. This collaboration highlighted the increasing importance of consolidated logistics and quick fulfillment, driving growth and adoption in the global buyer’s consolidation solution market.
Frequently Asked Questions (FAQ) :
Q1. What are the main growth-driving factors for this market?
The market is primarily driven by the rapid globalization of supply chains and the explosive growth of the e-commerce sector. As businesses source products from multiple suppliers across various countries, consolidation services become essential for reducing logistics costs, optimizing container utilization, and ensuring streamlined inventory flow. The rising demand for cost-effective and efficient international shipping is continuously accelerating the adoption of these solutions worldwide.
Q2. What are the main restraining factors for this market?
One of the main restraining factors involves the complexity of integrating buyer's consolidation services with the diverse legacy IT systems used by various suppliers and logistics partners. Additionally, frequent changes in international trade and customs regulations can pose significant compliance challenges for the service providers, potentially leading to shipment delays or unexpected costs. Overcoming these integration and regulatory hurdles can slow market expansion.
Q3. Which segment is expected to witness high growth?
The retail industry is expected to remain the largest and fastest-growing end-user segment for buyer's consolidation solutions. Major retailers source high volumes of goods, such as apparel and electronics, from numerous manufacturing hubs. Consolidating these separate supplier shipments into full container loads (FCL) before transport via sea freight allows retailers to significantly lower their overall shipping expenditure and improve time-to-market efficiency.
Q4. Who are the top major players for this market?
The market is dominated by global logistics and freight forwarding giants that offer extensive network coverage. Top major players include Kuehne + Nagel, DHL Global Forwarding, DB Schenker, DSV Panalpina, and Expeditors International. These companies leverage their vast infrastructure, warehousing capabilities, and advanced technological platforms to offer integrated, end-to-end consolidation services to large multinational corporations.
Q5. Which country is the largest player?
North America is expected to witness the highest growth in the global buyer’s consolidation solution market due to advanced supply chain infrastructure, widespread adoption of digital procurement tools, and strong e-commerce growth. Businesses increasingly relied on consolidation solutions to reduce costs, improve efficiency, and streamline supplier and shipment management.
List of Figures
Figure 1: Global Buyer's Consolidation Solution Market Revenue Breakdown (USD Billion, %) by Region, 2022 & 2029
Figure 2: Global Buyer's Consolidation Solution Market Value Share (%), By Segment 1, 2022 & 2029
Figure 3: Global Buyer's Consolidation Solution Market Forecast (USD Billion), by Sub-Segment 1, 2018-2029
Figure 4: Global Buyer's Consolidation Solution Market Forecast (USD Billion), by Sub-Segment 2, 2018-2029
Figure 5: Global Buyer's Consolidation Solution Market Value Share (%), By Segment 2, 2022 & 2029
Figure 6: Global Buyer's Consolidation Solution Market Forecast (USD Billion), by Sub-Segment 1, 2018-2029
Figure 7: Global Buyer's Consolidation Solution Market Forecast (USD Billion), by Sub-Segment 2, 2018-2029
Figure 8: Global Buyer's Consolidation Solution Market Forecast (USD Billion), by Sub-Segment 3, 2018-2029
Figure 9: Global Buyer's Consolidation Solution Market Forecast (USD Billion), by Others, 2018-2029
Figure 10: Global Buyer's Consolidation Solution Market Value Share (%), By Segment 3, 2022 & 2029
Figure 11: Global Buyer's Consolidation Solution Market Forecast (USD Billion), by Sub-Segment 1, 2018-2029
Figure 12: Global Buyer's Consolidation Solution Market Forecast (USD Billion), by Sub-Segment 2, 2018-2029
Figure 13: Global Buyer's Consolidation Solution Market Forecast (USD Billion), by Sub-Segment 3, 2018-2029
Figure 14: Global Buyer's Consolidation Solution Market Forecast (USD Billion), by Others, 2018-2029
Figure 15: Global Buyer's Consolidation Solution Market Value (USD Billion), by Region, 2022 & 2029
Figure 16: North America Buyer's Consolidation Solution Market Value Share (%), By Segment 1, 2022 & 2029
Figure 17: North America Buyer's Consolidation Solution Market Forecast (USD Billion), by Sub-Segment 1, 2018-2029
Figure 18: North America Buyer's Consolidation Solution Market Forecast (USD Billion), by Sub-Segment 2, 2018-2029
Figure 19: North America Buyer's Consolidation Solution Market Value Share (%), By Segment 2, 2022 & 2029
Figure 20: North America Buyer's Consolidation Solution Market Forecast (USD Billion), by Sub-Segment 1, 2018-2029
Figure 21: North America Buyer's Consolidation Solution Market Forecast (USD Billion), by Sub-Segment 2, 2018-2029
Figure 22: North America Buyer's Consolidation Solution Market Forecast (USD Billion), by Sub-Segment 3, 2018-2029
Figure 23: North America Buyer's Consolidation Solution Market Forecast (USD Billion), by Others, 2018-2029
Figure 24: North America Buyer's Consolidation Solution Market Value Share (%), By Segment 3, 2022 & 2029
Figure 25: North America Buyer's Consolidation Solution Market Forecast (USD Billion), by Sub-Segment 1, 2018-2029
Figure 26: North America Buyer's Consolidation Solution Market Forecast (USD Billion), by Sub-Segment 2, 2018-2029
Figure 27: North America Buyer's Consolidation Solution Market Forecast (USD Billion), by Sub-Segment 3, 2018-2029
Figure 28: North America Buyer's Consolidation Solution Market Forecast (USD Billion), by Others, 2018-2029
Figure 29: North America Buyer's Consolidation Solution Market Forecast (USD Billion), by U.S., 2018-2029
Figure 30: North America Buyer's Consolidation Solution Market Forecast (USD Billion), by Canada, 2018-2029
Figure 31: Latin America Buyer's Consolidation Solution Market Value Share (%), By Segment 1, 2022 & 2029
Figure 32: Latin America Buyer's Consolidation Solution Market Forecast (USD Billion), by Sub-Segment 1, 2018-2029
Figure 33: Latin America Buyer's Consolidation Solution Market Forecast (USD Billion), by Sub-Segment 2, 2018-2029
Figure 34: Latin America Buyer's Consolidation Solution Market Value Share (%), By Segment 2, 2022 & 2029
Figure 35: Latin America Buyer's Consolidation Solution Market Forecast (USD Billion), by Sub-Segment 1, 2018-2029
Figure 36: Latin America Buyer's Consolidation Solution Market Forecast (USD Billion), by Sub-Segment 2, 2018-2029
Figure 37: Latin America Buyer's Consolidation Solution Market Forecast (USD Billion), by Sub-Segment 3, 2018-2029
Figure 38: Latin America Buyer's Consolidation Solution Market Forecast (USD Billion), by Others, 2018-2029
Figure 39: Latin America Buyer's Consolidation Solution Market Value Share (%), By Segment 3, 2022 & 2029
Figure 40: Latin America Buyer's Consolidation Solution Market Forecast (USD Billion), by Sub-Segment 1, 2018-2029
Figure 41: Latin America Buyer's Consolidation Solution Market Forecast (USD Billion), by Sub-Segment 2, 2018-2029
Figure 42: Latin America Buyer's Consolidation Solution Market Forecast (USD Billion), by Sub-Segment 3, 2018-2029
Figure 43: Latin America Buyer's Consolidation Solution Market Forecast (USD Billion), by Others, 2018-2029
Figure 44: Latin America Buyer's Consolidation Solution Market Forecast (USD Billion), by Brazil, 2018-2029
Figure 45: Latin America Buyer's Consolidation Solution Market Forecast (USD Billion), by Mexico, 2018-2029
Figure 46: Latin America Buyer's Consolidation Solution Market Forecast (USD Billion), by Rest of Latin America, 2018-2029
Figure 47: Europe Buyer's Consolidation Solution Market Value Share (%), By Segment 1, 2022 & 2029
Figure 48: Europe Buyer's Consolidation Solution Market Forecast (USD Billion), by Sub-Segment 1, 2018-2029
Figure 49: Europe Buyer's Consolidation Solution Market Forecast (USD Billion), by Sub-Segment 2, 2018-2029
Figure 50: Europe Buyer's Consolidation Solution Market Value Share (%), By Segment 2, 2022 & 2029
Figure 51: Europe Buyer's Consolidation Solution Market Forecast (USD Billion), by Sub-Segment 1, 2018-2029
Figure 52: Europe Buyer's Consolidation Solution Market Forecast (USD Billion), by Sub-Segment 2, 2018-2029
Figure 53: Europe Buyer's Consolidation Solution Market Forecast (USD Billion), by Sub-Segment 3, 2018-2029
Figure 54: Europe Buyer's Consolidation Solution Market Forecast (USD Billion), by Others, 2018-2029
Figure 55: Europe Buyer's Consolidation Solution Market Value Share (%), By Segment 3, 2022 & 2029
Figure 56: Europe Buyer's Consolidation Solution Market Forecast (USD Billion), by Sub-Segment 1, 2018-2029
Figure 57: Europe Buyer's Consolidation Solution Market Forecast (USD Billion), by Sub-Segment 2, 2018-2029
Figure 58: Europe Buyer's Consolidation Solution Market Forecast (USD Billion), by Sub-Segment 3, 2018-2029
Figure 59: Europe Buyer's Consolidation Solution Market Forecast (USD Billion), by Others, 2018-2029
Figure 60: Europe Buyer's Consolidation Solution Market Forecast (USD Billion), by U.K., 2018-2029
Figure 61: Europe Buyer's Consolidation Solution Market Forecast (USD Billion), by Germany, 2018-2029
Figure 62: Europe Buyer's Consolidation Solution Market Forecast (USD Billion), by France, 2018-2029
Figure 63: Europe Buyer's Consolidation Solution Market Forecast (USD Billion), by Italy, 2018-2029
Figure 64: Europe Buyer's Consolidation Solution Market Forecast (USD Billion), by Spain, 2018-2029
Figure 65: Europe Buyer's Consolidation Solution Market Forecast (USD Billion), by Russia, 2018-2029
Figure 66: Europe Buyer's Consolidation Solution Market Forecast (USD Billion), by Rest of Europe, 2018-2029
Figure 67: Asia Pacific Buyer's Consolidation Solution Market Value Share (%), By Segment 1, 2022 & 2029
Figure 68: Asia Pacific Buyer's Consolidation Solution Market Forecast (USD Billion), by Sub-Segment 1, 2018-2029
Figure 69: Asia Pacific Buyer's Consolidation Solution Market Forecast (USD Billion), by Sub-Segment 2, 2018-2029
Figure 70: Asia Pacific Buyer's Consolidation Solution Market Value Share (%), By Segment 2, 2022 & 2029
Figure 71: Asia Pacific Buyer's Consolidation Solution Market Forecast (USD Billion), by Sub-Segment 1, 2018-2029
Figure 72: Asia Pacific Buyer's Consolidation Solution Market Forecast (USD Billion), by Sub-Segment 2, 2018-2029
Figure 73: Asia Pacific Buyer's Consolidation Solution Market Forecast (USD Billion), by Sub-Segment 3, 2018-2029
Figure 74: Asia Pacific Buyer's Consolidation Solution Market Forecast (USD Billion), by Others, 2018-2029
Figure 75: Asia Pacific Buyer's Consolidation Solution Market Value Share (%), By Segment 3, 2022 & 2029
Figure 76: Asia Pacific Buyer's Consolidation Solution Market Forecast (USD Billion), by Sub-Segment 1, 2018-2029
Figure 77: Asia Pacific Buyer's Consolidation Solution Market Forecast (USD Billion), by Sub-Segment 2, 2018-2029
Figure 78: Asia Pacific Buyer's Consolidation Solution Market Forecast (USD Billion), by Sub-Segment 3, 2018-2029
Figure 79: Asia Pacific Buyer's Consolidation Solution Market Forecast (USD Billion), by Others, 2018-2029
Figure 80: Asia Pacific Buyer's Consolidation Solution Market Forecast (USD Billion), by China, 2018-2029
Figure 81: Asia Pacific Buyer's Consolidation Solution Market Forecast (USD Billion), by India, 2018-2029
Figure 82: Asia Pacific Buyer's Consolidation Solution Market Forecast (USD Billion), by Japan, 2018-2029
Figure 83: Asia Pacific Buyer's Consolidation Solution Market Forecast (USD Billion), by Australia, 2018-2029
Figure 84: Asia Pacific Buyer's Consolidation Solution Market Forecast (USD Billion), by Southeast Asia, 2018-2029
Figure 85: Asia Pacific Buyer's Consolidation Solution Market Forecast (USD Billion), by Rest of Asia Pacific, 2018-2029
Figure 86: Middle East & Africa Buyer's Consolidation Solution Market Value Share (%), By Segment 1, 2022 & 2029
Figure 87: Middle East & Africa Buyer's Consolidation Solution Market Forecast (USD Billion), by Sub-Segment 1, 2018-2029
Figure 88: Middle East & Africa Buyer's Consolidation Solution Market Forecast (USD Billion), by Sub-Segment 2, 2018-2029
Figure 89: Middle East & Africa Buyer's Consolidation Solution Market Value Share (%), By Segment 2, 2022 & 2029
Figure 90: Middle East & Africa Buyer's Consolidation Solution Market Forecast (USD Billion), by Sub-Segment 1, 2018-2029
Figure 91: Middle East & Africa Buyer's Consolidation Solution Market Forecast (USD Billion), by Sub-Segment 2, 2018-2029
Figure 92: Middle East & Africa Buyer's Consolidation Solution Market Forecast (USD Billion), by Sub-Segment 3, 2018-2029
Figure 93: Middle East & Africa Buyer's Consolidation Solution Market Forecast (USD Billion), by Others, 2018-2029
Figure 94: Middle East & Africa Buyer's Consolidation Solution Market Value Share (%), By Segment 3, 2022 & 2029
Figure 95: Middle East & Africa Buyer's Consolidation Solution Market Forecast (USD Billion), by Sub-Segment 1, 2018-2029
Figure 96: Middle East & Africa Buyer's Consolidation Solution Market Forecast (USD Billion), by Sub-Segment 2, 2018-2029
Figure 97: Middle East & Africa Buyer's Consolidation Solution Market Forecast (USD Billion), by Sub-Segment 3, 2018-2029
Figure 98: Middle East & Africa Buyer's Consolidation Solution Market Forecast (USD Billion), by Others, 2018-2029
Figure 99: Middle East & Africa Buyer's Consolidation Solution Market Forecast (USD Billion), by GCC, 2018-2029
Figure 100: Middle East & Africa Buyer's Consolidation Solution Market Forecast (USD Billion), by South Africa, 2018-2029
Figure 101: Middle East & Africa Buyer's Consolidation Solution Market Forecast (USD Billion), by Rest of Middle East & Africa, 2018-2029
List of Tables
Table 1: Global Buyer's Consolidation Solution Market Revenue (USD Billion) Forecast, by Segment 1, 2018-2029
Table 2: Global Buyer's Consolidation Solution Market Revenue (USD Billion) Forecast, by Segment 2, 2018-2029
Table 3: Global Buyer's Consolidation Solution Market Revenue (USD Billion) Forecast, by Segment 3, 2018-2029
Table 4: Global Buyer's Consolidation Solution Market Revenue (USD Billion) Forecast, by Region, 2018-2029
Table 5: North America Buyer's Consolidation Solution Market Revenue (USD Billion) Forecast, by Segment 1, 2018-2029
Table 6: North America Buyer's Consolidation Solution Market Revenue (USD Billion) Forecast, by Segment 2, 2018-2029
Table 7: North America Buyer's Consolidation Solution Market Revenue (USD Billion) Forecast, by Segment 3, 2018-2029
Table 8: North America Buyer's Consolidation Solution Market Revenue (USD Billion) Forecast, by Country, 2018-2029
Table 9: Europe Buyer's Consolidation Solution Market Revenue (USD Billion) Forecast, by Segment 1, 2018-2029
Table 10: Europe Buyer's Consolidation Solution Market Revenue (USD Billion) Forecast, by Segment 2, 2018-2029
Table 11: Europe Buyer's Consolidation Solution Market Revenue (USD Billion) Forecast, by Segment 3, 2018-2029
Table 12: Europe Buyer's Consolidation Solution Market Revenue (USD Billion) Forecast, by Country, 2018-2029
Table 13: Latin America Buyer's Consolidation Solution Market Revenue (USD Billion) Forecast, by Segment 1, 2018-2029
Table 14: Latin America Buyer's Consolidation Solution Market Revenue (USD Billion) Forecast, by Segment 2, 2018-2029
Table 15: Latin America Buyer's Consolidation Solution Market Revenue (USD Billion) Forecast, by Segment 3, 2018-2029
Table 16: Latin America Buyer's Consolidation Solution Market Revenue (USD Billion) Forecast, by Country, 2018-2029
Table 17: Asia Pacific Buyer's Consolidation Solution Market Revenue (USD Billion) Forecast, by Segment 1, 2018-2029
Table 18: Asia Pacific Buyer's Consolidation Solution Market Revenue (USD Billion) Forecast, by Segment 2, 2018-2029
Table 19: Asia Pacific Buyer's Consolidation Solution Market Revenue (USD Billion) Forecast, by Segment 3, 2018-2029
Table 20: Asia Pacific Buyer's Consolidation Solution Market Revenue (USD Billion) Forecast, by Country, 2018-2029
Table 21: Middle East & Africa Buyer's Consolidation Solution Market Revenue (USD Billion) Forecast, by Segment 1, 2018-2029
Table 22: Middle East & Africa Buyer's Consolidation Solution Market Revenue (USD Billion) Forecast, by Segment 2, 2018-2029
Table 23: Middle East & Africa Buyer's Consolidation Solution Market Revenue (USD Billion) Forecast, by Segment 3, 2018-2029
Table 24: Middle East & Africa Buyer's Consolidation Solution Market Revenue (USD Billion) Forecast, by Country, 2018-2029
Research Process
Data Library Research are conducted by industry experts who offer insight on
industry structure, market segmentations technology assessment and competitive landscape (CL), and penetration, as well as on emerging trends. Their analysis is based on primary interviews (~ 80%) and secondary research (~ 20%) as well as years of professional expertise in their respective industries. Adding to this, by analysing historical trends and current market positions, our analysts predict where the market will be headed for the next five years. Furthermore, the varying trends of segment & categories geographically presented are also studied and the estimated based on the primary & secondary research.
In this particular report from the supply side Data Library Research has conducted primary surveys (interviews) with the key level executives (VP, CEO’s, Marketing Director, Business Development Manager
and SOFT) of the companies that active & prominent as well as the midsized organization
FIGURE 1: DLR RESEARH PROCESS
![research-methodology1]()
Primary Research
Extensive primary research was conducted to gain a deeper insight of the market and industry performance. The analysis is based on both primary and secondary research as well as years of professional expertise in the respective industries.
In addition to analysing current and historical trends, our analysts predict where the market is headed over the next five years.
It varies by segment for these categories geographically presented in the list of market tables. Speaking about this particular report we have conducted primary surveys (interviews) with the key level executives (VP, CEO’s, Marketing Director, Business Development Manager and many more) of the major players active in the market.
Secondary Research
Secondary research was mainly used to collect and identify information useful for the extensive, technical, market-oriented, and Friend’s study of the Global Extra Neutral Alcohol. It was also used to obtain key information about major players, market classification and segmentation according to the industry trends, geographical markets, and developments related to the market and technology perspectives. For this study, analysts have gathered information from various credible sources, such as annual reports, sec filings, journals, white papers, SOFT presentations, and company web sites.
Market Size Estimation
Both, top-down and bottom-up approaches were used to estimate and validate the size of the Global market and to estimate the size of various other dependent submarkets in the overall Extra Neutral Alcohol. The key players in the market were identified through secondary research and their market contributions in the respective geographies were determined through primary and secondary research.
Forecast Model
![research-methodology2]()