Smart Civil Aviation Solution Market Overview and Analysis
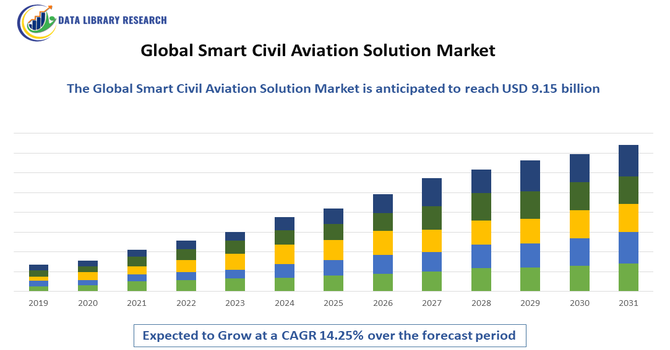
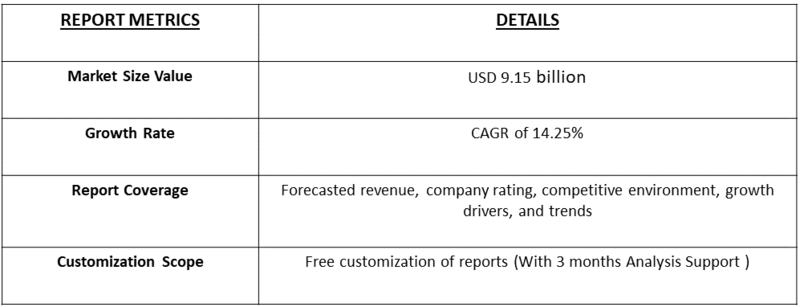
- The Global Smart Civil Aviation Solution Market size is currently USD 3.7 Billion in 2025 and is forecasted to grow at a CAGR of 14.25% from 2025 to 2032, reaching USD 9.15 Billion by 2032.
Get Complete Analysis Of The Report - Download Updated Free Sample PDF
The Global Smart Civil Aviation Solution Market refers to the expanding sector focused on integrating advanced digital technologies—such as IoT, AI, big data analytics, and automation—into civil aviation systems to enhance operational efficiency, safety, passenger experience, and environmental sustainability. This market encompasses solutions for air traffic management, aircraft maintenance, passenger processing, and airport operations, driven by the growing demand for smarter, more connected, and efficient aviation infrastructure worldwide. Increasing air travel, regulatory pressures for greener operations, and technological advancements are key factors propelling its growth.
Smart Civil Aviation Solution Market Latest Trends
The key market trends in the Global Smart Civil Aviation Solution Market include the rapid adoption of AI and machine learning for predictive maintenance and optimized flight operations, increased implementation of Internet of Things (IoT) devices for real-time monitoring and data sharing, and the growing use of big data analytics to enhance decision-making and passenger experience. Additionally, there is a strong focus on integrating sustainable and eco-friendly technologies to reduce carbon emissions, alongside expanding investments in smart airport infrastructure and autonomous systems. The push for digital transformation across airlines and airports, driven by demand for improved safety, efficiency, and passenger convenience, is accelerating innovation and collaboration among industry stakeholders.
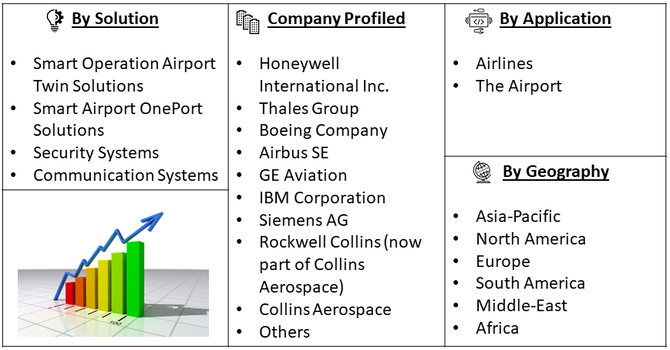
Segmentation: The Global Smart Civil Aviation Solution Market is segmented by Solution (Smart Operation Airport Twin Solutions, Smart Airport OnePort Solutions, Security Systems, and Communication Systems) Application (Airlines and the Airport), and Geography (North America, Europe, Asia-Pacific, Latin America, Middle East & Africa). The report provides the value (in USD million) for the above segments.
For Detailed Market Segmentation - Get a Free Sample PDF
Market Drivers:
- Increasing Demand for Enhanced Operational Efficiency
The growing demand for operational efficiency in civil aviation is a primary driver of the Global Smart Civil Aviation Solution Market. Airlines and airports face pressure to optimize flight schedules, reduce delays, and manage increasing passenger volumes without compromising safety or service quality. Smart solutions incorporating AI, IoT, and big data analytics enable real-time monitoring and predictive maintenance, minimizing downtime and improving turnaround times. These technologies help streamline air traffic management and ground operations, resulting in cost savings and enhanced resource utilization. As global air travel continues to rise, the need for smarter, more efficient aviation infrastructure becomes critical, encouraging stakeholders to invest heavily in digital solutions that improve operational workflows and elevate overall performance.
- Growing Emphasis on Sustainability and Environmental Regulations
The environmental concerns and stringent regulatory mandates are accelerating the adoption of smart civil aviation solutions. Governments and international bodies are enforcing stricter emissions standards and encouraging the aviation industry to reduce its carbon footprint. Smart technologies facilitate eco-friendly operations through better fuel management, optimized flight routes, and efficient ground handling practices. Additionally, innovations like electric ground vehicles and energy-efficient airport systems contribute to sustainability goals. Airlines and airports adopting these solutions not only comply with regulations but also enhance their corporate social responsibility profiles, attracting environmentally conscious travelers and investors. This focus on sustainability drives the market as stakeholders seek to balance growth with environmental stewardship.
Market Restraints:
- High Implementation Costs and Integration Challenges
The high cost of implementing smart civil aviation solutions poses a significant restraint to market growth. Developing and deploying advanced technologies such as AI systems, IoT infrastructure, and data analytics platforms require substantial capital investment and technical expertise. Additionally, integrating these new technologies with existing legacy systems in airports and airlines can be complex and time-consuming, often leading to operational disruptions during transition phases. Smaller and mid-sized operators may find these costs prohibitive, limiting widespread adoption. Furthermore, concerns over cybersecurity and data privacy add another layer of complexity and expense, making stakeholders cautious about fully embracing smart aviation solutions despite their long-term advantages.
Social Economic Impact on Smart Civil Aviation Solution Market
The Global Smart Civil Aviation Solution Market significantly influences socioeconomic development by enhancing connectivity, creating high-tech jobs, and boosting economic growth through more efficient and sustainable air travel. Improved aviation infrastructure facilitates global trade, tourism, and business, contributing to regional development and increased access to remote areas. The adoption of smart technologies drives innovation and skill development, fostering a skilled workforce and new business opportunities in technology and aviation sectors. Moreover, advancements in safety and efficiency reduce operational costs and travel disruptions, benefiting consumers and industries alike. However, the market’s growth also necessitates addressing digital divide challenges to ensure inclusive access and equitable benefits across different regions and socioeconomic groups.
Segmental Analysis:
- Smart Operation Airport Twin Solutions Segment is Expected to Witness High Growth Over the Forecasted Period
The Smart Operation Airport Twin Solutions segment is poised for rapid growth due to its ability to create a comprehensive digital replica of airport operations, enabling real-time monitoring, predictive maintenance, and optimized resource allocation. These solutions leverage IoT, AI, and big data analytics to simulate and analyze various scenarios, enhancing operational efficiency and reducing downtime. As airports strive to handle increasing passenger volumes while improving safety and sustainability, digital twin technology offers valuable insights for proactive decision-making. Additionally, the push for automation and smart infrastructure investments further propels demand for airport twin solutions, making this segment one of the fastest-growing within the smart civil aviation solutions market during the forecast period.
- Airport Segment is Expected to Witness High Growth Over the Forecasted Period
The airport segment is expected to experience significant growth as airports worldwide increasingly adopt smart technologies to improve passenger experience, safety, and operational efficiency. With rising air travel demand, airports face pressure to streamline passenger processing, baggage handling, and security screening. Smart solutions like biometric systems, automated check-ins, and integrated air traffic management help reduce congestion and enhance service quality. Moreover, airports are investing in eco-friendly infrastructure and energy management systems to meet sustainability goals. Government initiatives and funding for airport modernization, coupled with growing partnerships between technology providers and airport authorities, are driving the expansion of smart solutions within the airport segment throughout the forecast period.
- North America Region is Expected to Witness High Growth Over the Forecasted Period
North America is expected to witness robust growth in the smart civil aviation solution market due to its well-established aviation infrastructure and strong focus on technological innovation. The region benefits from significant investments by government agencies and private players in modernizing airports and enhancing air traffic management systems.
High adoption rates of AI, IoT, and data analytics technologies among airlines and airport operators further boost market growth. For instance, in May 2025, the introduction of the Supersonic Aviation Modernization (SAM) Act significantly impacted the Global Smart Civil Aviation Solution Market by paving the way for the legalization and integration of civil supersonic flights in the United States. This legislative move is expected to drive innovation in high-speed aviation technologies, prompting airlines and manufacturers to invest in next-generation supersonic aircraft equipped with advanced smart systems for navigation, safety, and efficiency. Thus, the SAM Act is poised to accelerate the evolution of the civil aviation market by introducing new opportunities for advanced, efficient, and sustainable supersonic air transportation solutions.
Additionally, stringent regulatory requirements for safety, security, and environmental sustainability encourage the deployment of smart aviation solutions. The presence of major technology providers and continuous R&D activities in North America also contribute to the region’s leadership in adopting and advancing smart civil aviation solutions over the forecasted period.
To Learn More About This Report - Request a Free Sample Copy
Smart Civil Aviation Solution Market Competitive Landscape
The competitive landscape of the Global Smart Civil Aviation Solution Market is characterized by the presence of several key technology providers, aviation equipment manufacturers, and specialized solution developers competing to deliver innovative, integrated, and scalable smart aviation technologies. Major players focus on strategic partnerships, mergers and acquisitions, and continuous R&D to enhance their product portfolios and expand global reach. The market sees intense competition around developing AI-driven analytics, IoT-enabled systems, and digital twin solutions to meet rising demands for operational efficiency, safety, and sustainability. Companies also differentiate themselves through customized offerings tailored to airlines, airports, and air traffic management authorities. With rapid technological advancements and evolving regulatory requirements, the competitive environment remains dynamic, driving continuous innovation and collaboration across the industry.
The major players for above market are:
- Honeywell International Inc.
- Thales Group
- Boeing Company
- Airbus SE
- GE Aviation
- IBM Corporation
- Siemens AG
- Rockwell Collins (now part of Collins Aerospace)
- Collins Aerospace
- Indra Sistemas, S.A.
- NEC Corporation
- Lufthansa Systems GmbH & Co. KG
- SITA
- Amadeus IT Group
- CAE Inc.
- CGI Inc.
- Leidos Holdings, Inc.
- Alstom SA
- Raytheon Technologies Corporation
- Honeywell Aerospace
Recent Developments:
- In April 2025, Huawei launched five aviation solutions, including the Smart Airport Intelligent Operation Center (IOC), aimed at advancing intelligent industry upgrades. Huawei’s launch of five aviation solutions, particularly the Smart Airport Intelligent Operation Center (IOC), has significantly impacted the Global Smart Civil Aviation Solution Market by accelerating the adoption of advanced digital technologies in airport operations. This move has introduced more integrated, AI-driven, and data-centric solutions that enhance operational efficiency, real-time decision-making, and predictive maintenance in airports.
- In July 2025, Ajman Transport Authority signed a memorandum of understanding (MoU) with Skyports Infrastructure to explore opportunities for cooperation in the field of smart aerial transport, including air taxi services. This collaboration highlights the growing interest and investment in urban air mobility solutions, which are set to transform traditional transportation networks by offering faster, more flexible, and sustainable travel options. Such partnerships stimulate innovation, create new market opportunities, and accelerate the adoption of next-generation aviation solutions, thereby contributing to the overall expansion and evolution of the smart civil aviation market worldwide.
Frequently Asked Questions (FAQ) :
Q1. What are the main growth driving factors for this market?
The market is primarily driven by the surging global demand for air travel and freight, necessitating massive airport modernization and expansion. The integration of smart technologies, such as AI, IoT, and Big Data, is crucial for enhancing operational efficiency, improving safety/security (like biometrics), and providing a seamless, real-time passenger experience, which collectively fuels market growth.
Q2. What are the main restraining factors for this market?
The market is constrained by significant challenges, notably the very high initial capital expenditure for implementing complex smart solutions and integrating them with legacy infrastructure. Critical concerns include the persistent and increasing threat of sophisticated cybersecurity attacks on essential aviation systems and a growing shortage of skilled personnel needed to manage these advanced technologies.
Q3. Which segment is expected to witness high growth?
The "Smart Operation/Digital Twin" solutions segment is expected to witness high growth, as it uses AI and ML to create virtual models of airports and operations for simulation and real-time optimization. Furthermore, the Security Systems technology segment, including advanced biometric and surveillance solutions, is projected for rapid expansion due to the increasing focus on ensuring a safe travel environment.
Q4. Who are the top major players for this market?
The top major players are a mix of aerospace manufacturers, defense companies, and IT solution providers. Key names include SITA, Thales Group, Honeywell International Inc., IBM, Siemens AG, and Amadeus IT Group. These companies offer comprehensive solutions spanning from Air Traffic Management and digital security to passenger processing and smart maintenance.
Q5. Which country is the largest player?
North America historically holds a major revenue share, led by the US, due to its well-established aviation ecosystem, rapid adoption of advanced technologies, and a strong focus on fleet modernization. However, the Asia-Pacific region, particularly China and India, is projected to be the fastest-growing market, driven by massive investments in new airport infrastructure and digitalization.
List of Figures
Figure 1: Global Smart Civil Aviation Solution Market Revenue Breakdown (USD Billion, %) by Region, 2023 & 2029
Figure 2: Global Smart Civil Aviation Solution Market Value Share (%), By Segment 1, 2023 & 2029
Figure 3: Global Smart Civil Aviation Solution Market Forecast (USD Billion), by Sub-Segment 1, 2018-2029
Figure 4: Global Smart Civil Aviation Solution Market Forecast (USD Billion), by Sub-Segment 2, 2018-2029
Figure 5: Global Smart Civil Aviation Solution Market Value Share (%), By Segment 2, 2023 & 2029
Figure 6: Global Smart Civil Aviation Solution Market Forecast (USD Billion), by Sub-Segment 1, 2018-2029
Figure 7: Global Smart Civil Aviation Solution Market Forecast (USD Billion), by Sub-Segment 2, 2018-2029
Figure 8: Global Smart Civil Aviation Solution Market Forecast (USD Billion), by Sub-Segment 3, 2018-2029
Figure 9: Global Smart Civil Aviation Solution Market Forecast (USD Billion), by Others, 2018-2029
Figure 10: Global Smart Civil Aviation Solution Market Value Share (%), By Segment 3, 2023 & 2029
Figure 11: Global Smart Civil Aviation Solution Market Forecast (USD Billion), by Sub-Segment 1, 2018-2029
Figure 12: Global Smart Civil Aviation Solution Market Forecast (USD Billion), by Sub-Segment 2, 2018-2029
Figure 13: Global Smart Civil Aviation Solution Market Forecast (USD Billion), by Sub-Segment 3, 2018-2029
Figure 14: Global Smart Civil Aviation Solution Market Forecast (USD Billion), by Others, 2018-2029
Figure 15: Global Smart Civil Aviation Solution Market Value (USD Billion), by Region, 2023 & 2029
Figure 16: North America Smart Civil Aviation Solution Market Value Share (%), By Segment 1, 2023 & 2029
Figure 17: North America Smart Civil Aviation Solution Market Forecast (USD Billion), by Sub-Segment 1, 2018-2029
Figure 18: North America Smart Civil Aviation Solution Market Forecast (USD Billion), by Sub-Segment 2, 2018-2029
Figure 19: North America Smart Civil Aviation Solution Market Value Share (%), By Segment 2, 2023 & 2029
Figure 20: North America Smart Civil Aviation Solution Market Forecast (USD Billion), by Sub-Segment 1, 2018-2029
Figure 21: North America Smart Civil Aviation Solution Market Forecast (USD Billion), by Sub-Segment 2, 2018-2029
Figure 22: North America Smart Civil Aviation Solution Market Forecast (USD Billion), by Sub-Segment 3, 2018-2029
Figure 23: North America Smart Civil Aviation Solution Market Forecast (USD Billion), by Others, 2018-2029
Figure 24: North America Smart Civil Aviation Solution Market Value Share (%), By Segment 3, 2023 & 2029
Figure 25: North America Smart Civil Aviation Solution Market Forecast (USD Billion), by Sub-Segment 1, 2018-2029
Figure 26: North America Smart Civil Aviation Solution Market Forecast (USD Billion), by Sub-Segment 2, 2018-2029
Figure 27: North America Smart Civil Aviation Solution Market Forecast (USD Billion), by Sub-Segment 3, 2018-2029
Figure 28: North America Smart Civil Aviation Solution Market Forecast (USD Billion), by Others, 2018-2029
Figure 29: North America Smart Civil Aviation Solution Market Forecast (USD Billion), by U.S., 2018-2029
Figure 30: North America Smart Civil Aviation Solution Market Forecast (USD Billion), by Canada, 2018-2029
Figure 31: Latin America Smart Civil Aviation Solution Market Value Share (%), By Segment 1, 2023 & 2029
Figure 32: Latin America Smart Civil Aviation Solution Market Forecast (USD Billion), by Sub-Segment 1, 2018-2029
Figure 33: Latin America Smart Civil Aviation Solution Market Forecast (USD Billion), by Sub-Segment 2, 2018-2029
Figure 34: Latin America Smart Civil Aviation Solution Market Value Share (%), By Segment 2, 2023 & 2029
Figure 35: Latin America Smart Civil Aviation Solution Market Forecast (USD Billion), by Sub-Segment 1, 2018-2029
Figure 36: Latin America Smart Civil Aviation Solution Market Forecast (USD Billion), by Sub-Segment 2, 2018-2029
Figure 37: Latin America Smart Civil Aviation Solution Market Forecast (USD Billion), by Sub-Segment 3, 2018-2029
Figure 38: Latin America Smart Civil Aviation Solution Market Forecast (USD Billion), by Others, 2018-2029
Figure 39: Latin America Smart Civil Aviation Solution Market Value Share (%), By Segment 3, 2023 & 2029
Figure 40: Latin America Smart Civil Aviation Solution Market Forecast (USD Billion), by Sub-Segment 1, 2018-2029
Figure 41: Latin America Smart Civil Aviation Solution Market Forecast (USD Billion), by Sub-Segment 2, 2018-2029
Figure 42: Latin America Smart Civil Aviation Solution Market Forecast (USD Billion), by Sub-Segment 3, 2018-2029
Figure 43: Latin America Smart Civil Aviation Solution Market Forecast (USD Billion), by Others, 2018-2029
Figure 44: Latin America Smart Civil Aviation Solution Market Forecast (USD Billion), by Brazil, 2018-2029
Figure 45: Latin America Smart Civil Aviation Solution Market Forecast (USD Billion), by Mexico, 2018-2029
Figure 46: Latin America Smart Civil Aviation Solution Market Forecast (USD Billion), by Rest of Latin America, 2018-2029
Figure 47: Europe Smart Civil Aviation Solution Market Value Share (%), By Segment 1, 2023 & 2029
Figure 48: Europe Smart Civil Aviation Solution Market Forecast (USD Billion), by Sub-Segment 1, 2018-2029
Figure 49: Europe Smart Civil Aviation Solution Market Forecast (USD Billion), by Sub-Segment 2, 2018-2029
Figure 50: Europe Smart Civil Aviation Solution Market Value Share (%), By Segment 2, 2023 & 2029
Figure 51: Europe Smart Civil Aviation Solution Market Forecast (USD Billion), by Sub-Segment 1, 2018-2029
Figure 52: Europe Smart Civil Aviation Solution Market Forecast (USD Billion), by Sub-Segment 2, 2018-2029
Figure 53: Europe Smart Civil Aviation Solution Market Forecast (USD Billion), by Sub-Segment 3, 2018-2029
Figure 54: Europe Smart Civil Aviation Solution Market Forecast (USD Billion), by Others, 2018-2029
Figure 55: Europe Smart Civil Aviation Solution Market Value Share (%), By Segment 3, 2023 & 2029
Figure 56: Europe Smart Civil Aviation Solution Market Forecast (USD Billion), by Sub-Segment 1, 2018-2029
Figure 57: Europe Smart Civil Aviation Solution Market Forecast (USD Billion), by Sub-Segment 2, 2018-2029
Figure 58: Europe Smart Civil Aviation Solution Market Forecast (USD Billion), by Sub-Segment 3, 2018-2029
Figure 59: Europe Smart Civil Aviation Solution Market Forecast (USD Billion), by Others, 2018-2029
Figure 60: Europe Smart Civil Aviation Solution Market Forecast (USD Billion), by U.K., 2018-2029
Figure 61: Europe Smart Civil Aviation Solution Market Forecast (USD Billion), by Germany, 2018-2029
Figure 62: Europe Smart Civil Aviation Solution Market Forecast (USD Billion), by France, 2018-2029
Figure 63: Europe Smart Civil Aviation Solution Market Forecast (USD Billion), by Italy, 2018-2029
Figure 64: Europe Smart Civil Aviation Solution Market Forecast (USD Billion), by Spain, 2018-2029
Figure 65: Europe Smart Civil Aviation Solution Market Forecast (USD Billion), by Russia, 2018-2029
Figure 66: Europe Smart Civil Aviation Solution Market Forecast (USD Billion), by Rest of Europe, 2018-2029
Figure 67: Asia Pacific Smart Civil Aviation Solution Market Value Share (%), By Segment 1, 2023 & 2029
Figure 68: Asia Pacific Smart Civil Aviation Solution Market Forecast (USD Billion), by Sub-Segment 1, 2018-2029
Figure 69: Asia Pacific Smart Civil Aviation Solution Market Forecast (USD Billion), by Sub-Segment 2, 2018-2029
Figure 70: Asia Pacific Smart Civil Aviation Solution Market Value Share (%), By Segment 2, 2023 & 2029
Figure 71: Asia Pacific Smart Civil Aviation Solution Market Forecast (USD Billion), by Sub-Segment 1, 2018-2029
Figure 72: Asia Pacific Smart Civil Aviation Solution Market Forecast (USD Billion), by Sub-Segment 2, 2018-2029
Figure 73: Asia Pacific Smart Civil Aviation Solution Market Forecast (USD Billion), by Sub-Segment 3, 2018-2029
Figure 74: Asia Pacific Smart Civil Aviation Solution Market Forecast (USD Billion), by Others, 2018-2029
Figure 75: Asia Pacific Smart Civil Aviation Solution Market Value Share (%), By Segment 3, 2023 & 2029
Figure 76: Asia Pacific Smart Civil Aviation Solution Market Forecast (USD Billion), by Sub-Segment 1, 2018-2029
Figure 77: Asia Pacific Smart Civil Aviation Solution Market Forecast (USD Billion), by Sub-Segment 2, 2018-2029
Figure 78: Asia Pacific Smart Civil Aviation Solution Market Forecast (USD Billion), by Sub-Segment 3, 2018-2029
Figure 79: Asia Pacific Smart Civil Aviation Solution Market Forecast (USD Billion), by Others, 2018-2029
Figure 80: Asia Pacific Smart Civil Aviation Solution Market Forecast (USD Billion), by China, 2018-2029
Figure 81: Asia Pacific Smart Civil Aviation Solution Market Forecast (USD Billion), by India, 2018-2029
Figure 82: Asia Pacific Smart Civil Aviation Solution Market Forecast (USD Billion), by Japan, 2018-2029
Figure 83: Asia Pacific Smart Civil Aviation Solution Market Forecast (USD Billion), by Australia, 2018-2029
Figure 84: Asia Pacific Smart Civil Aviation Solution Market Forecast (USD Billion), by Southeast Asia, 2018-2029
Figure 85: Asia Pacific Smart Civil Aviation Solution Market Forecast (USD Billion), by Rest of Asia Pacific, 2018-2029
Figure 86: Middle East & Africa Smart Civil Aviation Solution Market Value Share (%), By Segment 1, 2023 & 2029
Figure 87: Middle East & Africa Smart Civil Aviation Solution Market Forecast (USD Billion), by Sub-Segment 1, 2018-2029
Figure 88: Middle East & Africa Smart Civil Aviation Solution Market Forecast (USD Billion), by Sub-Segment 2, 2018-2029
Figure 89: Middle East & Africa Smart Civil Aviation Solution Market Value Share (%), By Segment 2, 2023 & 2029
Figure 90: Middle East & Africa Smart Civil Aviation Solution Market Forecast (USD Billion), by Sub-Segment 1, 2018-2029
Figure 91: Middle East & Africa Smart Civil Aviation Solution Market Forecast (USD Billion), by Sub-Segment 2, 2018-2029
Figure 92: Middle East & Africa Smart Civil Aviation Solution Market Forecast (USD Billion), by Sub-Segment 3, 2018-2029
Figure 93: Middle East & Africa Smart Civil Aviation Solution Market Forecast (USD Billion), by Others, 2018-2029
Figure 94: Middle East & Africa Smart Civil Aviation Solution Market Value Share (%), By Segment 3, 2023 & 2029
Figure 95: Middle East & Africa Smart Civil Aviation Solution Market Forecast (USD Billion), by Sub-Segment 1, 2018-2029
Figure 96: Middle East & Africa Smart Civil Aviation Solution Market Forecast (USD Billion), by Sub-Segment 2, 2018-2029
Figure 97: Middle East & Africa Smart Civil Aviation Solution Market Forecast (USD Billion), by Sub-Segment 3, 2018-2029
Figure 98: Middle East & Africa Smart Civil Aviation Solution Market Forecast (USD Billion), by Others, 2018-2029
Figure 99: Middle East & Africa Smart Civil Aviation Solution Market Forecast (USD Billion), by GCC, 2018-2029
Figure 100: Middle East & Africa Smart Civil Aviation Solution Market Forecast (USD Billion), by South Africa, 2018-2029
Figure 101: Middle East & Africa Smart Civil Aviation Solution Market Forecast (USD Billion), by Rest of Middle East & Africa, 2018-2029
List of Tables
Table 1: Global Smart Civil Aviation Solution Market Revenue (USD Billion) Forecast, by Segment 1, 2018-2029
Table 2: Global Smart Civil Aviation Solution Market Revenue (USD Billion) Forecast, by Segment 2, 2018-2029
Table 3: Global Smart Civil Aviation Solution Market Revenue (USD Billion) Forecast, by Segment 3, 2018-2029
Table 4: Global Smart Civil Aviation Solution Market Revenue (USD Billion) Forecast, by Region, 2018-2029
Table 5: North America Smart Civil Aviation Solution Market Revenue (USD Billion) Forecast, by Segment 1, 2018-2029
Table 6: North America Smart Civil Aviation Solution Market Revenue (USD Billion) Forecast, by Segment 2, 2018-2029
Table 7: North America Smart Civil Aviation Solution Market Revenue (USD Billion) Forecast, by Segment 3, 2018-2029
Table 8: North America Smart Civil Aviation Solution Market Revenue (USD Billion) Forecast, by Country, 2018-2029
Table 9: Europe Smart Civil Aviation Solution Market Revenue (USD Billion) Forecast, by Segment 1, 2018-2029
Table 10: Europe Smart Civil Aviation Solution Market Revenue (USD Billion) Forecast, by Segment 2, 2018-2029
Table 11: Europe Smart Civil Aviation Solution Market Revenue (USD Billion) Forecast, by Segment 3, 2018-2029
Table 12: Europe Smart Civil Aviation Solution Market Revenue (USD Billion) Forecast, by Country, 2018-2029
Table 13: Latin America Smart Civil Aviation Solution Market Revenue (USD Billion) Forecast, by Segment 1, 2018-2029
Table 14: Latin America Smart Civil Aviation Solution Market Revenue (USD Billion) Forecast, by Segment 2, 2018-2029
Table 15: Latin America Smart Civil Aviation Solution Market Revenue (USD Billion) Forecast, by Segment 3, 2018-2029
Table 16: Latin America Smart Civil Aviation Solution Market Revenue (USD Billion) Forecast, by Country, 2018-2029
Table 17: Asia Pacific Smart Civil Aviation Solution Market Revenue (USD Billion) Forecast, by Segment 1, 2018-2029
Table 18: Asia Pacific Smart Civil Aviation Solution Market Revenue (USD Billion) Forecast, by Segment 2, 2018-2029
Table 19: Asia Pacific Smart Civil Aviation Solution Market Revenue (USD Billion) Forecast, by Segment 3, 2018-2029
Table 20: Asia Pacific Smart Civil Aviation Solution Market Revenue (USD Billion) Forecast, by Country, 2018-2029
Table 21: Middle East & Africa Smart Civil Aviation Solution Market Revenue (USD Billion) Forecast, by Segment 1, 2018-2029
Table 22: Middle East & Africa Smart Civil Aviation Solution Market Revenue (USD Billion) Forecast, by Segment 2, 2018-2029
Table 23: Middle East & Africa Smart Civil Aviation Solution Market Revenue (USD Billion) Forecast, by Segment 3, 2018-2029
Table 24: Middle East & Africa Smart Civil Aviation Solution Market Revenue (USD Billion) Forecast, by Country, 2018-2029
Research Process
Data Library Research are conducted by industry experts who offer insight on
industry structure, market segmentations technology assessment and competitive landscape (CL), and penetration, as well as on emerging trends. Their analysis is based on primary interviews (~ 80%) and secondary research (~ 20%) as well as years of professional expertise in their respective industries. Adding to this, by analysing historical trends and current market positions, our analysts predict where the market will be headed for the next five years. Furthermore, the varying trends of segment & categories geographically presented are also studied and the estimated based on the primary & secondary research.
In this particular report from the supply side Data Library Research has conducted primary surveys (interviews) with the key level executives (VP, CEO’s, Marketing Director, Business Development Manager
and SOFT) of the companies that active & prominent as well as the midsized organization
FIGURE 1: DLR RESEARH PROCESS
![research-methodology1]()
Primary Research
Extensive primary research was conducted to gain a deeper insight of the market and industry performance. The analysis is based on both primary and secondary research as well as years of professional expertise in the respective industries.
In addition to analysing current and historical trends, our analysts predict where the market is headed over the next five years.
It varies by segment for these categories geographically presented in the list of market tables. Speaking about this particular report we have conducted primary surveys (interviews) with the key level executives (VP, CEO’s, Marketing Director, Business Development Manager and many more) of the major players active in the market.
Secondary Research
Secondary research was mainly used to collect and identify information useful for the extensive, technical, market-oriented, and Friend’s study of the Global Extra Neutral Alcohol. It was also used to obtain key information about major players, market classification and segmentation according to the industry trends, geographical markets, and developments related to the market and technology perspectives. For this study, analysts have gathered information from various credible sources, such as annual reports, sec filings, journals, white papers, SOFT presentations, and company web sites.
Market Size Estimation
Both, top-down and bottom-up approaches were used to estimate and validate the size of the Global market and to estimate the size of various other dependent submarkets in the overall Extra Neutral Alcohol. The key players in the market were identified through secondary research and their market contributions in the respective geographies were determined through primary and secondary research.
Forecast Model
![research-methodology2]()