Smart Rail Transit Solution Market Overview and Analysis

The Global Smart Rail Transit Solution Market is estimated to be USD 37.32 billion in 2025 and is projected to reach USD 57.31 billion by 2032 at a CAGR of 9.12% from 2025 to 2032.

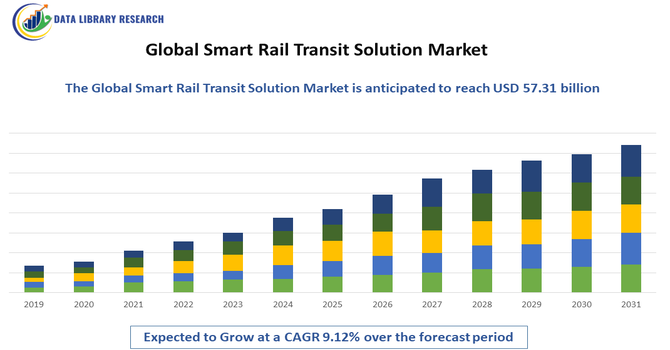
The Global Smart Rail Transit Solution Market is the industry that develops and provides advanced technologies to make rail transport faster, safer, more efficient, and eco-friendly. It includes systems like automated train control, real-time monitoring, smart ticketing, and predictive maintenance. As urban populations grow and cities aim for cleaner, smarter transportation, demand for these smart rail solutions is rising across both developed and developing countries.

Smart Rail Transit Solution Market Latest Trends

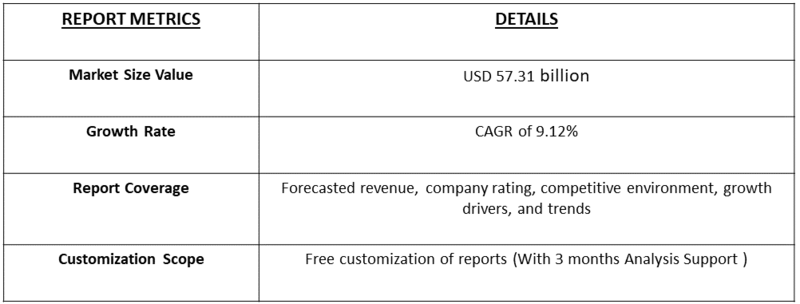
The Global Smart Rail Transit Solution Market is witnessing rapid growth, fuelled by increasing urban populations, congestion in cities, and the urgent need for cleaner, more efficient public transportation systems. Also, the governments and transit authorities are heavily investing in modern rail infrastructure as part of broader smart city initiatives. Key market trends include the integration of AI, IoT, and big data for real-time train tracking, predictive maintenance, and automated operations. Smart ticketing systems, digital passenger information displays, and mobile connectivity are enhancing the commuter experience. There's also a strong push toward energy-efficient solutions, electrification, and improved safety features. Additionally, as digital systems grow more complex, cybersecurity and data protection have become crucial focus areas in the development of smart rail technologies.

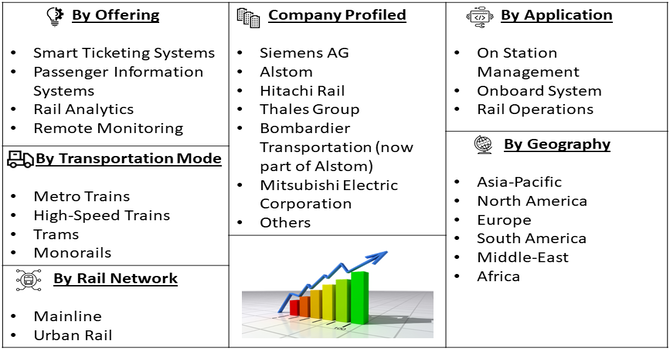
Segmentation: The Global Smart Rail Transit Solution Market is segmented by Offering (Smart Ticketing Systems, Passenger Information Systems, Rail Analytics, and Remote Monitoring), Transportation Mode (Metro Trains, High-Speed Trains, Trams, and Monorails), Rail Network (Mainline and Urban Rail), Application (On Station Management, Onboard Systems, and Rail Operations) and (North America, Europe, Asia-Pacific, Latin America, Middle East & Africa). The report provides the value (in USD million) for the above segments.

Market Drivers:

  • Growing Urbanization and Demand for Efficient Public Transport

As cities around the world grow rapidly, more people need reliable and efficient ways to travel. Traditional rail systems often struggle to keep up with this demand, leading to delays, overcrowding, and poor service. Smart rail transit solutions help solve these problems by improving train schedules, reducing downtime, and offering real-time updates to passengers. Features like smart ticketing, automated train control, and predictive maintenance make the entire system faster, safer, and more user-friendly. Governments are increasingly investing in smart rail as part of broader smart city projects. This rising need for modern, sustainable urban mobility is one of the strongest drivers pushing the growth of the smart rail market.

  • Government Investments and Supportive Policies

Many governments are actively investing in smart transportation infrastructure, including smart rail systems, to reduce traffic congestion, cut emissions, and support economic growth. These investments often come with policies and incentives that encourage the adoption of advanced technologies like AI, IoT, and automation in rail systems. Public-private partnerships and funding programs are helping transit authorities upgrade aging rail networks with smart solutions. In regions like Asia-Pacific and Europe, governments have made smart rail a key part of their long-term urban development plans. These supportive initiatives are helping to speed up implementation, lower the financial burden for operators, and increase confidence in smart transit technologies, driving steady market growth.

Market Restraints:

  • High Initial Costs and Complex Implementation

The major restraint for the Global Smart Rail Transit Solution Market is the high initial cost of deploying smart technologies. Upgrading existing rail systems with automation, sensors, real-time monitoring, and digital ticketing requires significant investment in infrastructure, software, and skilled labor. Smaller cities or countries with limited budgets may find it difficult to afford these upgrades. Additionally, implementing smart solutions in older rail networks can be technically challenging, often requiring major overhauls and extended downtime, which disrupts operations. Integration with legacy systems, cybersecurity concerns, and the need for staff training also add to the complexity. These factors can slow down decision-making and discourage some transit authorities from adopting smart rail technologies, especially in developing regions.

Social Economic Impact on Smart Rail Transit Solution Market

The socio-economic impact of the Global Smart Rail Transit Solution Market is significant, as it enhances urban mobility, reduces traffic congestion, and supports sustainable development. By improving the efficiency and reliability of public transportation, smart rail systems help reduce commute times and boost productivity for millions of daily passengers. They also create employment opportunities in technology, construction, operations, and maintenance. Environmentally, smart rail solutions lower carbon emissions and energy consumption, contributing to cleaner, healthier cities. Economically, improved transport infrastructure attracts investment, supports tourism, and strengthens local economies. Additionally, by making transportation more accessible and inclusive—especially for low-income and elderly populations—smart rail contributes to greater social equity and overall quality of life in urban areas.

Segmental Analysis:

  • Smart Ticketing Systems Segment is Expected to Witness High Growth Over the Forecasted Period

The smart ticketing systems segment is expected to grow rapidly as more transit authorities look for ways to improve passenger convenience and reduce congestion. Smart ticketing uses digital platforms like mobile apps, contactless cards, and QR codes, allowing passengers to buy and validate tickets quickly and easily. This reduces queues and cash handling, making travel smoother. It also helps operators collect valuable data to optimize services. As cities become smarter and more connected, demand for these easy-to-use, efficient ticketing solutions is increasing. Governments are supporting this shift to digital, especially with the push for contactless payments after the COVID-19 pandemic, making smart ticketing a fast-growing market segment.

  • High-Speed Trains Segment is Expected to Witness High Growth Over the Forecasted Period

The high-speed trains segment is poised for strong growth due to increasing demand for faster, more efficient long-distance travel. High-speed rail connects major cities quickly, reducing reliance on air and road transport, which helps lower carbon emissions. Many countries are investing in new high-speed rail projects or upgrading existing lines to improve travel times and capacity. Passengers prefer these trains for their comfort and speed, especially for business and commuter travel. Technological advancements in signaling, automation, and onboard amenities also boost this segment. As governments prioritize sustainable infrastructure and connectivity, the high-speed trains market will continue expanding significantly in the coming years.

  • Mainline Segment is Expected to Witness High Growth Over the Forecasted Period

The mainline rail segment, which includes long-distance and freight rail networks, is expected to see substantial growth. Mainline railways are critical for connecting cities, regions, and countries, supporting both passenger and cargo movement. With growing trade volumes and urban expansion, there’s increased pressure to modernize these networks using smart technologies for better safety, efficiency, and capacity management. Investments in automated signaling, real-time monitoring, and predictive maintenance help reduce delays and operational costs. Additionally, rising demand for greener transport alternatives supports the shift to rail over trucks and planes. This focus on improving mainline rail infrastructure is driving significant growth in this market segment.

  • Onboard Systems Segment is Expected to Witness High Growth Over the Forecasted Period

The onboard systems segment is set to grow rapidly as rail operators aim to enhance safety, comfort, and passenger experience during travel. Onboard systems include things like real-time information displays, Wi-Fi connectivity, automated control systems, and advanced safety features. These technologies help trains run smoothly while keeping passengers informed and connected. Increasing passenger expectations for modern, convenient travel experiences are pushing rail companies to adopt more onboard innovations. Moreover, advances in sensors and AI improve train diagnostics and allow for predictive maintenance, reducing breakdowns. With ongoing digital transformation in railways, the onboard systems market will continue to expand as operators invest in upgrading their fleets.

  • Europe Region is Expected to Witness High Growth Over the Forecasted Period

Europe is expected to lead growth in the smart rail transit market due to its strong focus on sustainable transportation and advanced infrastructure. Many European countries have well-established rail networks and are actively investing in modernizing them with smart technologies such as automation, digital signaling, and smart ticketing. The region’s commitment to reducing carbon emissions and traffic congestion supports this shift.

Additionally, Europe’s smart city initiatives and government funding programs encourage the adoption of smart rail solutions. For instance, in August 2025, Nokia launched 5G radio solution, designed to deliver high-capacity, high-performance and resilient real-time communications to rail operators worldwide, setting the foundation for the Future Railway Mobile Communication System (FRMCS). As a cornerstone for smarter, safer and more efficient rail networks, the solution supports greater digitalization and automation, driving benefits for passengers, businesses and the environment. The launch features the industry's first commercial 5G radio for the 1900 MHz (n101) band, along with Nokia’s Core Enterprise Solution for Railways, purpose-built to accelerate the sector’s digital transformation.

Also, the passenger demand for reliable, efficient, and eco-friendly transport options is high, driving continuous upgrades. These factors combine to make Europe one of the fastest-growing markets for smart rail transit solutions.

Smart Rail Transit Solution Market Competitive Landscape

The competitive landscape of the Global Smart Rail Transit Solution Market is dynamic and includes a mix of established global players and emerging technology providers. Major companies such as Siemens AG, Alstom, Hitachi Rail, Thales Group, Bombardier, and Cisco Systems lead the market with comprehensive smart rail solutions that span automation, signaling, smart ticketing, and data analytics. These firms compete through technological innovation, strategic partnerships, and large-scale government contracts. New entrants and regional players are also gaining ground by offering cost-effective and localized solutions, especially in developing markets. The competition is further intensified by the growing demand for integrated, sustainable, and AI-driven rail systems, pushing companies to continuously invest in R&D and digital transformation to stay ahead.

The major players for above market are:

  • Siemens AG
  • Alstom
  • Hitachi Rail
  • Thales Group
  • Bombardier Transportation (now part of Alstom)
  • Mitsubishi Electric Corporation
  • Cisco Systems, Inc.
  • Huawei Technologies Co., Ltd.
  • ABB Ltd.
  • General Electric (GE Transportation)
  • Wabtec Corporation
  • Indra Sistemas S.A.
  • Nokia Networks
  • Toshiba Corporation
  • ST Engineering
  • Trimble Inc.
  • Advantech Co., Ltd.
  • Atos SE
  • RailVision Ltd.
  • Fujitsu Limited

Recent Developments:

  • In July 2025, Siemens introduced its Mobility’s Mireo Smart Plus B battery trains that highlights a strong shift toward sustainable and low-emission rail solutions in the smart rail transit market. By replacing diesel trains with nearly emission-free battery-powered alternatives, this innovation supports the growing demand for greener transportation and regional mobility modernization. It also demonstrates increasing adoption of advanced technologies like battery propulsion, which can improve energy efficiency and reduce environmental impact. This move sets a precedent for other regions, accelerating the market’s transition to cleaner, smarter rail systems and boosting overall growth in eco-friendly smart rail transit solutions worldwide.


  • In June 2025, Siemens Mobility showcased its innovative solutions aimed at transforming urban mobility for all. Their advanced digital technologies, already used in nearly 50 cities worldwide, help reduce lifecycle costs, improve system reliability, and increase network capacity through cloud-based management. Siemens Mobility’s cutting-edge digital solutions is expected to drive smarter, more efficient rail transit systems, enhancing passenger experience and operational performance. Their expertise and innovations are key to accelerating smart rail adoption, supporting growth in urban rail markets globally.


Frequently Asked Questions (FAQ) :

Q1. What are the main growth driving factors for this market?

The main drivers are rapid urbanization, creating immense pressure for efficient public transit, and increasing government investments in rail infrastructure modernization. The adoption of advanced technologies like IoT, AI, and Big Data for enhanced safety, reduced operational costs (via predictive maintenance), and superior passenger experience further propels market growth.

Q2. What are the main restraining factors for this market?

The primary restraining factors are the high initial capital investment and complexity involved in deploying new smart systems. Integrating these advanced solutions with existing, often aging, legacy rail infrastructure presents a significant challenge. Furthermore, the persistent threat of cybersecurity attacks on critical railway data and operations is a major concern.

Q3. Which segment is expected to witness high growth?

The "Rail Communication and Networking System" segment is projected to witness the highest growth, driven by the need for seamless, real-time data exchange for automated and safe operations. Similarly, the "Training, Support, and Maintenance Services" segment is also expected to grow rapidly due to the complexity of managing new smart technologies.

Q4. Who are the top major players for this market?

The market is dominated by global technology and mobility giants with integrated offerings. The top major players include Siemens Mobility, Alstom, Thales Group, Hitachi Rail, and technology providers like Cisco Systems and Huawei. These companies focus on digital signaling, rolling stock, and data-driven solutions.

Q5. Which country is the largest player?

Regionally, Europe generally holds the largest market share due to its established infrastructure and strong government-led modernization projects. However, the Asia-Pacific region, particularly China, is the fastest-growing market and is a dominant player due to massive and continuous investments in expanding its high-speed and metro rail networks.

Smart Rail Transit Solution MARKET STUDY GLOBAL MARKET ANALYSIS, INSIGHTS AND FORECAST, 2023-2029

    1. Introduction

    • 1.1. Research Scope
    • 1.2. Market Segmentation
    • 1.3. Research Methodology
    • 1.4. Definitions and Assumptions

    2. Executive Summary

      3. Market Dynamics

      • 3.1. Market Drivers
      • 3.2. Market Restraints
      • 3.3. Market Opportunities

      4. Key Insights

      • 4.1. Key Emerging Trends – For Major Countries
      • 4.2. Latest Technological Advancement
      • 4.3. Regulatory Landscape
      • 4.4. Industry SWOT Analysis
      • 4.5. Porters Five Forces Analysis

      5. Global Smart Rail Transit Solution Market Analysis (USD Billion), Insights and Forecast, 2018-2029

      • 5.1. Key Findings / Summary
      • 5.2. Market Analysis, Insights and Forecast – By Segment 1
        • 5.2.1. Sub-Segment 1
        • 5.2.2. Sub-Segment 2
      • 5.3. Market Analysis, Insights and Forecast – By Segment 2
        • 5.3.1. Sub-Segment 1
        • 5.3.2. Sub-Segment 2
        • 5.3.3. Sub-Segment 3
        • 5.3.4. Others
      • 5.4. Market Analysis, Insights and Forecast – By Segment 3
        • 5.4.1. Sub-Segment 1
        • 5.4.2. Sub-Segment 2
        • 5.4.3. Sub-Segment 3
        • 5.4.4. Others
      • 5.5. Market Analysis, Insights and Forecast – By Region
        • 5.5.1. North America
        • 5.5.2. Latin America
        • 5.5.3. Europe
        • 5.5.4. Asia Pacific
        • 5.5.5. Middle East and Africa

      6. North America Smart Rail Transit Solution Market Analysis (USD Billion), Insights and Forecast, 2018-2029

      • 6.1. Key Findings / Summary
      • 6.2. Market Analysis, Insights and Forecast – By Segment 1
        • 6.2.1. Sub-Segment 1
        • 6.2.2. Sub-Segment 2
      • 6.3. Market Analysis, Insights and Forecast – By Segment 2
        • 6.3.1. Sub-Segment 1
        • 6.3.2. Sub-Segment 2
        • 6.3.3. Sub-Segment 3
        • 6.3.4. Others
      • 6.4. Market Analysis, Insights and Forecast – By Segment 3
        • 6.4.1. Sub-Segment 1
        • 6.4.2. Sub-Segment 2
        • 6.4.3. Sub-Segment 3
        • 6.4.4. Others
      • 6.5. Market Analysis, Insights and Forecast – By Country
        • 6.5.1. U.S.
        • 6.5.2. Canada

      7. Latin America Smart Rail Transit Solution Market Analysis (USD Billion), Insights and Forecast, 2018-2029

      • 7.1. Key Findings / Summary
      • 7.2. Market Analysis, Insights and Forecast – By Segment 1
        • 7.2.1. Sub-Segment 1
        • 7.2.2. Sub-Segment 2
      • 7.3. Market Analysis, Insights and Forecast – By Segment 2
        • 7.3.1. Sub-Segment 1
        • 7.3.2. Sub-Segment 2
        • 7.3.3. Sub-Segment 3
        • 7.3.4. Others
      • 7.4. Market Analysis, Insights and Forecast – By Segment 3
        • 7.4.1. Sub-Segment 1
        • 7.4.2. Sub-Segment 2
        • 7.4.3. Sub-Segment 3
        • 7.4.4. Others
      • 7.5. Insights and Forecast – By Country
        • 7.5.1. Brazil
        • 7.5.2. Mexico
        • 7.5.3. Rest of Latin America

      8. Europe Smart Rail Transit Solution Market Analysis (USD Billion), Insights and Forecast, 2018-2029

      • 8.1. Key Findings / Summary
      • 8.2. Market Analysis, Insights and Forecast – By Segment 1
        • 8.2.1. Sub-Segment 1
        • 8.2.2. Sub-Segment 2
      • 8.3. Market Analysis, Insights and Forecast – By Segment 2
        • 8.3.1. Sub-Segment 1
        • 8.3.2. Sub-Segment 2
        • 8.3.3. Sub-Segment 3
        • 8.3.4. Others
      • 8.4. Market Analysis, Insights and Forecast – By Segment 3
        • 8.4.1. Sub-Segment 1
        • 8.4.2. Sub-Segment 2
        • 8.4.3. Sub-Segment 3
        • 8.4.4. Others
      • 8.5. Market Analysis, Insights and Forecast – By Country
        • 8.5.1. UK
        • 8.5.2. Germany
        • 8.5.3. France
        • 8.5.4. Italy
        • 8.5.5. Spain
        • 8.5.6. Russia
        • 8.5.7. Rest of Europe

      9. Asia Pacific Smart Rail Transit Solution Market Analysis (USD Billion), Insights and Forecast, 2018-2029

      • 9.1. Key Findings / Summary
      • 9.2. Market Analysis, Insights and Forecast – By Segment 1
        • 9.2.1. Sub-Segment 1
        • 9.2.2. Sub-Segment 2
      • 9.3. Market Analysis, Insights and Forecast – By Segment 2
        • 9.3.1. Sub-Segment 1
        • 9.3.2. Sub-Segment 2
        • 9.3.3. Sub-Segment 3
        • 9.3.4. Others
      • 9.4. Market Analysis, Insights and Forecast – By Segment 3
        • 9.4.1. Sub-Segment 1
        • 9.4.2. Sub-Segment 2
        • 9.4.3. Sub-Segment 3
        • 9.4.4. Others
      • 9.5. Market Analysis, Insights and Forecast – By Country
        • 9.5.1. China
        • 9.5.2. India
        • 9.5.3. Japan
        • 9.5.4. Australia
        • 9.5.5. South East Asia
        • 9.5.6. Rest of Asia Pacific

      10. Middle East & Africa Smart Rail Transit Solution Market Analysis (USD Billion), Insights and Forecast, 2018-2029

      • 10.1. Key Findings / Summary
      • 10.2. Market Analysis, Insights and Forecast – By Segment 1
        • 10.2.1. Sub-Segment 1
        • 10.2.2. Sub-Segment 2
      • 10.3. Market Analysis, Insights and Forecast – By Segment 2
        • 10.3.1. Sub-Segment 1
        • 10.3.2. Sub-Segment 2
        • 10.3.3. Sub-Segment 3
        • 10.3.4. Others
      • 10.4. Market Analysis, Insights and Forecast – By Segment 3
        • 10.4.1. Sub-Segment 1
        • 10.4.2. Sub-Segment 2
        • 10.4.3. Sub-Segment 3
        • 10.4.4. Others
      • 10.5. Market Analysis, Insights and Forecast – By Country
        • 10.5.1. GCC
        • 10.5.2. South Africa
        • 10.5.3. Rest of Middle East & Africa

      11. Competitive Analysis

      • 11.1. Company Market Share Analysis, 2018
      • 11.2. Key Industry Developments
      • 11.3. Company Profile
        • 11.3.1. Company 1
          • 11.3.1.1. Business Overview
          • 11.3.1.2. Segment 1 & Service Offering
          • 11.3.1.3. Overall Revenue
          • 11.3.1.4. Geographic Presence
          • 11.3.1.5. Recent Development
        *Similar details will be provided for the following companies
        • 11.3.2. Company 2
        • 11.3.3. Company 3
        • 11.3.4. Company 4
        • 11.3.5. Company 5
        • 11.3.6. Company 6
        • 11.3.7. Company 7
        • 11.3.8. Company 8
        • 11.3.9. Company 9
        • 11.3.10. Company 10
        • 11.3.11. Company 11
        • 11.3.12. Company 12
      List of Figures

      Figure 1: Global Smart Rail Transit Solution Market Revenue Breakdown (USD Billion, %) by Region, 2023 & 2029
      Figure 2: Global Smart Rail Transit Solution Market Value Share (%), By Segment 1, 2023 & 2029
      Figure 3: Global Smart Rail Transit Solution Market Forecast (USD Billion), by Sub-Segment 1, 2018-2029
      Figure 4: Global Smart Rail Transit Solution Market Forecast (USD Billion), by Sub-Segment 2, 2018-2029
      Figure 5: Global Smart Rail Transit Solution Market Value Share (%), By Segment 2, 2023 & 2029
      Figure 6: Global Smart Rail Transit Solution Market Forecast (USD Billion), by Sub-Segment 1, 2018-2029
      Figure 7: Global Smart Rail Transit Solution Market Forecast (USD Billion), by Sub-Segment 2, 2018-2029
      Figure 8: Global Smart Rail Transit Solution Market Forecast (USD Billion), by Sub-Segment 3, 2018-2029
      Figure 9: Global Smart Rail Transit Solution Market Forecast (USD Billion), by Others, 2018-2029
      Figure 10: Global Smart Rail Transit Solution Market Value Share (%), By Segment 3, 2023 & 2029
      Figure 11: Global Smart Rail Transit Solution Market Forecast (USD Billion), by Sub-Segment 1, 2018-2029
      Figure 12: Global Smart Rail Transit Solution Market Forecast (USD Billion), by Sub-Segment 2, 2018-2029
      Figure 13: Global Smart Rail Transit Solution Market Forecast (USD Billion), by Sub-Segment 3, 2018-2029
      Figure 14: Global Smart Rail Transit Solution Market Forecast (USD Billion), by Others, 2018-2029
      Figure 15: Global Smart Rail Transit Solution Market Value (USD Billion), by Region, 2023 & 2029
      Figure 16: North America Smart Rail Transit Solution Market Value Share (%), By Segment 1, 2023 & 2029
      Figure 17: North America Smart Rail Transit Solution Market Forecast (USD Billion), by Sub-Segment 1, 2018-2029
      Figure 18: North America Smart Rail Transit Solution Market Forecast (USD Billion), by Sub-Segment 2, 2018-2029
      Figure 19: North America Smart Rail Transit Solution Market Value Share (%), By Segment 2, 2023 & 2029
      Figure 20: North America Smart Rail Transit Solution Market Forecast (USD Billion), by Sub-Segment 1, 2018-2029
      Figure 21: North America Smart Rail Transit Solution Market Forecast (USD Billion), by Sub-Segment 2, 2018-2029
      Figure 22: North America Smart Rail Transit Solution Market Forecast (USD Billion), by Sub-Segment 3, 2018-2029
      Figure 23: North America Smart Rail Transit Solution Market Forecast (USD Billion), by Others, 2018-2029
      Figure 24: North America Smart Rail Transit Solution Market Value Share (%), By Segment 3, 2023 & 2029
      Figure 25: North America Smart Rail Transit Solution Market Forecast (USD Billion), by Sub-Segment 1, 2018-2029
      Figure 26: North America Smart Rail Transit Solution Market Forecast (USD Billion), by Sub-Segment 2, 2018-2029
      Figure 27: North America Smart Rail Transit Solution Market Forecast (USD Billion), by Sub-Segment 3, 2018-2029
      Figure 28: North America Smart Rail Transit Solution Market Forecast (USD Billion), by Others, 2018-2029
      Figure 29: North America Smart Rail Transit Solution Market Forecast (USD Billion), by U.S., 2018-2029
      Figure 30: North America Smart Rail Transit Solution Market Forecast (USD Billion), by Canada, 2018-2029
      Figure 31: Latin America Smart Rail Transit Solution Market Value Share (%), By Segment 1, 2023 & 2029
      Figure 32: Latin America Smart Rail Transit Solution Market Forecast (USD Billion), by Sub-Segment 1, 2018-2029
      Figure 33: Latin America Smart Rail Transit Solution Market Forecast (USD Billion), by Sub-Segment 2, 2018-2029
      Figure 34: Latin America Smart Rail Transit Solution Market Value Share (%), By Segment 2, 2023 & 2029
      Figure 35: Latin America Smart Rail Transit Solution Market Forecast (USD Billion), by Sub-Segment 1, 2018-2029
      Figure 36: Latin America Smart Rail Transit Solution Market Forecast (USD Billion), by Sub-Segment 2, 2018-2029
      Figure 37: Latin America Smart Rail Transit Solution Market Forecast (USD Billion), by Sub-Segment 3, 2018-2029
      Figure 38: Latin America Smart Rail Transit Solution Market Forecast (USD Billion), by Others, 2018-2029
      Figure 39: Latin America Smart Rail Transit Solution Market Value Share (%), By Segment 3, 2023 & 2029
      Figure 40: Latin America Smart Rail Transit Solution Market Forecast (USD Billion), by Sub-Segment 1, 2018-2029
      Figure 41: Latin America Smart Rail Transit Solution Market Forecast (USD Billion), by Sub-Segment 2, 2018-2029
      Figure 42: Latin America Smart Rail Transit Solution Market Forecast (USD Billion), by Sub-Segment 3, 2018-2029
      Figure 43: Latin America Smart Rail Transit Solution Market Forecast (USD Billion), by Others, 2018-2029
      Figure 44: Latin America Smart Rail Transit Solution Market Forecast (USD Billion), by Brazil, 2018-2029
      Figure 45: Latin America Smart Rail Transit Solution Market Forecast (USD Billion), by Mexico, 2018-2029
      Figure 46: Latin America Smart Rail Transit Solution Market Forecast (USD Billion), by Rest of Latin America, 2018-2029
      Figure 47: Europe Smart Rail Transit Solution Market Value Share (%), By Segment 1, 2023 & 2029
      Figure 48: Europe Smart Rail Transit Solution Market Forecast (USD Billion), by Sub-Segment 1, 2018-2029
      Figure 49: Europe Smart Rail Transit Solution Market Forecast (USD Billion), by Sub-Segment 2, 2018-2029
      Figure 50: Europe Smart Rail Transit Solution Market Value Share (%), By Segment 2, 2023 & 2029
      Figure 51: Europe Smart Rail Transit Solution Market Forecast (USD Billion), by Sub-Segment 1, 2018-2029
      Figure 52: Europe Smart Rail Transit Solution Market Forecast (USD Billion), by Sub-Segment 2, 2018-2029
      Figure 53: Europe Smart Rail Transit Solution Market Forecast (USD Billion), by Sub-Segment 3, 2018-2029
      Figure 54: Europe Smart Rail Transit Solution Market Forecast (USD Billion), by Others, 2018-2029
      Figure 55: Europe Smart Rail Transit Solution Market Value Share (%), By Segment 3, 2023 & 2029
      Figure 56: Europe Smart Rail Transit Solution Market Forecast (USD Billion), by Sub-Segment 1, 2018-2029
      Figure 57: Europe Smart Rail Transit Solution Market Forecast (USD Billion), by Sub-Segment 2, 2018-2029
      Figure 58: Europe Smart Rail Transit Solution Market Forecast (USD Billion), by Sub-Segment 3, 2018-2029
      Figure 59: Europe Smart Rail Transit Solution Market Forecast (USD Billion), by Others, 2018-2029
      Figure 60: Europe Smart Rail Transit Solution Market Forecast (USD Billion), by U.K., 2018-2029
      Figure 61: Europe Smart Rail Transit Solution Market Forecast (USD Billion), by Germany, 2018-2029
      Figure 62: Europe Smart Rail Transit Solution Market Forecast (USD Billion), by France, 2018-2029
      Figure 63: Europe Smart Rail Transit Solution Market Forecast (USD Billion), by Italy, 2018-2029
      Figure 64: Europe Smart Rail Transit Solution Market Forecast (USD Billion), by Spain, 2018-2029
      Figure 65: Europe Smart Rail Transit Solution Market Forecast (USD Billion), by Russia, 2018-2029
      Figure 66: Europe Smart Rail Transit Solution Market Forecast (USD Billion), by Rest of Europe, 2018-2029
      Figure 67: Asia Pacific Smart Rail Transit Solution Market Value Share (%), By Segment 1, 2023 & 2029
      Figure 68: Asia Pacific Smart Rail Transit Solution Market Forecast (USD Billion), by Sub-Segment 1, 2018-2029
      Figure 69: Asia Pacific Smart Rail Transit Solution Market Forecast (USD Billion), by Sub-Segment 2, 2018-2029
      Figure 70: Asia Pacific Smart Rail Transit Solution Market Value Share (%), By Segment 2, 2023 & 2029
      Figure 71: Asia Pacific Smart Rail Transit Solution Market Forecast (USD Billion), by Sub-Segment 1, 2018-2029
      Figure 72: Asia Pacific Smart Rail Transit Solution Market Forecast (USD Billion), by Sub-Segment 2, 2018-2029
      Figure 73: Asia Pacific Smart Rail Transit Solution Market Forecast (USD Billion), by Sub-Segment 3, 2018-2029
      Figure 74: Asia Pacific Smart Rail Transit Solution Market Forecast (USD Billion), by Others, 2018-2029
      Figure 75: Asia Pacific Smart Rail Transit Solution Market Value Share (%), By Segment 3, 2023 & 2029
      Figure 76: Asia Pacific Smart Rail Transit Solution Market Forecast (USD Billion), by Sub-Segment 1, 2018-2029
      Figure 77: Asia Pacific Smart Rail Transit Solution Market Forecast (USD Billion), by Sub-Segment 2, 2018-2029
      Figure 78: Asia Pacific Smart Rail Transit Solution Market Forecast (USD Billion), by Sub-Segment 3, 2018-2029
      Figure 79: Asia Pacific Smart Rail Transit Solution Market Forecast (USD Billion), by Others, 2018-2029
      Figure 80: Asia Pacific Smart Rail Transit Solution Market Forecast (USD Billion), by China, 2018-2029
      Figure 81: Asia Pacific Smart Rail Transit Solution Market Forecast (USD Billion), by India, 2018-2029
      Figure 82: Asia Pacific Smart Rail Transit Solution Market Forecast (USD Billion), by Japan, 2018-2029
      Figure 83: Asia Pacific Smart Rail Transit Solution Market Forecast (USD Billion), by Australia, 2018-2029
      Figure 84: Asia Pacific Smart Rail Transit Solution Market Forecast (USD Billion), by Southeast Asia, 2018-2029
      Figure 85: Asia Pacific Smart Rail Transit Solution Market Forecast (USD Billion), by Rest of Asia Pacific, 2018-2029
      Figure 86: Middle East & Africa Smart Rail Transit Solution Market Value Share (%), By Segment 1, 2023 & 2029
      Figure 87: Middle East & Africa Smart Rail Transit Solution Market Forecast (USD Billion), by Sub-Segment 1, 2018-2029
      Figure 88: Middle East & Africa Smart Rail Transit Solution Market Forecast (USD Billion), by Sub-Segment 2, 2018-2029
      Figure 89: Middle East & Africa Smart Rail Transit Solution Market Value Share (%), By Segment 2, 2023 & 2029
      Figure 90: Middle East & Africa Smart Rail Transit Solution Market Forecast (USD Billion), by Sub-Segment 1, 2018-2029
      Figure 91: Middle East & Africa Smart Rail Transit Solution Market Forecast (USD Billion), by Sub-Segment 2, 2018-2029
      Figure 92: Middle East & Africa Smart Rail Transit Solution Market Forecast (USD Billion), by Sub-Segment 3, 2018-2029
      Figure 93: Middle East & Africa Smart Rail Transit Solution Market Forecast (USD Billion), by Others, 2018-2029
      Figure 94: Middle East & Africa Smart Rail Transit Solution Market Value Share (%), By Segment 3, 2023 & 2029
      Figure 95: Middle East & Africa Smart Rail Transit Solution Market Forecast (USD Billion), by Sub-Segment 1, 2018-2029
      Figure 96: Middle East & Africa Smart Rail Transit Solution Market Forecast (USD Billion), by Sub-Segment 2, 2018-2029
      Figure 97: Middle East & Africa Smart Rail Transit Solution Market Forecast (USD Billion), by Sub-Segment 3, 2018-2029
      Figure 98: Middle East & Africa Smart Rail Transit Solution Market Forecast (USD Billion), by Others, 2018-2029
      Figure 99: Middle East & Africa Smart Rail Transit Solution Market Forecast (USD Billion), by GCC, 2018-2029
      Figure 100: Middle East & Africa Smart Rail Transit Solution Market Forecast (USD Billion), by South Africa, 2018-2029
      Figure 101: Middle East & Africa Smart Rail Transit Solution Market Forecast (USD Billion), by Rest of Middle East & Africa, 2018-2029 
      List of Tables
      Table 1: Global Smart Rail Transit Solution Market Revenue (USD Billion) Forecast, by Segment 1, 2018-2029
      Table 2: Global Smart Rail Transit Solution Market Revenue (USD Billion) Forecast, by Segment 2, 2018-2029
      Table 3: Global Smart Rail Transit Solution Market Revenue (USD Billion) Forecast, by Segment 3, 2018-2029
      Table 4: Global Smart Rail Transit Solution Market Revenue (USD Billion) Forecast, by Region, 2018-2029
      Table 5: North America Smart Rail Transit Solution Market Revenue (USD Billion) Forecast, by Segment 1, 2018-2029
      Table 6: North America Smart Rail Transit Solution Market Revenue (USD Billion) Forecast, by Segment 2, 2018-2029
      Table 7: North America Smart Rail Transit Solution Market Revenue (USD Billion) Forecast, by Segment 3, 2018-2029
      Table 8: North America Smart Rail Transit Solution Market Revenue (USD Billion) Forecast, by Country, 2018-2029
      Table 9: Europe Smart Rail Transit Solution Market Revenue (USD Billion) Forecast, by Segment 1, 2018-2029
      Table 10: Europe Smart Rail Transit Solution Market Revenue (USD Billion) Forecast, by Segment 2, 2018-2029
      Table 11: Europe Smart Rail Transit Solution Market Revenue (USD Billion) Forecast, by Segment 3, 2018-2029
      Table 12: Europe Smart Rail Transit Solution Market Revenue (USD Billion) Forecast, by Country, 2018-2029
      Table 13: Latin America Smart Rail Transit Solution Market Revenue (USD Billion) Forecast, by Segment 1, 2018-2029
      Table 14: Latin America Smart Rail Transit Solution Market Revenue (USD Billion) Forecast, by Segment 2, 2018-2029
      Table 15: Latin America Smart Rail Transit Solution Market Revenue (USD Billion) Forecast, by Segment 3, 2018-2029
      Table 16: Latin America Smart Rail Transit Solution Market Revenue (USD Billion) Forecast, by Country, 2018-2029
      Table 17: Asia Pacific Smart Rail Transit Solution Market Revenue (USD Billion) Forecast, by Segment 1, 2018-2029
      Table 18: Asia Pacific Smart Rail Transit Solution Market Revenue (USD Billion) Forecast, by Segment 2, 2018-2029
      Table 19: Asia Pacific Smart Rail Transit Solution Market Revenue (USD Billion) Forecast, by Segment 3, 2018-2029
      Table 20: Asia Pacific Smart Rail Transit Solution Market Revenue (USD Billion) Forecast, by Country, 2018-2029
      Table 21: Middle East & Africa Smart Rail Transit Solution Market Revenue (USD Billion) Forecast, by Segment 1, 2018-2029
      Table 22: Middle East & Africa Smart Rail Transit Solution Market Revenue (USD Billion) Forecast, by Segment 2, 2018-2029
      Table 23: Middle East & Africa Smart Rail Transit Solution Market Revenue (USD Billion) Forecast, by Segment 3, 2018-2029
      Table 24: Middle East & Africa Smart Rail Transit Solution Market Revenue (USD Billion) Forecast, by Country, 2018-2029
      Research Process

      Data Library Research are conducted by industry experts who offer insight on industry structure, market segmentations technology assessment and competitive landscape (CL), and penetration, as well as on emerging trends. Their analysis is based on primary interviews (~ 80%) and secondary research (~ 20%) as well as years of professional expertise in their respective industries. Adding to this, by analysing historical trends and current market positions, our analysts predict where the market will be headed for the next five years. Furthermore, the varying trends of segment & categories geographically presented are also studied and the estimated based on the primary & secondary research.

      In this particular report from the supply side Data Library Research has conducted primary surveys (interviews) with the key level executives (VP, CEO’s, Marketing Director, Business Development Manager and SOFT) of the companies that active & prominent as well as the midsized organization

      FIGURE 1: DLR RESEARH PROCESS

      research-methodology1

      Primary Research

      Extensive primary research was conducted to gain a deeper insight of the market and industry performance. The analysis is based on both primary and secondary research as well as years of professional expertise in the respective industries.

      In addition to analysing current and historical trends, our analysts predict where the market is headed over the next five years.

      It varies by segment for these categories geographically presented in the list of market tables. Speaking about this particular report we have conducted primary surveys (interviews) with the key level executives (VP, CEO’s, Marketing Director, Business Development Manager and many more) of the major players active in the market.

      Secondary Research

      Secondary research was mainly used to collect and identify information useful for the extensive, technical, market-oriented, and Friend’s study of the Global Extra Neutral Alcohol. It was also used to obtain key information about major players, market classification and segmentation according to the industry trends, geographical markets, and developments related to the market and technology perspectives. For this study, analysts have gathered information from various credible sources, such as annual reports, sec filings, journals, white papers, SOFT presentations, and company web sites.

      Market Size Estimation

      Both, top-down and bottom-up approaches were used to estimate and validate the size of the Global market and to estimate the size of various other dependent submarkets in the overall Extra Neutral Alcohol. The key players in the market were identified through secondary research and their market contributions in the respective geographies were determined through primary and secondary research.

      Forecast Model

      research-methodology2

      Happy to Assist You

      If you have a question?

      info@datalibraryresearch.com

      IND : +91 955 279 0357

      Browse Related Reports