Get Complete Analysis Of The Report - Download Updated Free Sample PDF
The Global Smart Tea Garden Solution Market refers to the industry focused on technologies and systems that optimize tea cultivation and management. These solutions use IoT devices, sensors, data analytics, and automation to monitor soil, weather, irrigation, and plant health, improving yield, quality, and sustainability. They help tea growers make data-driven decisions, reduce resource waste, and enhance operational efficiency, transforming traditional tea gardens into modern, technology-driven plantations.
The growth of the Global Smart Tea Garden Solution Market is driven by increasing adoption of precision agriculture and digital farming technologies in tea cultivation. Rising demand for high-quality tea, coupled with the need to optimize yield, reduce labor costs, and conserve resources like water and fertilizers, encourages the use of smart sensors, IoT devices, and automated irrigation systems. Additionally, government initiatives supporting sustainable agriculture, growing awareness of climate-resilient farming practices, and the integration of data analytics and AI for real-time monitoring further accelerate market expansion, enabling tea producers to enhance productivity, quality, and profitability in a competitive global landscape.
The Global Smart Tea Garden Solution Market is witnessing trends toward increased automation and digital integration in tea plantations. Advanced IoT sensors, drone-based monitoring, and AI-powered analytics are being adopted for real-time tracking of soil health, moisture levels, and pest infestations. Additionally, there is a growing emphasis on sustainable and climate-resilient farming practices, including precision irrigation and nutrient management. Cloud-based platforms and mobile applications are also emerging, enabling remote management and predictive insights, while integration with supply chain systems enhances operational efficiency, quality control, and traceability, reflecting the market’s shift toward technologically driven, data-centric tea cultivation solutions.
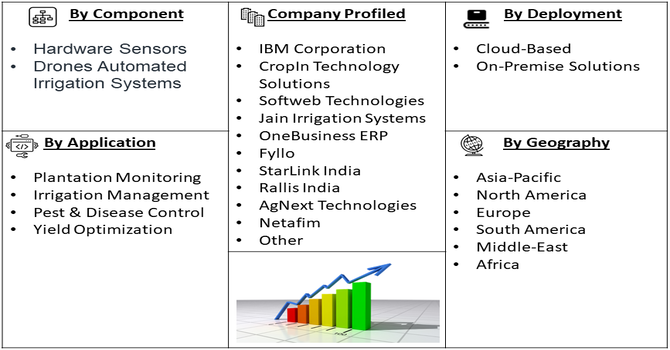
Segmentation: The Global Smart Tea Garden Solution Market can be segmented by Component (Hardware (Sensors, Drones, and Automated Irrigation Systems), Software Platforms (Farm Management & Analytics, and Services Including Installation, Maintenance, and Consulting)), Application (Plantation Monitoring, Irrigation Management, Pest & Disease Control, and Yield Optimization), Deployment (Cloud-Based and On-Premise Solutions) and Geography (North America, Europe, Asia-Pacific, Middle East and Africa, and South America). The report provides the value (in USD million) for the above segments.
For Detailed Market Segmentation - Get a Free Sample PDF
Market Drivers:
The adoption of precision agriculture technologies is a key driver for the Global Smart Tea Garden Solution Market. Tea plantations are increasingly leveraging IoT-enabled sensors, drones, and automated irrigation systems to monitor soil conditions, weather patterns, and crop health in real time. These technologies allow planters to optimize resource usage, enhance yield quality, and reduce operational costs. Smart solutions also enable predictive analytics, early detection of pests and diseases, and better decision-making regarding fertilization and irrigation schedules. As tea growers seek to maximize productivity while minimizing environmental impact, the demand for integrated smart tea garden solutions has risen sharply, driving market growth globally.
Sustainability and quality are becoming critical factors in global tea production, pushing the demand for smart tea garden solutions. Consumers increasingly prefer tea cultivated using eco-friendly methods with minimal chemical use. Smart solutions enable planters to precisely monitor nutrient application, water usage, and pest control, reducing chemical dependence and promoting sustainable farming practices. Additionally, real-time monitoring and automation improve consistency and quality of tea leaves, meeting international quality standards. Government initiatives and sustainability certifications further incentivize tea estates to adopt digital solutions, boosting market growth. Consequently, the market benefits from growing awareness of environmentally responsible and high-quality tea cultivation practices.
Market Restraints:
The widespread adoption of smart tea garden solutions is restrained by the high initial costs of hardware, software, and installation. Smallholder tea farmers, who constitute a significant portion of the market in regions like India and Sri Lanka, may find it challenging to afford IoT sensors, drones, automated irrigation systems, and advanced farm management software. Additionally, implementation requires technical expertise for integration, maintenance, and data analytics, further increasing operational costs. Limited awareness and lack of trained personnel in rural areas can delay adoption. These financial and technical barriers restrain the market, particularly among small-scale planters, despite the long-term benefits of efficiency and yield improvement offered by smart solutions.
The Global Smart Tea Garden Solution Market has significant socioeconomic impact by enhancing productivity, income, and sustainability in the tea industry. By enabling precise irrigation, nutrient management, and pest control, these solutions reduce labor dependency and operational costs while improving tea quality and yield. Small and large tea estates benefit from higher profitability, supporting rural employment and economic development in tea-growing regions. Additionally, adoption of eco-friendly practices aligns with global sustainability goals, promoting environmental stewardship. The integration of smart technologies also encourages skill development and digital literacy among farm workers, contributing to long-term socioeconomic growth and modernization of traditional tea cultivation practices worldwide.
Segmental Analysis:
The Farm Management & Analytics segment is expected to witness the highest growth over the forecast period due to increasing adoption of data-driven decision-making in tea cultivation. These solutions enable precise monitoring of soil health, weather patterns, irrigation needs, and crop yield forecasts. By integrating IoT sensors, GPS mapping, and AI analytics, tea estates can optimize resource utilization, reduce waste, and enhance overall productivity. The growing focus on operational efficiency, cost reduction, and sustainability is driving tea garden owners to invest in advanced analytics platforms, boosting the demand for farm management solutions globally.
The Plantation Monitoring segment is projected to experience significant growth as tea estates increasingly adopt remote sensing and IoT-based monitoring technologies. Continuous surveillance of plantation conditions—including soil moisture, nutrient levels, pest infestation, and microclimate variations—helps improve crop health and quality. Real-time monitoring reduces manual labor and allows timely interventions, minimizing yield losses. The rising need for precision agriculture, enhanced productivity, and sustainability in tea plantations is accelerating the adoption of advanced plantation monitoring systems, making this segment a key growth driver in the Smart Tea Garden Solution market.
The Cloud-Based segment is expected to witness substantial growth due to its scalability, real-time data access, and cost-effectiveness. Cloud platforms enable tea garden managers to store, analyze, and share large volumes of operational and environmental data across multiple estates. These systems support predictive analytics, automated reporting, and remote decision-making, facilitating proactive management practices. With increasing smartphone and internet penetration in rural tea-growing regions, cloud adoption is rising, allowing smaller estates to access sophisticated management tools. The ability to centralize plantation data, improve collaboration, and enhance efficiency is driving strong demand for cloud-based smart tea garden solutions globally.
The Asia Pacific region is anticipated to witness the highest growth in the Smart Tea Garden Solution market due to the presence of major tea-producing countries such as India, China, and Sri Lanka. Rapid technological adoption, government initiatives promoting digital agriculture, and increasing awareness of precision farming practices are driving market expansion. Growing demand for high-quality tea, combined with the need for sustainable cultivation practices, encourages tea estates to invest in IoT-enabled sensors, analytics, and monitoring platforms. Additionally, rising internet penetration and smartphone usage in rural areas further support the deployment of smart solutions, making Asia Pacific a key growth hub for the market.
| Report Matrics | Details |
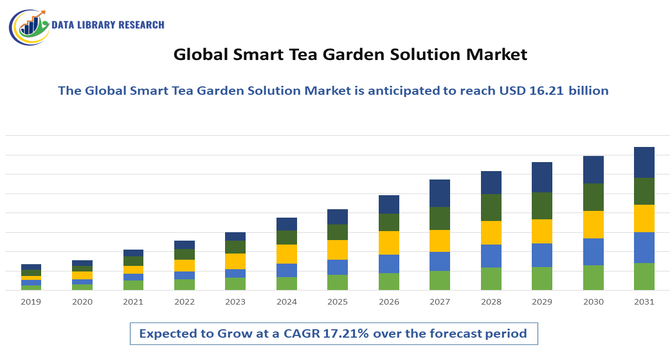
| Market Size Value | USD 16.21 billion |
| Growth Rate | CAGR of 17.21% |
| Forecast | 2026-2033 |
| Historical data | 2021-2024 |
| Base Year | 2025 |
| Report Coverage | Forecasted revenue, company rating, competitive environment, growth drivers, and trends |
| Segment Coverage | Type, Application, End-User, Geography |
| Regional Scope | North America, Europe, Asia Pacific, Middle East |
| Customized scope | Free customization of reports (With 3 months Analysis Support ) |
| To Learn More About This Report | Request a Free Sample Copy |
The Global Smart Tea Garden Solution Market is moderately fragmented and highly competitive, comprising both established agritech firms and emerging niche players. Companies are investing in IoT sensors, AI-driven analytics, and cloud-based platforms to offer differentiated, value-added solutions for tea estates. Strategic partnerships, acquisitions, and regional customization—especially in Asia-Pacific—are common to expand reach and enhance product offerings. Market competition is increasingly shifting from hardware pricing to service-oriented, subscription-based models, emphasizing analytics, scalability, and local support. This dynamic fosters rapid innovation, improved operational efficiency, and sustainable cultivation practices, driving both technological advancement and adoption across global tea plantations.
The major players for above market are:
Recent Development
Q1. What are the main growth-driving factors for this market?
The Smart Tea Garden Solution market is strongly driven by the necessity for efficient and sustainable tea production amidst rising global demand for high-quality tea. Key factors include increasing labor costs and scarcity, which push farms toward automation and data-driven management. Furthermore, government initiatives promoting smart agriculture, coupled with advancements in IoT sensor networks and AI-powered data analytics for precision irrigation and predictive maintenance, are revolutionizing traditional tea farming practices.
Q2. What are the main restraining factors for this market?
The primary restraining factors are related to the adoption challenges faced by farmers, particularly the high initial capital expenditure required for implementing advanced IoT sensors, automated harvesting, and AI software. Many tea farmers, especially small and medium-sized operations, lack the technical expertise and financial resources for seamless technology integration. Additionally, unpredictable climate change events leading to yield instability pose ongoing supply challenges that smart solutions must consistently overcome.
Q3. Which segment is expected to witness high growth?
The Software/Data Analytics segment is expected to witness the highest growth rate. This is driven by the increasing integration of AI and Machine Learning for real-time data analysis of weather patterns, soil conditions, and plant health. The ability of these platforms to provide predictive maintenance alerts and optimize resource use (water, fertilizer) for maximum yield and improved tea quality is critical, ensuring the software becomes the value-adding core of the entire smart solution.
Q4. Who are the top major players for this market?
The market involves a collaboration between agricultural technology firms and major tea producers. Key players from the broader Smart Plantation Management Systems market include technology providers like Robert Bosch, Deere & Company, and Netafim (specialized in irrigation). Additionally, local solution providers and large tea conglomerates such as the Tata Consumer Food Limited and McLeod Russel India Limited are driving innovation and implementation in their extensive tea estates across major producing regions.
Q5. Which country is the largest player?
China is projected to be the largest player in the Global Smart Tea Garden Solution market. As the world's largest producer of tea, China possesses the most extensive cultivation area and is aggressively pushing the adoption of smart agriculture. This leadership is fueled by the country's advanced technological infrastructure, significant government subsidies promoting technological adoption in farming, and the large-scale investment by state-owned and private entities in modernizing tea garden operations.
Data Library Research are conducted by industry experts who offer insight on industry structure, market segmentations technology assessment and competitive landscape (CL), and penetration, as well as on emerging trends. Their analysis is based on primary interviews (~ 80%) and secondary research (~ 20%) as well as years of professional expertise in their respective industries. Adding to this, by analysing historical trends and current market positions, our analysts predict where the market will be headed for the next five years. Furthermore, the varying trends of segment & categories geographically presented are also studied and the estimated based on the primary & secondary research.
In this particular report from the supply side Data Library Research has conducted primary surveys (interviews) with the key level executives (VP, CEO’s, Marketing Director, Business Development Manager and SOFT) of the companies that active & prominent as well as the midsized organization
FIGURE 1: DLR RESEARH PROCESS
Extensive primary research was conducted to gain a deeper insight of the market and industry performance. The analysis is based on both primary and secondary research as well as years of professional expertise in the respective industries.
In addition to analysing current and historical trends, our analysts predict where the market is headed over the next five years.
It varies by segment for these categories geographically presented in the list of market tables. Speaking about this particular report we have conducted primary surveys (interviews) with the key level executives (VP, CEO’s, Marketing Director, Business Development Manager and many more) of the major players active in the market.
Secondary ResearchSecondary research was mainly used to collect and identify information useful for the extensive, technical, market-oriented, and Friend’s study of the Global Extra Neutral Alcohol. It was also used to obtain key information about major players, market classification and segmentation according to the industry trends, geographical markets, and developments related to the market and technology perspectives. For this study, analysts have gathered information from various credible sources, such as annual reports, sec filings, journals, white papers, SOFT presentations, and company web sites.
Market Size EstimationBoth, top-down and bottom-up approaches were used to estimate and validate the size of the Global market and to estimate the size of various other dependent submarkets in the overall Extra Neutral Alcohol. The key players in the market were identified through secondary research and their market contributions in the respective geographies were determined through primary and secondary research.
Forecast Model