Get Complete Analysis Of The Report - Download Updated Free Sample PDF
The global cloud-based AI chip market refers to specialized processors designed to accelerate artificial intelligence workloads in cloud computing environments. These chips enable faster data processing, machine learning, and deep learning tasks for enterprises, supporting applications such as big data analytics, AI services, and scalable cloud infrastructure across industries worldwide.
The growth of the global cloud-based AI chip market is driven by the rising demand for high-performance computing to support AI and machine learning workloads, rapid adoption of cloud services, and increasing enterprise reliance on big data analytics. Technological advancements in GPUs, ASICs, and FPGAs, coupled with the need for scalable, energy-efficient, and low-latency processing, further accelerate adoption.
The global cloud-based AI chip market is witnessing rapid growth, driven by the rising adoption of AI, machine learning, and deep learning applications in cloud environments. Key trends include increasing deployment of GPUs, FPGAs, and ASICs optimized for AI workloads, along with the integration of AI accelerators in hyperscale data centers. Edge computing adoption is rising alongside cloud AI solutions, creating hybrid architectures. Companies are investing in energy-efficient and high-performance chips to reduce latency and improve scalability.
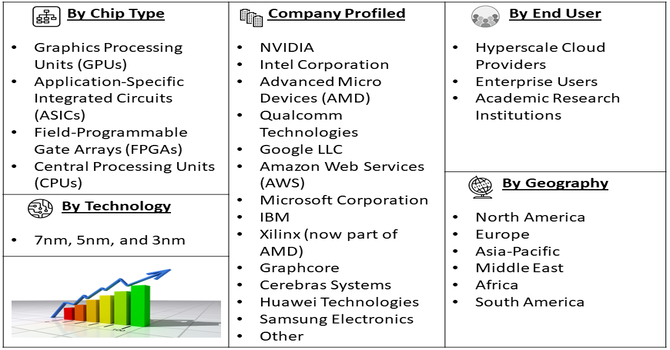
Segmentation: The Global Cloud-based AI Chip Market is segmented by Chip Type (Graphics Processing Units (GPUs), Application-Specific Integrated Circuits (ASICs), Field-Programmable Gate Arrays (FPGAs), and Central Processing Units (CPUs)), Function (AI Training and AI Inference), Technology Node (7nm, 5nm, and 3nm), End-User (Hyperscale Cloud Providers, Enterprise Users, and Academic Research Institutions) and Geography (North America, Europe, Asia-Pacific, Middle East and Africa, and South America). The report provides the value (in USD million) for the above segments.
For Detailed Market Segmentation - Get a Free Sample PDF
Market Drivers:
The primary drivers of the global cloud-based AI chip market is the surging demand for AI and machine learning workloads in cloud environments. Enterprises increasingly rely on AI for predictive analytics, data-driven decision-making, natural language processing, and computer vision applications, which require powerful, high-performance processors. For instance, in 2025, Amazon announced a $15 billion investment in Northern Indiana to build new data center campuses supporting AI and cloud computing. This followed a prior USD 11 billion investment in St. Joseph County. The expansion strengthened cloud infrastructure, boosting demand for high-performance AI chips globally and accelerating growth in the cloud-based AI chip market.
This growing need for scalable, energy-efficient, and reliable AI processing in cloud infrastructure directly fuels market growth, as businesses seek to leverage AI to enhance productivity, innovation, and competitive advantage.
Another key driver is the rapid expansion of hyperscale data centers and the integration of edge computing with cloud AI solutions. Hyperscale facilities require advanced AI chips to process massive datasets in real-time, supporting applications in healthcare, finance, automotive, and industrial automation. For instance, in July 2025, Renesas Electronics launched its 64-bit RZ/G3E microprocessor, featuring a quad-core Arm Cortex-A55 and Neural Processing Unit for high-performance edge AI computing. Optimized for HMI applications across industrial and consumer sectors, it enabled faster local AI processing, Full HD graphics, and high-speed connectivity, indirectly supporting cloud-based AI chip demand by enhancing edge-to-cloud integration globally.
Edge computing adoption reduces latency, optimizes bandwidth, and enables hybrid cloud-architecture deployments, increasing the demand for specialized AI processors that can operate efficiently in distributed environments. This trend strengthens the global cloud-based AI chip market by enabling broader adoption across multiple industry verticals.
Market Restraints:
A significant restraint in the global cloud-based AI chip market is the high cost of advanced AI processors and the complexity of integrating them into existing cloud infrastructures. GPUs, FPGAs, and ASICs capable of handling intensive AI workloads are expensive to manufacture, deploy, and maintain, limiting adoption among small and mid-sized enterprises. Additionally, designing chips that ensure compatibility with diverse cloud architectures, support energy efficiency, and maintain reliability under heavy workloads presents technical challenges. Frequent updates, firmware management, and workload-specific customization further increase operational complexity. Supply chain disruptions and semiconductor shortages can also constrain availability. These factors collectively slow adoption rates and pose barriers to market expansion despite growing demand for cloud-based AI solutions.
Cloud-based AI chips significantly influence socioeconomic growth by enabling faster AI-driven insights, automation, and decision-making across industries. They support advanced healthcare diagnostics, smart manufacturing, autonomous vehicles, and financial analytics, improving productivity and efficiency. Widespread adoption fosters job creation in semiconductor design, AI development, and cloud infrastructure while enhancing technological skills. Moreover, AI-powered cloud solutions improve service accessibility and reduce operational costs for businesses. On a societal level, cloud-based AI chips enable smarter, data-driven solutions that optimize resource utilization, energy efficiency, and sustainability. Collectively, these factors contribute to economic growth and improved quality of life worldwide.
Segmental Analysis:
The GPUs segment is expected to witness the highest growth over the forecast period due to their superior parallel processing capabilities, which are essential for AI, machine learning, and deep learning workloads in cloud environments. GPUs accelerate complex computations required for predictive analytics, natural language processing, and computer vision applications, making them critical for hyperscale data centers and enterprise cloud platforms. Continuous innovation in GPU architecture, including improved energy efficiency and higher core counts, further drives adoption. Additionally, the proliferation of AI-as-a-Service and edge computing solutions has heightened demand for high-performance GPUs, positioning this segment as a key growth driver in the global cloud-based AI chip market.
The 7 nm technology segment is expected to witness the highest growth due to its ability to deliver higher performance, lower power consumption, and greater transistor density in AI chips. This advanced fabrication technology enables GPUs, ASICs, and FPGAs to handle large-scale AI workloads efficiently while reducing operational costs for cloud service providers. As AI applications become more complex, 7 nm chips support faster data processing, lower latency, and improved scalability. Additionally, the trend toward smaller, more efficient process nodes aligns with sustainability goals by reducing energy usage, further boosting adoption and positioning 7 nm technology as a dominant segment in the cloud-based AI chip market.
The hyperscale cloud providers segment is expected to witness the highest growth as leading providers like AWS, Microsoft Azure, and Google Cloud increasingly deploy AI-optimized chips to support large-scale machine learning and AI services. These providers require high-performance, energy-efficient GPUs, ASICs, and FPGAs to process massive datasets, reduce latency, and deliver scalable AI workloads. The growing demand for AI-as-a-Service, real-time analytics, and enterprise digital transformation fuels adoption. Strategic partnerships with AI chip manufacturers and investments in next-generation data center infrastructure further strengthen this segment, positioning hyperscale cloud providers as key drivers of the global cloud-based AI chip market.
The North America region is expected to witness the highest growth due to the presence of leading semiconductor companies, hyperscale cloud providers, and technology innovators. High investments in AI research, autonomous systems, and cloud computing infrastructure drive strong demand for advanced AI chips. For instance, ZEDEDA reported substantial growth in 2024, doubling both revenue and edge nodes under management. The expansion spanned industries such as energy, transportation, manufacturing, retail, and agriculture, reflecting increased enterprise adoption of edge computing. This growth indirectly boosted demand for cloud-based AI chips by enhancing edge-to-cloud AI deployments and accelerating global AI infrastructure expansion.
Government initiatives and industry collaborations promote innovation and early adoption of AI technologies in data centers, automotive, healthcare, and finance sectors. Additionally, North American enterprises increasingly deploy AI-powered cloud solutions to enhance productivity, analytics, and customer experiences. The combination of technological leadership, robust infrastructure, and a strong ecosystem positions North America as a dominant market for cloud-based AI chips over the forecast period.
| Report Matrics | Details |
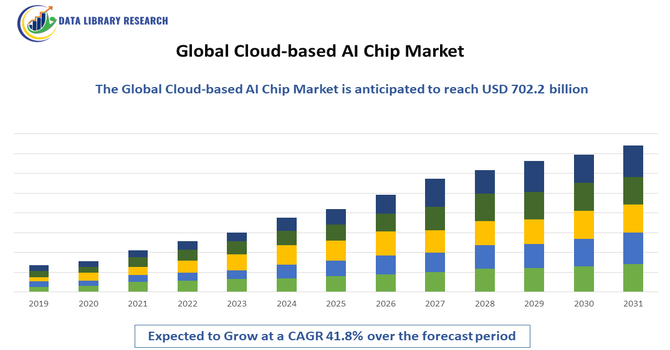
| Market Size Value | USD 702.2 billion |
| Growth Rate | CAGR of 41.8% |
| Forecast | 2026-2033 |
| Historical data | 2021-2024 |
| Base Year | 2025 |
| Report Coverage | Forecasted revenue, company rating, competitive environment, growth drivers, and trends |
| Segment Coverage | Type, Application, End-User, Geography |
| Regional Scope | North America, Europe, Asia Pacific, Middle East |
| Customized scope | Free customization of reports (With 3 months' analysis support) |
| To Learn More About This Report | Request a Free Sample Copy |
The cloud-based AI chip market is highly competitive, dominated by technology and semiconductor giants such as NVIDIA, Intel, AMD, Qualcomm, Xilinx (AMD), and Google (TPU). Companies compete on performance, power efficiency, scalability, and compatibility with cloud platforms. Strategic collaborations with cloud service providers, investments in R&D, and innovations in GPUs, FPGAs, and ASICs drive differentiation. Emerging startups are introducing workload-specific AI accelerators, challenging incumbents and accelerating technological advancements. Market dynamics are shaped by mergers, acquisitions, and licensing agreements, enabling faster product deployment. Continuous improvements in chip architecture, AI processing capabilities, and cost optimization define leadership in this rapidly evolving market.
The major players for this market are:
Recent Development
Q1. What are the main growth-driving factors for this market?
The market is primarily driven by the explosive growth of Generative AI and Large Language Models (LLMs) which demand massive computing power in the cloud. Hyperscale data centers, operated by tech giants like Google and Amazon, constantly upgrade their infrastructure with specialized AI chips for training and running these complex models efficiently. This shift allows businesses to access cutting-edge AI without investing in expensive on-premise hardware.
Q2. What are the main restraining factors for this market?
The high cost associated with manufacturing AI chips on the most advanced semiconductor nodes, such as 5nm and 3nm, significantly restrains the market. Additionally, building and maintaining the infrastructure for these chips requires immense capital for power and cooling solutions in data centers. Furthermore, market concentration, with reliance on just a few global foundries, creates persistent supply chain risks and potential price volatility.
Q3. Which segment is expected to witness high growth?
The AI Training Chips segment, which involves the initial processing of vast datasets to build complex models like GPT-4, is projected to see the highest growth. These systems require the most expensive and powerful chips, like specialized GPUs and custom ASICs. As AI models continue to grow larger and more sophisticated across industries, the need for these high-end training accelerators will continue to drive significant market revenue.
Q4. Who are the top major players for this market?
The cloud AI chip market is currently dominated by NVIDIA Corporation due to its leading GPU technology and strong software ecosystem. Other major players include Intel Corporation and Advanced Micro Devices (AMD). Crucially, major cloud providers like Google (with its TPUs) and Amazon Web Services (with Inferentia) are increasingly designing and deploying their own custom Application-Specific Integrated Circuits (ASICs) to optimize their specific cloud environments.
Q5. Which country is the largest player?
The United States is overwhelmingly the largest player in this market, holding the largest share of revenue and design expertise. This dominance stems from the fact that all major hyperscale cloud providers (Google, Amazon, Microsoft) and the leading AI chip designers (NVIDIA, Intel) are based there. This concentration of R&D and major consumption centers firmly establishes North America as the global market leader.
Data Library Research are conducted by industry experts who offer insight on industry structure, market segmentations technology assessment and competitive landscape (CL), and penetration, as well as on emerging trends. Their analysis is based on primary interviews (~ 80%) and secondary research (~ 20%) as well as years of professional expertise in their respective industries. Adding to this, by analysing historical trends and current market positions, our analysts predict where the market will be headed for the next five years. Furthermore, the varying trends of segment & categories geographically presented are also studied and the estimated based on the primary & secondary research.
In this particular report from the supply side Data Library Research has conducted primary surveys (interviews) with the key level executives (VP, CEO’s, Marketing Director, Business Development Manager and SOFT) of the companies that active & prominent as well as the midsized organization
FIGURE 1: DLR RESEARH PROCESS
Extensive primary research was conducted to gain a deeper insight of the market and industry performance. The analysis is based on both primary and secondary research as well as years of professional expertise in the respective industries.
In addition to analysing current and historical trends, our analysts predict where the market is headed over the next five years.
It varies by segment for these categories geographically presented in the list of market tables. Speaking about this particular report we have conducted primary surveys (interviews) with the key level executives (VP, CEO’s, Marketing Director, Business Development Manager and many more) of the major players active in the market.
Secondary ResearchSecondary research was mainly used to collect and identify information useful for the extensive, technical, market-oriented, and Friend’s study of the Global Extra Neutral Alcohol. It was also used to obtain key information about major players, market classification and segmentation according to the industry trends, geographical markets, and developments related to the market and technology perspectives. For this study, analysts have gathered information from various credible sources, such as annual reports, sec filings, journals, white papers, SOFT presentations, and company web sites.
Market Size EstimationBoth, top-down and bottom-up approaches were used to estimate and validate the size of the Global market and to estimate the size of various other dependent submarkets in the overall Extra Neutral Alcohol. The key players in the market were identified through secondary research and their market contributions in the respective geographies were determined through primary and secondary research.
Forecast Model