Confined Space Equipment Rental Market Overview and Analysis
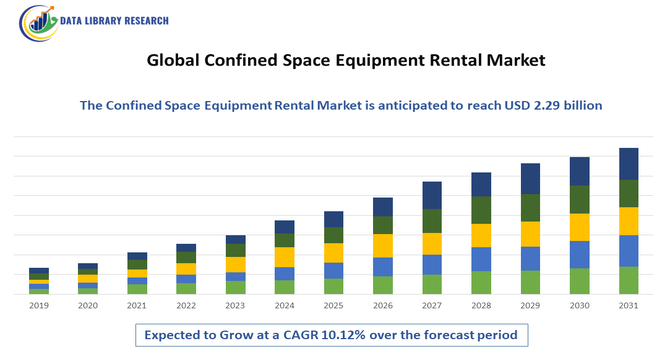
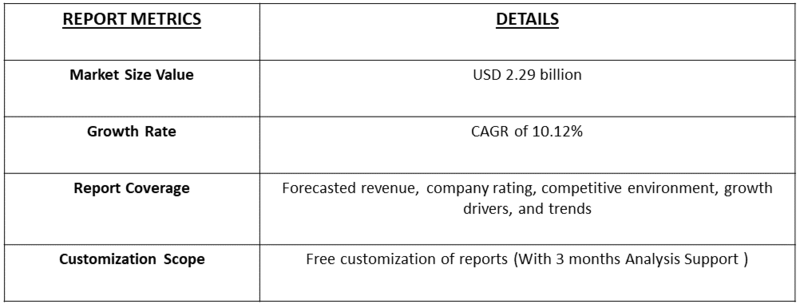
- The Global Confined Space Equipment Rental Market is experiencing steady growth, projected from around USD 1.06 billion in 2025 to USD 2.29 billion by 2032, growing with a CAGR of 10.12% from 2025-2032.
Get Complete Analysis Of The Report - Download Updated Free Sample PDF
The Global Confined Space Equipment Rental Market is experiencing steady growth as industries increasingly prioritize worker safety, regulatory compliance, and cost-effective access to high-performance safety systems. Confined spaces—such as tanks, silos, sewers, pipelines, tunnels, and industrial vessels—require specialized equipment including gas detectors, ventilation systems, communication devices, harnesses, tripods, fall-protection systems, and rescue gear. Instead of purchasing these systems outright, many end users are turning to rental solutions to reduce capital expenditure, ensure access to the latest certified equipment, and address short-term or project-based needs.
Confined Space Equipment Rental Market Latest Trends
The Global Confined Space Equipment Rental Market is witnessing several emerging trends, driven by technological advancements and increasing safety regulation requirements across industries. One of the most prominent trends is the rapid adoption of smart and connected safety solutions, including IoT-enabled gas detectors, real-time air quality monitors, and wearable tracking devices that allow continuous monitoring of worker conditions inside confined spaces. Rental companies are increasingly offering advanced digital communication systems and location-tracking tools that enhance coordination and improve emergency response times.
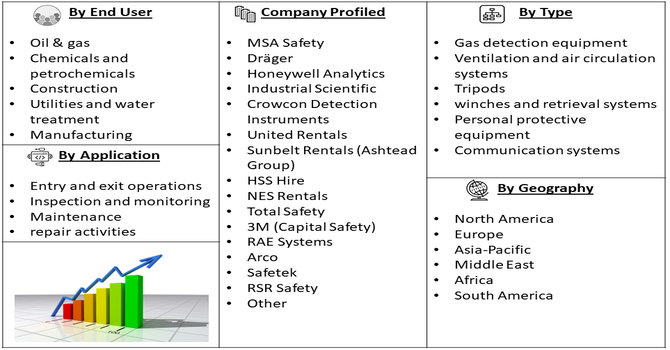
Segmentation: Global Confined Space Equipment Rental Market is segmented By Equipment Type (Gas detection equipment, Ventilation and air circulation systems, Tripods, winches, and retrieval systems, Personal protective equipment, Communication systems), Application (Entry and exit operations, Inspection and monitoring, Maintenance and repair activities), End User (Oil & gas, Chemicals and petrochemicals, Construction, Utilities and water treatment, Manufacturing), and Geography (North America, Europe, Asia-Pacific, Middle East and Africa, and South America). The report provides the value (in USD million) for the above segments.
For Detailed Market Segmentation - Get a Free Sample PDF
Market Drivers:
- Growing Emphasis on Worker Safety and Strict Regulatory Compliance
The strongest drivers of the market is the rising global emphasis on occupational safety, particularly in high-risk industries such as oil & gas, chemicals, utilities, construction, and mining. Confined space activities pose risks related to toxic gas exposure, oxygen deficiency, fire hazards, and limited escape routes. Regulatory bodies such as OSHA, NIOSH, ISO, and regional safety authorities mandate the use of certified confined space entry equipment, including gas detectors, ventilation systems, harnesses, and retrieval devices. Many companies prefer renting equipment to ensure full compliance with evolving safety rules without bearing the cost of ownership and frequent equipment upgrades. As regulatory audits and safety inspections intensify, demand for high-quality rental solutions continues to rise.
- Increasing Industrial Maintenance, Turnaround, and Infrastructure Projects
The growing frequency of industrial maintenance, repair, and overhaul (MRO) activities—especially shutdowns and turnarounds in refineries, chemical plants, and power plants—is significantly boosting rental demand. Confined space equipment is often needed only during specific maintenance intervals, making rental the most cost-efficient option for short-term, project-based operations. Additionally, expanding infrastructure development, urban utilities modernization, and inspection of underground pipelines, tunnels, and storage tanks further fuel the need for temporary safety equipment. As industries continue to expand operational capacity and upgrade aging infrastructure, the requirement for reliable, readily available confined space rental systems grows proportionally, driving strong market growth.
Market Restraints:
- High Cost of Advanced Safety Equipment and Associated Maintenance
Global Confined Space Equipment Rental Market is the high cost of advanced safety equipment and associated maintenance, which can limit adoption among small and medium enterprises. Modern confined space solutions—such as multi-gas detectors, connected monitoring systems, SCBA units, and rescue equipment—require regular calibration, certification, and servicing to meet safety standards. These ongoing maintenance requirements increase rental providers’ operational costs, leading to higher rental prices that may discourage budget-constrained users. Additionally, stringent compliance obligations place pressure on rental companies to maintain large inventories of updated, certified equipment, often resulting in increased overhead and reduced profitability.
Socio Economic Impact on Confined Space Equipment Rental Market
The global confined space equipment rental market has had a meaningful impact on both safety and economic growth. By providing access to specialized safety gear without the high costs of purchasing, businesses in construction, manufacturing, and industrial maintenance could protect workers more effectively, reducing accidents and work-related illnesses. This not only saved lives but also minimized downtime, boosting productivity and profitability. The market also created jobs in equipment rental, maintenance, and logistics, supporting local economies. Thus, the rental model made critical safety solutions more affordable and flexible, helping companies maintain safer workplaces while contributing to broader economic resilience and public health improvements.
Segmental Analysis:
- Gas Detection Equipment segment is expected to witness the highest growth over the forecast period
Gas detection equipment represents one of the most critical rental categories, as confined spaces often contain hazardous environments with risks of toxic gases, oxygen deficiency, and explosive atmospheres. Demand for rented multi-gas detectors is rising because they require constant calibration, certification, and maintenance—making ownership costly for many end users. Rental providers supply advanced, IoT-enabled detectors with real-time monitoring, alarms, and data logging, ensuring compliance with strict safety regulations while reducing downtime during maintenance and turnaround activities.
- Inspection and Monitoring segment is expected to witness the highest growth over the forecast period
Inspection and monitoring activities in confined spaces rely heavily on rented equipment, especially during routine plant audits, structural assessments, and industrial inspections. These projects require temporary tools such as gas analyzers, communication devices, fall protection gear, and portable ventilation systems, making rentals the most economical option. The increasing need for periodic inspections in oil & gas facilities, water treatment plants, refineries, and manufacturing sites is driving the growth of rental solutions tailored for safe and efficient monitoring operations.
- Oil & Gas segment is expected to witness the highest growth over the forecast period
The oil & gas sector is one of the largest end users of confined space rental equipment due to frequent maintenance, shutdowns, and turnaround operations involving tanks, vessels, pipelines, and storage units. The industry’s strict adherence to OSHA and ISO safety standards creates strong demand for certified rented gas detectors, rescue systems, breathing apparatus, and communication tools. Moreover, the sector’s preference for short-term, project-based equipment usage makes rental services a cost-effective and flexible solution, further strengthening market growth.
- North America segment is expected to witness the highest growth over the forecast period
North America dominates the market and continues to show robust growth, driven by high investments in industrial maintenance, strong regulatory enforcement, and widespread adoption of advanced safety technologies.
The region’s oil & gas, utilities, manufacturing, and chemical industries frequently use confined space rental equipment to meet stringent safety compliance requirements. Additionally, the presence of major rental service providers and rapid adoption of connected safety devices accelerate market expansion across the United States and Canada. For instance, in September 2025, Sunbelt Rentals’ role as the equipment provider for the LA28 Olympics boosted its profile across North America and underscored its capacity to support large, complex projects. By supplying HVAC, scaffolding, and other critical rental equipment, it highlighted how essential rental firms are in meeting strict safety needs—driving demand in the North American confined space equipment rental market by reinforcing the value of safety-focused, temporary infrastructure solutions.
Thus, such factors are driving the market’s growth in the above region.
To Learn More About This Report - Request a Free Sample Copy
Confined Space Equipment Rental Market Competitive Landscape
The competitive landscape of the Global Confined Space Equipment Rental Market is fragmented and competitive, comprising specialist safety-equipment manufacturers that offer rental/lease programs, dedicated rental service providers, regional rental companies, and integrated safety-service firms. Market players compete on equipment quality and certification, speed of deployment, fleet breadth (gas detectors, ventilation systems, retrieval/rescue gear, communication devices), training and support services, IoT/connected-device capabilities, and regulatory-compliant maintenance/calibration programs. Consolidation through strategic partnerships and acquisitions, plus investments in digitally enabled monitoring and turnkey safety solutions, are common strategies used to win large industrial and infrastructure contracts.
Key Player:
- MSA Safety
- Dräger
- Honeywell Analytics
- Industrial Scientific
- Crowcon Detection Instruments
- United Rentals
- Sunbelt Rentals (Ashtead Group)
- HSS Hire
- NES Rentals
- Total Safety
- 3M (Capital Safety)
- RAE Systems
- Arco
- Safetek
- RSR Safety
- Rentokil Initial (safety services division)
- Tencate Grass? (TenCate Protective Fabrics)
- Safety Services Company (SSC)
- Altair Safety
- Rescuetech Systems
Recent Development
- In 2025, United Rentals launched an enhanced Confined Space Safety Training for Competent Persons program in advance Confined Space Safety Week. The updated course trained contractors and utility workers to better spot confined space hazards, covering ventilation, gas detection, rescue planning, and more. Delivered via United Academy in person, virtually, or as e learning, it reinforced United Rentals’ commitment to safer worksites.
- In January 2025, Panasonic launched its OASYS Residential Central Air Conditioning System in the U.S. The system combined a mini split AC, an energy recovery ventilator (ERV), and DC motor driven transfer fans. By doing so, it cut heating and cooling energy use by over 50%, while providing even airflow, purified air, and whisper quiet operation.
Frequently Asked Questions (FAQ) :
Q1. What are the main growth-driving factors for this market?
The primary driver is the strict enforcement of workplace safety regulations (like OSHA standards) that mandate specialized equipment for confined space entry. Growth is also fueled by the increasing volume of infrastructure maintenance (sewer systems, utilities, oil tanks) requiring temporary access. Renting is preferred because it offers cost-effective compliance and flexibility, allowing companies to secure the exact gear needed for short, specialized projects.
Q2. What are the main restraining factors for this market?
A key constraint is the high technical complexity and cost of maintaining and calibrating the equipment, particularly gas detectors and ventilation systems. The market also struggles with user error and lack of proper training, which can lead to equipment damage or safety incidents, increasing liability for rental providers. Furthermore, the logistical challenge of delivering complex rescue systems quickly to remote or emergency locations can slow down service.
Q3. Which segment is expected to witness high growth?
The Gas Detection and Monitoring Segment is projected to witness the highest growth. This gear, including multi-gas detectors and atmospheric monitors, is non-negotiable for safe entry into confined spaces. Because gas monitors require frequent and precise calibration, companies prefer the reliability of renting freshly certified units over the burden of maintaining and calibrating their own fleet, ensuring consistent demand in the rental market.
Q4. Who are the top major players for this market?
The market is dominated by large, diversified equipment rental giants and specialist safety suppliers. Top major players include United Rentals, Inc., Ashtead Group PLC (Sunbelt Rentals), Honeywell International Inc., and MSA Safety Inc. Competition centers on offering a complete, certified safety package that includes respiratory gear, gas detection, fall protection, and rescue tripods, alongside integrated technical support and certified training for rapid deployment.
Q5. Which country is the largest player?
The United States is the largest country player. This dominance is driven by its massive industrial and municipal infrastructure, which constantly requires maintenance in confined spaces (utilities, chemical plants, wastewater). Most importantly, the stringent OSHA regulations create a high, non-negotiable demand for certified, frequently inspected equipment, ensuring large-scale and consistent rental revenue across the country's major industrial hubs.
List of Figures
Figure 1: Global Confined Space Equipment Rental Market Revenue Breakdown (USD Billion, %) by Region, 2022 & 2029
Figure 2: Global Confined Space Equipment Rental Market Value Share (%), By Segment 1, 2022 & 2029
Figure 3: Global Confined Space Equipment Rental Market Forecast (USD Billion), by Sub-Segment 1, 2018-2029
Figure 4: Global Confined Space Equipment Rental Market Forecast (USD Billion), by Sub-Segment 2, 2018-2029
Figure 5: Global Confined Space Equipment Rental Market Value Share (%), By Segment 2, 2022 & 2029
Figure 6: Global Confined Space Equipment Rental Market Forecast (USD Billion), by Sub-Segment 1, 2018-2029
Figure 7: Global Confined Space Equipment Rental Market Forecast (USD Billion), by Sub-Segment 2, 2018-2029
Figure 8: Global Confined Space Equipment Rental Market Forecast (USD Billion), by Sub-Segment 3, 2018-2029
Figure 9: Global Confined Space Equipment Rental Market Forecast (USD Billion), by Others, 2018-2029
Figure 10: Global Confined Space Equipment Rental Market Value Share (%), By Segment 3, 2022 & 2029
Figure 11: Global Confined Space Equipment Rental Market Forecast (USD Billion), by Sub-Segment 1, 2018-2029
Figure 12: Global Confined Space Equipment Rental Market Forecast (USD Billion), by Sub-Segment 2, 2018-2029
Figure 13: Global Confined Space Equipment Rental Market Forecast (USD Billion), by Sub-Segment 3, 2018-2029
Figure 14: Global Confined Space Equipment Rental Market Forecast (USD Billion), by Others, 2018-2029
Figure 15: Global Confined Space Equipment Rental Market Value (USD Billion), by Region, 2022 & 2029
Figure 16: North America Confined Space Equipment Rental Market Value Share (%), By Segment 1, 2022 & 2029
Figure 17: North America Confined Space Equipment Rental Market Forecast (USD Billion), by Sub-Segment 1, 2018-2029
Figure 18: North America Confined Space Equipment Rental Market Forecast (USD Billion), by Sub-Segment 2, 2018-2029
Figure 19: North America Confined Space Equipment Rental Market Value Share (%), By Segment 2, 2022 & 2029
Figure 20: North America Confined Space Equipment Rental Market Forecast (USD Billion), by Sub-Segment 1, 2018-2029
Figure 21: North America Confined Space Equipment Rental Market Forecast (USD Billion), by Sub-Segment 2, 2018-2029
Figure 22: North America Confined Space Equipment Rental Market Forecast (USD Billion), by Sub-Segment 3, 2018-2029
Figure 23: North America Confined Space Equipment Rental Market Forecast (USD Billion), by Others, 2018-2029
Figure 24: North America Confined Space Equipment Rental Market Value Share (%), By Segment 3, 2022 & 2029
Figure 25: North America Confined Space Equipment Rental Market Forecast (USD Billion), by Sub-Segment 1, 2018-2029
Figure 26: North America Confined Space Equipment Rental Market Forecast (USD Billion), by Sub-Segment 2, 2018-2029
Figure 27: North America Confined Space Equipment Rental Market Forecast (USD Billion), by Sub-Segment 3, 2018-2029
Figure 28: North America Confined Space Equipment Rental Market Forecast (USD Billion), by Others, 2018-2029
Figure 29: North America Confined Space Equipment Rental Market Forecast (USD Billion), by U.S., 2018-2029
Figure 30: North America Confined Space Equipment Rental Market Forecast (USD Billion), by Canada, 2018-2029
Figure 31: Latin America Confined Space Equipment Rental Market Value Share (%), By Segment 1, 2022 & 2029
Figure 32: Latin America Confined Space Equipment Rental Market Forecast (USD Billion), by Sub-Segment 1, 2018-2029
Figure 33: Latin America Confined Space Equipment Rental Market Forecast (USD Billion), by Sub-Segment 2, 2018-2029
Figure 34: Latin America Confined Space Equipment Rental Market Value Share (%), By Segment 2, 2022 & 2029
Figure 35: Latin America Confined Space Equipment Rental Market Forecast (USD Billion), by Sub-Segment 1, 2018-2029
Figure 36: Latin America Confined Space Equipment Rental Market Forecast (USD Billion), by Sub-Segment 2, 2018-2029
Figure 37: Latin America Confined Space Equipment Rental Market Forecast (USD Billion), by Sub-Segment 3, 2018-2029
Figure 38: Latin America Confined Space Equipment Rental Market Forecast (USD Billion), by Others, 2018-2029
Figure 39: Latin America Confined Space Equipment Rental Market Value Share (%), By Segment 3, 2022 & 2029
Figure 40: Latin America Confined Space Equipment Rental Market Forecast (USD Billion), by Sub-Segment 1, 2018-2029
Figure 41: Latin America Confined Space Equipment Rental Market Forecast (USD Billion), by Sub-Segment 2, 2018-2029
Figure 42: Latin America Confined Space Equipment Rental Market Forecast (USD Billion), by Sub-Segment 3, 2018-2029
Figure 43: Latin America Confined Space Equipment Rental Market Forecast (USD Billion), by Others, 2018-2029
Figure 44: Latin America Confined Space Equipment Rental Market Forecast (USD Billion), by Brazil, 2018-2029
Figure 45: Latin America Confined Space Equipment Rental Market Forecast (USD Billion), by Mexico, 2018-2029
Figure 46: Latin America Confined Space Equipment Rental Market Forecast (USD Billion), by Rest of Latin America, 2018-2029
Figure 47: Europe Confined Space Equipment Rental Market Value Share (%), By Segment 1, 2022 & 2029
Figure 48: Europe Confined Space Equipment Rental Market Forecast (USD Billion), by Sub-Segment 1, 2018-2029
Figure 49: Europe Confined Space Equipment Rental Market Forecast (USD Billion), by Sub-Segment 2, 2018-2029
Figure 50: Europe Confined Space Equipment Rental Market Value Share (%), By Segment 2, 2022 & 2029
Figure 51: Europe Confined Space Equipment Rental Market Forecast (USD Billion), by Sub-Segment 1, 2018-2029
Figure 52: Europe Confined Space Equipment Rental Market Forecast (USD Billion), by Sub-Segment 2, 2018-2029
Figure 53: Europe Confined Space Equipment Rental Market Forecast (USD Billion), by Sub-Segment 3, 2018-2029
Figure 54: Europe Confined Space Equipment Rental Market Forecast (USD Billion), by Others, 2018-2029
Figure 55: Europe Confined Space Equipment Rental Market Value Share (%), By Segment 3, 2022 & 2029
Figure 56: Europe Confined Space Equipment Rental Market Forecast (USD Billion), by Sub-Segment 1, 2018-2029
Figure 57: Europe Confined Space Equipment Rental Market Forecast (USD Billion), by Sub-Segment 2, 2018-2029
Figure 58: Europe Confined Space Equipment Rental Market Forecast (USD Billion), by Sub-Segment 3, 2018-2029
Figure 59: Europe Confined Space Equipment Rental Market Forecast (USD Billion), by Others, 2018-2029
Figure 60: Europe Confined Space Equipment Rental Market Forecast (USD Billion), by U.K., 2018-2029
Figure 61: Europe Confined Space Equipment Rental Market Forecast (USD Billion), by Germany, 2018-2029
Figure 62: Europe Confined Space Equipment Rental Market Forecast (USD Billion), by France, 2018-2029
Figure 63: Europe Confined Space Equipment Rental Market Forecast (USD Billion), by Italy, 2018-2029
Figure 64: Europe Confined Space Equipment Rental Market Forecast (USD Billion), by Spain, 2018-2029
Figure 65: Europe Confined Space Equipment Rental Market Forecast (USD Billion), by Russia, 2018-2029
Figure 66: Europe Confined Space Equipment Rental Market Forecast (USD Billion), by Rest of Europe, 2018-2029
Figure 67: Asia Pacific Confined Space Equipment Rental Market Value Share (%), By Segment 1, 2022 & 2029
Figure 68: Asia Pacific Confined Space Equipment Rental Market Forecast (USD Billion), by Sub-Segment 1, 2018-2029
Figure 69: Asia Pacific Confined Space Equipment Rental Market Forecast (USD Billion), by Sub-Segment 2, 2018-2029
Figure 70: Asia Pacific Confined Space Equipment Rental Market Value Share (%), By Segment 2, 2022 & 2029
Figure 71: Asia Pacific Confined Space Equipment Rental Market Forecast (USD Billion), by Sub-Segment 1, 2018-2029
Figure 72: Asia Pacific Confined Space Equipment Rental Market Forecast (USD Billion), by Sub-Segment 2, 2018-2029
Figure 73: Asia Pacific Confined Space Equipment Rental Market Forecast (USD Billion), by Sub-Segment 3, 2018-2029
Figure 74: Asia Pacific Confined Space Equipment Rental Market Forecast (USD Billion), by Others, 2018-2029
Figure 75: Asia Pacific Confined Space Equipment Rental Market Value Share (%), By Segment 3, 2022 & 2029
Figure 76: Asia Pacific Confined Space Equipment Rental Market Forecast (USD Billion), by Sub-Segment 1, 2018-2029
Figure 77: Asia Pacific Confined Space Equipment Rental Market Forecast (USD Billion), by Sub-Segment 2, 2018-2029
Figure 78: Asia Pacific Confined Space Equipment Rental Market Forecast (USD Billion), by Sub-Segment 3, 2018-2029
Figure 79: Asia Pacific Confined Space Equipment Rental Market Forecast (USD Billion), by Others, 2018-2029
Figure 80: Asia Pacific Confined Space Equipment Rental Market Forecast (USD Billion), by China, 2018-2029
Figure 81: Asia Pacific Confined Space Equipment Rental Market Forecast (USD Billion), by India, 2018-2029
Figure 82: Asia Pacific Confined Space Equipment Rental Market Forecast (USD Billion), by Japan, 2018-2029
Figure 83: Asia Pacific Confined Space Equipment Rental Market Forecast (USD Billion), by Australia, 2018-2029
Figure 84: Asia Pacific Confined Space Equipment Rental Market Forecast (USD Billion), by Southeast Asia, 2018-2029
Figure 85: Asia Pacific Confined Space Equipment Rental Market Forecast (USD Billion), by Rest of Asia Pacific, 2018-2029
Figure 86: Middle East & Africa Confined Space Equipment Rental Market Value Share (%), By Segment 1, 2022 & 2029
Figure 87: Middle East & Africa Confined Space Equipment Rental Market Forecast (USD Billion), by Sub-Segment 1, 2018-2029
Figure 88: Middle East & Africa Confined Space Equipment Rental Market Forecast (USD Billion), by Sub-Segment 2, 2018-2029
Figure 89: Middle East & Africa Confined Space Equipment Rental Market Value Share (%), By Segment 2, 2022 & 2029
Figure 90: Middle East & Africa Confined Space Equipment Rental Market Forecast (USD Billion), by Sub-Segment 1, 2018-2029
Figure 91: Middle East & Africa Confined Space Equipment Rental Market Forecast (USD Billion), by Sub-Segment 2, 2018-2029
Figure 92: Middle East & Africa Confined Space Equipment Rental Market Forecast (USD Billion), by Sub-Segment 3, 2018-2029
Figure 93: Middle East & Africa Confined Space Equipment Rental Market Forecast (USD Billion), by Others, 2018-2029
Figure 94: Middle East & Africa Confined Space Equipment Rental Market Value Share (%), By Segment 3, 2022 & 2029
Figure 95: Middle East & Africa Confined Space Equipment Rental Market Forecast (USD Billion), by Sub-Segment 1, 2018-2029
Figure 96: Middle East & Africa Confined Space Equipment Rental Market Forecast (USD Billion), by Sub-Segment 2, 2018-2029
Figure 97: Middle East & Africa Confined Space Equipment Rental Market Forecast (USD Billion), by Sub-Segment 3, 2018-2029
Figure 98: Middle East & Africa Confined Space Equipment Rental Market Forecast (USD Billion), by Others, 2018-2029
Figure 99: Middle East & Africa Confined Space Equipment Rental Market Forecast (USD Billion), by GCC, 2018-2029
Figure 100: Middle East & Africa Confined Space Equipment Rental Market Forecast (USD Billion), by South Africa, 2018-2029
Figure 101: Middle East & Africa Confined Space Equipment Rental Market Forecast (USD Billion), by Rest of Middle East & Africa, 2018-2029
List of Tables
Table 1: Global Confined Space Equipment Rental Market Revenue (USD Billion) Forecast, by Segment 1, 2018-2029
Table 2: Global Confined Space Equipment Rental Market Revenue (USD Billion) Forecast, by Segment 2, 2018-2029
Table 3: Global Confined Space Equipment Rental Market Revenue (USD Billion) Forecast, by Segment 3, 2018-2029
Table 4: Global Confined Space Equipment Rental Market Revenue (USD Billion) Forecast, by Region, 2018-2029
Table 5: North America Confined Space Equipment Rental Market Revenue (USD Billion) Forecast, by Segment 1, 2018-2029
Table 6: North America Confined Space Equipment Rental Market Revenue (USD Billion) Forecast, by Segment 2, 2018-2029
Table 7: North America Confined Space Equipment Rental Market Revenue (USD Billion) Forecast, by Segment 3, 2018-2029
Table 8: North America Confined Space Equipment Rental Market Revenue (USD Billion) Forecast, by Country, 2018-2029
Table 9: Europe Confined Space Equipment Rental Market Revenue (USD Billion) Forecast, by Segment 1, 2018-2029
Table 10: Europe Confined Space Equipment Rental Market Revenue (USD Billion) Forecast, by Segment 2, 2018-2029
Table 11: Europe Confined Space Equipment Rental Market Revenue (USD Billion) Forecast, by Segment 3, 2018-2029
Table 12: Europe Confined Space Equipment Rental Market Revenue (USD Billion) Forecast, by Country, 2018-2029
Table 13: Latin America Confined Space Equipment Rental Market Revenue (USD Billion) Forecast, by Segment 1, 2018-2029
Table 14: Latin America Confined Space Equipment Rental Market Revenue (USD Billion) Forecast, by Segment 2, 2018-2029
Table 15: Latin America Confined Space Equipment Rental Market Revenue (USD Billion) Forecast, by Segment 3, 2018-2029
Table 16: Latin America Confined Space Equipment Rental Market Revenue (USD Billion) Forecast, by Country, 2018-2029
Table 17: Asia Pacific Confined Space Equipment Rental Market Revenue (USD Billion) Forecast, by Segment 1, 2018-2029
Table 18: Asia Pacific Confined Space Equipment Rental Market Revenue (USD Billion) Forecast, by Segment 2, 2018-2029
Table 19: Asia Pacific Confined Space Equipment Rental Market Revenue (USD Billion) Forecast, by Segment 3, 2018-2029
Table 20: Asia Pacific Confined Space Equipment Rental Market Revenue (USD Billion) Forecast, by Country, 2018-2029
Table 21: Middle East & Africa Confined Space Equipment Rental Market Revenue (USD Billion) Forecast, by Segment 1, 2018-2029
Table 22: Middle East & Africa Confined Space Equipment Rental Market Revenue (USD Billion) Forecast, by Segment 2, 2018-2029
Table 23: Middle East & Africa Confined Space Equipment Rental Market Revenue (USD Billion) Forecast, by Segment 3, 2018-2029
Table 24: Middle East & Africa Confined Space Equipment Rental Market Revenue (USD Billion) Forecast, by Country, 2018-2029
Research Process
Data Library Research are conducted by industry experts who offer insight on
industry structure, market segmentations technology assessment and competitive landscape (CL), and penetration, as well as on emerging trends. Their analysis is based on primary interviews (~ 80%) and secondary research (~ 20%) as well as years of professional expertise in their respective industries. Adding to this, by analysing historical trends and current market positions, our analysts predict where the market will be headed for the next five years. Furthermore, the varying trends of segment & categories geographically presented are also studied and the estimated based on the primary & secondary research.
In this particular report from the supply side Data Library Research has conducted primary surveys (interviews) with the key level executives (VP, CEO’s, Marketing Director, Business Development Manager
and SOFT) of the companies that active & prominent as well as the midsized organization
FIGURE 1: DLR RESEARH PROCESS
![research-methodology1]()
Primary Research
Extensive primary research was conducted to gain a deeper insight of the market and industry performance. The analysis is based on both primary and secondary research as well as years of professional expertise in the respective industries.
In addition to analysing current and historical trends, our analysts predict where the market is headed over the next five years.
It varies by segment for these categories geographically presented in the list of market tables. Speaking about this particular report we have conducted primary surveys (interviews) with the key level executives (VP, CEO’s, Marketing Director, Business Development Manager and many more) of the major players active in the market.
Secondary Research
Secondary research was mainly used to collect and identify information useful for the extensive, technical, market-oriented, and Friend’s study of the Global Extra Neutral Alcohol. It was also used to obtain key information about major players, market classification and segmentation according to the industry trends, geographical markets, and developments related to the market and technology perspectives. For this study, analysts have gathered information from various credible sources, such as annual reports, sec filings, journals, white papers, SOFT presentations, and company web sites.
Market Size Estimation
Both, top-down and bottom-up approaches were used to estimate and validate the size of the Global market and to estimate the size of various other dependent submarkets in the overall Extra Neutral Alcohol. The key players in the market were identified through secondary research and their market contributions in the respective geographies were determined through primary and secondary research.
Forecast Model
![research-methodology2]()