Digital OOH Market Overview
Though OOH (out of home) advertising has been utilized for a long time, it has become increasingly popular in recent years because of the increased acceptance of digital outdoor advertising. Because digital OOH is larger than life and may come in a variety of shapes, sizes, and formats, it has a big impact. It can target clients based on their activity, geography, demographics, and day-part. All of these factors are boosting their adoption around the world and driving the digital out-of-home market. The customer-focused aspect of this type of advertising, as well as innovation and media fluency, are expected to continue to propel the global digital OOH market's growth prospects.
Additionally, when clients of all demographics are out doing any of their out of house activities, digital OOH media may transmit a brand's message to them on a continuous basis. The demand for digital OOH is growing as more businesses realize the need of expanding their marketing tactics outside of the office. Furthermore, technical improvements have resulted in inventive changes in the sort of digital screen utilized for advertising, making these forms of advertising more interactive and engaging.
On the other hand, the high initial cost of installing digital signage is a major roadblock to the DOOH market's growth. Furthermore, the return on investment of such campaigns is difficult to evaluate, and it becomes even more complicated when the expenses of screen repair and maintenance are factored in.
| Report Metric |
Details |
| Market size available for years |
2023–2030 |
| Base year considered |
2023 |
| Forecast period |
2024–2030 |
| Forecast unit |
Value (USD Million) |
| Segments covered |
format Type, End User, and Region. |
| Regions covered |
North America (the U.S. and Canada), Europe (UK, Germany, France, Italy, Spain, Russia, Rest of Europe), Asia-Pacific (China, India, Japan, Australia, South East Asia, Rest of Asia Pacific), Latin America and the Middle East and Africa (Brazil, Saudi Arabia, UAE, Rest of LAMEA) |
| Companies covered |
Broadsign, Scala – Digital Signage Software, Ayuda Media Systems, Signagelive Limited, Net Display Systems, ONELAN Limited, YCD Multimedia, Four Winds Interactive, ADFLOW Networks, DISE International AB, Omnivex Corporation and Navori digital signage software. |
Covid-19 Impact on Digital OOH Market
Like many other industries, COVID-19 badly knocked the electronic and semiconductor industries. This unprecedented event has impacted nearly 230 countries in just a few weeks, resulting in the forced shutdown of manufacturing and transportation activities within and across the countries. This has directly affected the overall sector's growth. It is estimated that COVID-19 to leave more than USD 30 billion impacts on the electronics and semiconductor industry. The sector is majorly affected due to transport restrictions on major electronics and semiconductor raw material providers. However, the emerging need for semiconductors in several industries will offer rapid market recovery over the future period.
Digital OOH Market Segment Overview
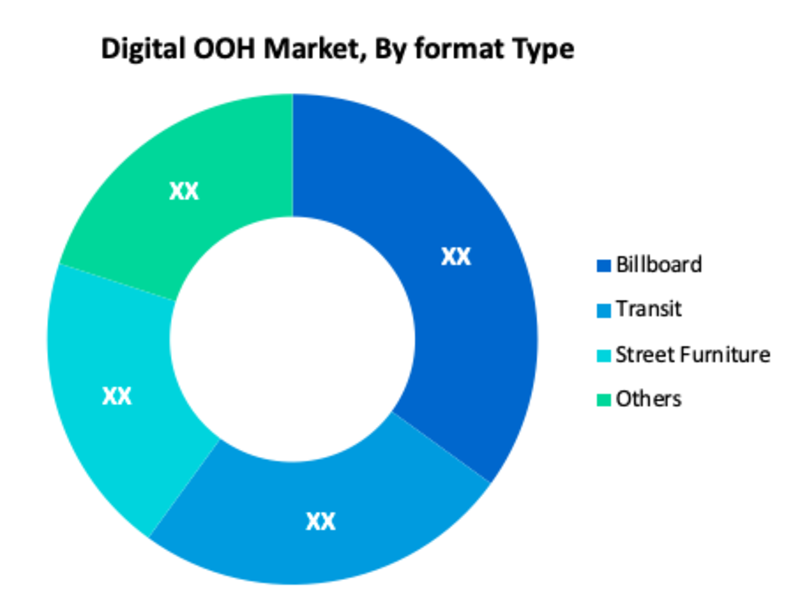
By format Type, Billboard is an important segment of the global Digital OOH Market. Traditional billboards and digital billboards are both available. Bus shelters, mall kiosks, telephone booth advertising, and news racks are all examples of street furniture. Electronic advertising at bus stops, railway stations, and airports, as well as advertising on buses, taxis, aeroplanes, and subways, are all examples of transit advertising.
Digital OOH Market, By format Type
· Billboard
· Transit
· Street Furniture
· Others
Digital OOH Market, By End User
· Automotive
· Personal Care & Households
· Entertainment
· Retail
· Food & Beverages
· Telecom
· BFSI
· Others
Digital OOH Regional Overview
In terms of geography, the global Digital OOH Market is classified into North America, Europe, Asia Pacific, South America, Middle East & Africa. During the projected period, North America is expected to hold the highest market and dominate the Digital Out of Home Market. North America, being the most technologically advanced continent, is a market leader in providing cutting-edge technology for the advertising industry. North America is a pioneer in the development of new display technology, and there is a constant awareness of the advantages of commercial displays in the region.
Digital OOH Market, By Geography
· North America (US & Canada)
· Europe (UK, Germany, France, Italy, Spain, Russia & Rest of Europe)
· Asia-Pacific (Japan, China, India, Australia, & South Korea, & Rest of Asia-Pacific)
· LAMEA (Brazil, Saudi Arabia, UAE & Rest of LAMEA)
Digital OOH Market, Key Players
· Broadsign
· Scala – Digital Signage Software
· Ayuda Media Systems
· Signagelive Limited
· Net Display Systems
· ONELAN Limited
· YCD Multimedia
· Four Winds Interactive
· ADFLOW Networks
· DISE International AB
· Omnivex Corporation
· Navori digital signage software
Frequently Asked Questions (FAQ) :
Q1. What are the driving factors for the global Digital OOH market?
Digital OOH is larger than life and may come in a variety of shapes, sizes, and formats, it has a big impact. It can target clients based on their activity, geography, demographics, and day-part. All of these factors are boosting their adoption around the world and driving the digital out-of-home market
Q2. What are the restraining factors for the global Digital OOH market?
The high initial cost of installing digital signage is a major roadblock to the DOOH market's growth
Q3. Which segment is projected to hold the largest share in the global Digital OOH market?
The billboard segment is projected to hold the largest share in the global Digital OOH market
Q4. Which region holds the largest share in the global Digital OOH market?
North America holds the largest share in the global Digital OOH market
Q5. Which are the prominent players in the global Digital OOH market?
Broadsign, Scala – Digital Signage Software, Ayuda Media Systems, Signagelive Limited, Net Display Systems, ONELAN Limited, YCD Multimedia, Four Winds Interactive, ADFLOW Networks, DISE International AB, Omnivex Corporation and Navori digital signage software. are some key players in the global Digital OOH market.
List of Figures
Figure 1: Global Digital-Out-Of-Home (DOOH) Market Revenue Breakdown (USD Billion, %) by Region, 2019 & 2027
Figure 2: Global Digital-Out-Of-Home (DOOH) Market Value Share (%), By Segment 1, 2019 & 2027
Figure 3: Global Digital-Out-Of-Home (DOOH) Market Forecast (USD Billion), by Sub-Segment 1, 2016-2027
Figure 4: Global Digital-Out-Of-Home (DOOH) Market Forecast (USD Billion), by Sub-Segment 2, 2016-2027
Figure 5: Global Digital-Out-Of-Home (DOOH) Market Value Share (%), By Segment 2, 2019 & 2027
Figure 6: Global Digital-Out-Of-Home (DOOH) Market Forecast (USD Billion), by Sub-Segment 1, 2016-2027
Figure 7: Global Digital-Out-Of-Home (DOOH) Market Forecast (USD Billion), by Sub-Segment 2, 2016-2027
Figure 8: Global Digital-Out-Of-Home (DOOH) Market Forecast (USD Billion), by Sub-Segment 3, 2016-2027
Figure 9: Global Digital-Out-Of-Home (DOOH) Market Forecast (USD Billion), by Others, 2016-2027
Figure 10: Global Digital-Out-Of-Home (DOOH) Market Value Share (%), By Segment 3, 2019 & 2027
Figure 11: Global Digital-Out-Of-Home (DOOH) Market Forecast (USD Billion), by Sub-Segment 1, 2016-2027
Figure 12: Global Digital-Out-Of-Home (DOOH) Market Forecast (USD Billion), by Sub-Segment 2, 2016-2027
Figure 13: Global Digital-Out-Of-Home (DOOH) Market Forecast (USD Billion), by Sub-Segment 3, 2016-2027
Figure 14: Global Digital-Out-Of-Home (DOOH) Market Forecast (USD Billion), by Others, 2016-2027
Figure 15: Global Digital-Out-Of-Home (DOOH) Market Value (USD Billion), by Region, 2019 & 2027
Figure 16: North America Digital-Out-Of-Home (DOOH) Market Value Share (%), By Segment 1, 2019 & 2027
Figure 17: North America Digital-Out-Of-Home (DOOH) Market Forecast (USD Billion), by Sub-Segment 1, 2016-2027
Figure 18: North America Digital-Out-Of-Home (DOOH) Market Forecast (USD Billion), by Sub-Segment 2, 2016-2027
Figure 19: North America Digital-Out-Of-Home (DOOH) Market Value Share (%), By Segment 2, 2019 & 2027
Figure 20: North America Digital-Out-Of-Home (DOOH) Market Forecast (USD Billion), by Sub-Segment 1, 2016-2027
Figure 21: North America Digital-Out-Of-Home (DOOH) Market Forecast (USD Billion), by Sub-Segment 2, 2016-2027
Figure 22: North America Digital-Out-Of-Home (DOOH) Market Forecast (USD Billion), by Sub-Segment 3, 2016-2027
Figure 23: North America Digital-Out-Of-Home (DOOH) Market Forecast (USD Billion), by Others, 2016-2027
Figure 24: North America Digital-Out-Of-Home (DOOH) Market Value Share (%), By Segment 3, 2019 & 2027
Figure 25: North America Digital-Out-Of-Home (DOOH) Market Forecast (USD Billion), by Sub-Segment 1, 2016-2027
Figure 26: North America Digital-Out-Of-Home (DOOH) Market Forecast (USD Billion), by Sub-Segment 2, 2016-2027
Figure 27: North America Digital-Out-Of-Home (DOOH) Market Forecast (USD Billion), by Sub-Segment 3, 2016-2027
Figure 28: North America Digital-Out-Of-Home (DOOH) Market Forecast (USD Billion), by Others, 2016-2027
Figure 29: North America Digital-Out-Of-Home (DOOH) Market Forecast (USD Billion), by U.S., 2016-2027
Figure 30: North America Digital-Out-Of-Home (DOOH) Market Forecast (USD Billion), by Canada, 2016-2027
Figure 31: Latin America Digital-Out-Of-Home (DOOH) Market Value Share (%), By Segment 1, 2019 & 2027
Figure 32: Latin America Digital-Out-Of-Home (DOOH) Market Forecast (USD Billion), by Sub-Segment 1, 2016-2027
Figure 33: Latin America Digital-Out-Of-Home (DOOH) Market Forecast (USD Billion), by Sub-Segment 2, 2016-2027
Figure 34: Latin America Digital-Out-Of-Home (DOOH) Market Value Share (%), By Segment 2, 2019 & 2027
Figure 35: Latin America Digital-Out-Of-Home (DOOH) Market Forecast (USD Billion), by Sub-Segment 1, 2016-2027
Figure 36: Latin America Digital-Out-Of-Home (DOOH) Market Forecast (USD Billion), by Sub-Segment 2, 2016-2027
Figure 37: Latin America Digital-Out-Of-Home (DOOH) Market Forecast (USD Billion), by Sub-Segment 3, 2016-2027
Figure 38: Latin America Digital-Out-Of-Home (DOOH) Market Forecast (USD Billion), by Others, 2016-2027
Figure 39: Latin America Digital-Out-Of-Home (DOOH) Market Value Share (%), By Segment 3, 2019 & 2027
Figure 40: Latin America Digital-Out-Of-Home (DOOH) Market Forecast (USD Billion), by Sub-Segment 1, 2016-2027
Figure 41: Latin America Digital-Out-Of-Home (DOOH) Market Forecast (USD Billion), by Sub-Segment 2, 2016-2027
Figure 42: Latin America Digital-Out-Of-Home (DOOH) Market Forecast (USD Billion), by Sub-Segment 3, 2016-2027
Figure 43: Latin America Digital-Out-Of-Home (DOOH) Market Forecast (USD Billion), by Others, 2016-2027
Figure 44: Latin America Digital-Out-Of-Home (DOOH) Market Forecast (USD Billion), by Brazil, 2016-2027
Figure 45: Latin America Digital-Out-Of-Home (DOOH) Market Forecast (USD Billion), by Mexico, 2016-2027
Figure 46: Latin America Digital-Out-Of-Home (DOOH) Market Forecast (USD Billion), by Rest of Latin America, 2016-2027
Figure 47: Europe Digital-Out-Of-Home (DOOH) Market Value Share (%), By Segment 1, 2019 & 2027
Figure 48: Europe Digital-Out-Of-Home (DOOH) Market Forecast (USD Billion), by Sub-Segment 1, 2016-2027
Figure 49: Europe Digital-Out-Of-Home (DOOH) Market Forecast (USD Billion), by Sub-Segment 2, 2016-2027
Figure 50: Europe Digital-Out-Of-Home (DOOH) Market Value Share (%), By Segment 2, 2019 & 2027
Figure 51: Europe Digital-Out-Of-Home (DOOH) Market Forecast (USD Billion), by Sub-Segment 1, 2016-2027
Figure 52: Europe Digital-Out-Of-Home (DOOH) Market Forecast (USD Billion), by Sub-Segment 2, 2016-2027
Figure 53: Europe Digital-Out-Of-Home (DOOH) Market Forecast (USD Billion), by Sub-Segment 3, 2016-2027
Figure 54: Europe Digital-Out-Of-Home (DOOH) Market Forecast (USD Billion), by Others, 2016-2027
Figure 55: Europe Digital-Out-Of-Home (DOOH) Market Value Share (%), By Segment 3, 2019 & 2027
Figure 56: Europe Digital-Out-Of-Home (DOOH) Market Forecast (USD Billion), by Sub-Segment 1, 2016-2027
Figure 57: Europe Digital-Out-Of-Home (DOOH) Market Forecast (USD Billion), by Sub-Segment 2, 2016-2027
Figure 58: Europe Digital-Out-Of-Home (DOOH) Market Forecast (USD Billion), by Sub-Segment 3, 2016-2027
Figure 59: Europe Digital-Out-Of-Home (DOOH) Market Forecast (USD Billion), by Others, 2016-2027
Figure 60: Europe Digital-Out-Of-Home (DOOH) Market Forecast (USD Billion), by U.K., 2016-2027
Figure 61: Europe Digital-Out-Of-Home (DOOH) Market Forecast (USD Billion), by Germany, 2016-2027
Figure 62: Europe Digital-Out-Of-Home (DOOH) Market Forecast (USD Billion), by France, 2016-2027
Figure 63: Europe Digital-Out-Of-Home (DOOH) Market Forecast (USD Billion), by Italy, 2016-2027
Figure 64: Europe Digital-Out-Of-Home (DOOH) Market Forecast (USD Billion), by Spain, 2016-2027
Figure 65: Europe Digital-Out-Of-Home (DOOH) Market Forecast (USD Billion), by Russia, 2016-2027
Figure 66: Europe Digital-Out-Of-Home (DOOH) Market Forecast (USD Billion), by Rest of Europe, 2016-2027
Figure 67: Asia Pacific Digital-Out-Of-Home (DOOH) Market Value Share (%), By Segment 1, 2019 & 2027
Figure 68: Asia Pacific Digital-Out-Of-Home (DOOH) Market Forecast (USD Billion), by Sub-Segment 1, 2016-2027
Figure 69: Asia Pacific Digital-Out-Of-Home (DOOH) Market Forecast (USD Billion), by Sub-Segment 2, 2016-2027
Figure 70: Asia Pacific Digital-Out-Of-Home (DOOH) Market Value Share (%), By Segment 2, 2019 & 2027
Figure 71: Asia Pacific Digital-Out-Of-Home (DOOH) Market Forecast (USD Billion), by Sub-Segment 1, 2016-2027
Figure 72: Asia Pacific Digital-Out-Of-Home (DOOH) Market Forecast (USD Billion), by Sub-Segment 2, 2016-2027
Figure 73: Asia Pacific Digital-Out-Of-Home (DOOH) Market Forecast (USD Billion), by Sub-Segment 3, 2016-2027
Figure 74: Asia Pacific Digital-Out-Of-Home (DOOH) Market Forecast (USD Billion), by Others, 2016-2027
Figure 75: Asia Pacific Digital-Out-Of-Home (DOOH) Market Value Share (%), By Segment 3, 2019 & 2027
Figure 76: Asia Pacific Digital-Out-Of-Home (DOOH) Market Forecast (USD Billion), by Sub-Segment 1, 2016-2027
Figure 77: Asia Pacific Digital-Out-Of-Home (DOOH) Market Forecast (USD Billion), by Sub-Segment 2, 2016-2027
Figure 78: Asia Pacific Digital-Out-Of-Home (DOOH) Market Forecast (USD Billion), by Sub-Segment 3, 2016-2027
Figure 79: Asia Pacific Digital-Out-Of-Home (DOOH) Market Forecast (USD Billion), by Others, 2016-2027
Figure 80: Asia Pacific Digital-Out-Of-Home (DOOH) Market Forecast (USD Billion), by China, 2016-2027
Figure 81: Asia Pacific Digital-Out-Of-Home (DOOH) Market Forecast (USD Billion), by India, 2016-2027
Figure 82: Asia Pacific Digital-Out-Of-Home (DOOH) Market Forecast (USD Billion), by Japan, 2016-2027
Figure 83: Asia Pacific Digital-Out-Of-Home (DOOH) Market Forecast (USD Billion), by Australia, 2016-2027
Figure 84: Asia Pacific Digital-Out-Of-Home (DOOH) Market Forecast (USD Billion), by Southeast Asia, 2016-2027
Figure 85: Asia Pacific Digital-Out-Of-Home (DOOH) Market Forecast (USD Billion), by Rest of Asia Pacific, 2016-2027
Figure 86: Middle East & Africa Digital-Out-Of-Home (DOOH) Market Value Share (%), By Segment 1, 2019 & 2027
Figure 87: Middle East & Africa Digital-Out-Of-Home (DOOH) Market Forecast (USD Billion), by Sub-Segment 1, 2016-2027
Figure 88: Middle East & Africa Digital-Out-Of-Home (DOOH) Market Forecast (USD Billion), by Sub-Segment 2, 2016-2027
Figure 89: Middle East & Africa Digital-Out-Of-Home (DOOH) Market Value Share (%), By Segment 2, 2019 & 2027
Figure 90: Middle East & Africa Digital-Out-Of-Home (DOOH) Market Forecast (USD Billion), by Sub-Segment 1, 2016-2027
Figure 91: Middle East & Africa Digital-Out-Of-Home (DOOH) Market Forecast (USD Billion), by Sub-Segment 2, 2016-2027
Figure 92: Middle East & Africa Digital-Out-Of-Home (DOOH) Market Forecast (USD Billion), by Sub-Segment 3, 2016-2027
Figure 93: Middle East & Africa Digital-Out-Of-Home (DOOH) Market Forecast (USD Billion), by Others, 2016-2027
Figure 94: Middle East & Africa Digital-Out-Of-Home (DOOH) Market Value Share (%), By Segment 3, 2019 & 2027
Figure 95: Middle East & Africa Digital-Out-Of-Home (DOOH) Market Forecast (USD Billion), by Sub-Segment 1, 2016-2027
Figure 96: Middle East & Africa Digital-Out-Of-Home (DOOH) Market Forecast (USD Billion), by Sub-Segment 2, 2016-2027
Figure 97: Middle East & Africa Digital-Out-Of-Home (DOOH) Market Forecast (USD Billion), by Sub-Segment 3, 2016-2027
Figure 98: Middle East & Africa Digital-Out-Of-Home (DOOH) Market Forecast (USD Billion), by Others, 2016-2027
Figure 99: Middle East & Africa Digital-Out-Of-Home (DOOH) Market Forecast (USD Billion), by GCC, 2016-2027
Figure 100: Middle East & Africa Digital-Out-Of-Home (DOOH) Market Forecast (USD Billion), by South Africa, 2016-2027
Figure 101: Middle East & Africa Digital-Out-Of-Home (DOOH) Market Forecast (USD Billion), by Rest of Middle East & Africa, 2016-2027
List of Tables
Table 1: Global Digital-Out-Of-Home (DOOH) Market Revenue (USD Billion) Forecast, by Segment 1, 2016-2027
Table 2: Global Digital-Out-Of-Home (DOOH) Market Revenue (USD Billion) Forecast, by Segment 2, 2016-2027
Table 3: Global Digital-Out-Of-Home (DOOH) Market Revenue (USD Billion) Forecast, by Segment 3, 2016-2027
Table 4: Global Digital-Out-Of-Home (DOOH) Market Revenue (USD Billion) Forecast, by Region, 2016-2027
Table 5: North America Digital-Out-Of-Home (DOOH) Market Revenue (USD Billion) Forecast, by Segment 1, 2016-2027
Table 6: North America Digital-Out-Of-Home (DOOH) Market Revenue (USD Billion) Forecast, by Segment 2, 2016-2027
Table 7: North America Digital-Out-Of-Home (DOOH) Market Revenue (USD Billion) Forecast, by Segment 3, 2016-2027
Table 8: North America Digital-Out-Of-Home (DOOH) Market Revenue (USD Billion) Forecast, by Country, 2016-2027
Table 9: Europe Digital-Out-Of-Home (DOOH) Market Revenue (USD Billion) Forecast, by Segment 1, 2016-2027
Table 10: Europe Digital-Out-Of-Home (DOOH) Market Revenue (USD Billion) Forecast, by Segment 2, 2016-2027
Table 11: Europe Digital-Out-Of-Home (DOOH) Market Revenue (USD Billion) Forecast, by Segment 3, 2016-2027
Table 12: Europe Digital-Out-Of-Home (DOOH) Market Revenue (USD Billion) Forecast, by Country, 2016-2027
Table 13: Latin America Digital-Out-Of-Home (DOOH) Market Revenue (USD Billion) Forecast, by Segment 1, 2016-2027
Table 14: Latin America Digital-Out-Of-Home (DOOH) Market Revenue (USD Billion) Forecast, by Segment 2, 2016-2027
Table 15: Latin America Digital-Out-Of-Home (DOOH) Market Revenue (USD Billion) Forecast, by Segment 3, 2016-2027
Table 16: Latin America Digital-Out-Of-Home (DOOH) Market Revenue (USD Billion) Forecast, by Country, 2016-2027
Table 17: Asia Pacific Digital-Out-Of-Home (DOOH) Market Revenue (USD Billion) Forecast, by Segment 1, 2016-2027
Table 18: Asia Pacific Digital-Out-Of-Home (DOOH) Market Revenue (USD Billion) Forecast, by Segment 2, 2016-2027
Table 19: Asia Pacific Digital-Out-Of-Home (DOOH) Market Revenue (USD Billion) Forecast, by Segment 3, 2016-2027
Table 20: Asia Pacific Digital-Out-Of-Home (DOOH) Market Revenue (USD Billion) Forecast, by Country, 2016-2027
Table 21: Middle East & Africa Digital-Out-Of-Home (DOOH) Market Revenue (USD Billion) Forecast, by Segment 1, 2016-2027
Table 22: Middle East & Africa Digital-Out-Of-Home (DOOH) Market Revenue (USD Billion) Forecast, by Segment 2, 2016-2027
Table 23: Middle East & Africa Digital-Out-Of-Home (DOOH) Market Revenue (USD Billion) Forecast, by Segment 3, 2016-2027
Table 24: Middle East & Africa Digital-Out-Of-Home (DOOH) Market Revenue (USD Billion) Forecast, by Country, 2016-2027
Research Process
Data Library Research are conducted by industry experts who offer insight on
industry structure, market segmentations technology assessment and competitive landscape (CL), and penetration, as well as on emerging trends. Their analysis is based on primary interviews (~ 80%) and secondary research (~ 20%) as well as years of professional expertise in their respective industries. Adding to this, by analysing historical trends and current market positions, our analysts predict where the market will be headed for the next five years. Furthermore, the varying trends of segment & categories geographically presented are also studied and the estimated based on the primary & secondary research.
In this particular report from the supply side Data Library Research has conducted primary surveys (interviews) with the key level executives (VP, CEO’s, Marketing Director, Business Development Manager
and SOFT) of the companies that active & prominent as well as the midsized organization
FIGURE 1: DLR RESEARH PROCESS
![research-methodology1]()
Primary Research
Extensive primary research was conducted to gain a deeper insight of the market and industry performance. The analysis is based on both primary and secondary research as well as years of professional expertise in the respective industries.
In addition to analysing current and historical trends, our analysts predict where the market is headed over the next five years.
It varies by segment for these categories geographically presented in the list of market tables. Speaking about this particular report we have conducted primary surveys (interviews) with the key level executives (VP, CEO’s, Marketing Director, Business Development Manager and many more) of the major players active in the market.
Secondary Research
Secondary research was mainly used to collect and identify information useful for the extensive, technical, market-oriented, and Friend’s study of the Global Extra Neutral Alcohol. It was also used to obtain key information about major players, market classification and segmentation according to the industry trends, geographical markets, and developments related to the market and technology perspectives. For this study, analysts have gathered information from various credible sources, such as annual reports, sec filings, journals, white papers, SOFT presentations, and company web sites.
Market Size Estimation
Both, top-down and bottom-up approaches were used to estimate and validate the size of the Global market and to estimate the size of various other dependent submarkets in the overall Extra Neutral Alcohol. The key players in the market were identified through secondary research and their market contributions in the respective geographies were determined through primary and secondary research.
Forecast Model
![research-methodology2]()