Digital Automatic Burst Strength Tester Market Overview and Analysis
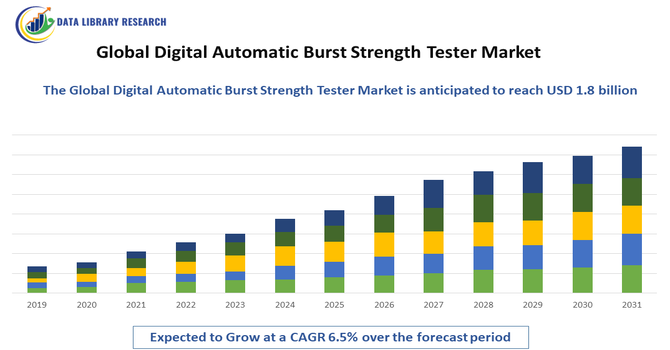
- The Global Digital Automatic Burst Strength Tester market is growing, projected to reach approximately USD 1.8 billion by 2032, from USD 765.9 million in 2025, growing with a CAGR of around 6.5% 2025-2032.
Get Complete Analysis Of The Report - Download Updated Free Sample PDF
The Global Digital Automatic Burst Strength Tester Market refers to the industry that produces and sells machines used to measure how much pressure materials like paper, cardboard, textiles, and packaging can withstand before bursting. These digital testers help manufacturers maintain quality, improve product strength, and ensure compliance with international safety and performance standards. Th growth in this market was driven by rising demand for high-quality packaging, stricter product safety standards, increased manufacturing automation, and the need for accurate digital testing to improve material strength and durability.
Digital Automatic Burst Strength Tester Market Latest Trends
The Global Digital Automatic Burst Strength Tester Market is witnessing a shift toward automation and digital integration, with modern testers offering precise, real-time measurements and data analytics. Innovations such as AI-assisted testing, cloud connectivity, and user-friendly interfaces are becoming standard, enabling manufacturers to optimize quality control processes. Increasing adoption of eco-friendly materials and smart packaging has also driven demand for advanced testing solutions to ensure durability and compliance.
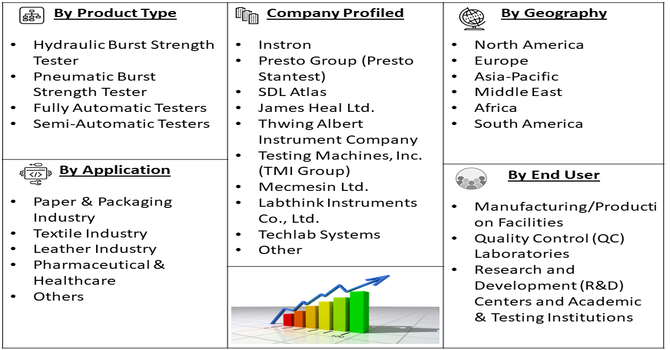
Segmentation: The Digital Automatic Burst Strength Tester Market is segmented by Product Type (Hydraulic Burst Strength Tester, Pneumatic Burst Strength Tester, Fully Automatic Testers, and Semi-Automatic Testers), Application (Paper & Packaging Industry, Textile Industry, Leather Industry, Pharmaceutical & Healthcare, and Others), End-User (Manufacturing/Production Facilities, Quality Control (QC) Laboratories, Research and Development (R&D) Centers and Academic & Testing Institutions), and Geography (North America, Europe, Asia-Pacific, Middle East and Africa, and South America). The report provides the value (in USD million) for the above segments.
For Detailed Market Segmentation - Get a Free Sample PDF
Market Drivers:
- Increasing Demand for Packaging and Paper Quality
The main drivers of the global digital automatic burst strength tester market is the growing need for high-quality packaging and paper products. Manufacturers across packaging, food, and textile industries rely on burst strength testing to ensure materials can withstand pressure and stress.
In December 2025, WSCS India’s rapid growth in paper cutlery and sustainable packaging highlighted the rising demand for high-quality, durable paper products. This trend intensified the need for reliable testing, boosting adoption of digital automatic burst strength testers globally, as manufacturers sought to ensure product strength, compliance with quality standards, and consistency across packaging and paper materials. As e-commerce, consumer goods, and industrial shipping volumes rise, companies are investing more in reliable testing equipment to prevent product damage, reduce returns, and maintain customer satisfaction. This rising emphasis on quality assurance directly boosts demand for advanced digital burst strength testers worldwide.
- Adoption of Automation and Digital Technologies
The market is also driven by the increasing adoption of automation and digital technologies in quality control processes. Digital automatic burst strength testers provide precise, real-time measurements, data storage, and analytics, enabling manufacturers to optimize production, reduce errors, and improve efficiency. Companies are moving away from manual testing methods to automated systems that save time, reduce labor costs, and enhance reliability. The integration of smart sensors, software interfaces, and AI-assisted analysis has made these testers more attractive, fueling their adoption across paper, packaging, and textile industries globally.
Market Restraints:
- High Equipment Costs and Maintenance Requirements
A significant restraint for the market is the high cost of digital automatic burst strength testers and ongoing maintenance expenses. Advanced testing systems require substantial initial investment, calibration, and technical support, which can be a barrier for small and medium-sized manufacturers. Additionally, maintaining accuracy and ensuring compliance with international testing standards often involves trained personnel and regular servicing. These factors can slow adoption in price-sensitive markets and limit the market’s growth potential. Companies may delay purchases or continue using older, manual testers, especially in developing regions, restraining the overall expansion of the global market.
Socioeconomic Impact on the Digital Automatic Burst Strength Tester Market
The market has a significant socioeconomic impact by enhancing product quality, safety, and reliability across multiple industries, including packaging, textiles, and paper. Accurate burst strength testing reduces material waste, prevents product failures, and supports sustainable manufacturing practices, contributing to environmental conservation and cost savings. It also creates employment opportunities in equipment manufacturing, calibration services, and technical support. Improved product durability increases consumer trust, boosting economic activity and competitiveness. By supporting standardized testing and compliance with international quality regulations, the market indirectly promotes trade and industrial development, enhancing the overall socioeconomic growth of regions adopting advanced testing technologies.
Segmental Analysis:
- Hydraulic Burst Strength Tester segment is expected to witness the highest growth over the forecast period
The hydraulic burst strength tester segment is projected to witness the highest growth over the forecast period due to its precise, reliable, and consistent performance in evaluating material durability. Hydraulic testers are widely used for measuring the burst strength of paper, cardboard, textiles, and packaging materials, providing real-time digital readings and ensuring compliance with industry standards. Their accuracy, ease of use, and adaptability for various material types make them a preferred choice for quality control departments. As manufacturers increasingly focus on reducing product failures and maintaining global quality benchmarks, hydraulic burst strength testers are expected to dominate market growth.
- Paper & Packaging Industry segment is expected to witness the highest growth over the forecast period
The paper and packaging industry segment is expected to witness the highest growth, driven by increasing demand for durable, sustainable, and high-quality packaging solutions.
Manufacturers are investing in digital automatic testers to ensure consistent product quality, optimize material usage, and comply with regulatory standards. For instance, in August 2025, Mondi’s FunctionalBarrier Paper Ultimate, designed for recyclability and sustainability, reflects the growing demand for high-quality, eco-friendly packaging. This shift toward durable, recyclable materials has increased the need for precise strength testing, driving adoption of digital automatic burst strength testers globally as manufacturers ensure consistent performance, regulatory compliance, and reliability in sustainable paper and packaging products. With packaging becoming more critical for brand protection and consumer satisfaction, this industry segment continues to drive significant adoption of advanced burst strength testing solutions globally.
- Manufacturing/Production Facilities segment is expected to witness the highest growth over the forecast period
Manufacturing and production facilities are projected to drive the highest growth in demand for digital automatic burst strength testers, as these environments require rigorous quality control. Facilities producing paper, cardboard, textiles, and other materials need real-time, accurate measurements to maintain operational efficiency and reduce waste. Automated and digital testers allow manufacturers to monitor material performance continuously, detect defects early, and adhere to international quality standards. Rising competition and consumer expectations are prompting production facilities to invest in advanced testing equipment to improve reliability, maintain certifications, and minimize production errors, boosting overall adoption of digital burst strength testing systems.
- Asia-Pacific region is expected to witness the highest growth over the forecast period
The Asia-Pacific region is expected to record the highest growth over the forecast period due to rapid industrialization, expanding packaging and paper manufacturing sectors, and increasing trade volumes. Countries like China, India, Japan, and South Korea are investing heavily in production infrastructure and quality control systems. Rising demand for e-commerce packaging, food and beverage containers, and sustainable paper products is accelerating the adoption of digital automatic burst strength testers. Additionally, regulatory compliance and international standards are driving manufacturers in the region to implement reliable and automated testing solutions, further strengthening the market growth potential in Asia-Pacific.
| Report Matrics |
Details |
| Market Size Value |
USD 1.8 billion |
| Growth Rate |
CAGR of 6.5 % |
| Forecast |
2026-2033 |
| Historical data |
2021-2024 |
| Base Year |
2025 |
| Report Coverage |
Forecasted revenue, company rating, competitive environment, growth drivers, and trends |
| Segment Coverage |
Type, Application, End-User, Geography |
| Regional Scope |
North America, Europe, Asia Pacific, Middle East |
| Customized scope |
Free customization of reports (With 3 months' analysis support) |
| To Learn More About This Report |
Request a Free Sample Copy |
Digital Automatic Burst Strength Tester Market Competitive Landscape
The competitive landscape of the global digital automatic burst strength tester market is highly fragmented and innovation-driven. Leading players focus on developing technologically advanced, reliable, and user-friendly testing solutions to differentiate themselves. Companies are investing in R&D for AI integration, cloud-based monitoring, and automated reporting features to meet evolving industry demands. Strategic partnerships, regional expansions, and acquisitions are common to strengthen market presence and distribution networks. Pricing strategies, after-sales services, and product customization play a critical role in maintaining competitiveness. Continuous innovation and adherence to international standards define market leadership, while smaller players capitalize on niche applications and regional opportunities.
The major players for this market are:
- Instron
- Presto Group (Presto Stantest)
- SDL Atlas
- James Heal Ltd.
- Thwing Albert Instrument Company
- Testing Machines, Inc. (TMI Group)
- Mecmesin Ltd.
- Labthink Instruments Co., Ltd.
- Qualitest International Inc.
- Gester Instruments Co., Ltd.
- Haida International Equipment Co., Ltd.
- IDM Instruments Pty Ltd.
- Asian Test Equipments
- PCE Instruments
- Techlab Systems
- Testronix Instruments
- Fisher Scientific (testing equipment segment)
- Jinan Xinghua Instruments Co., Ltd.
- Chengde Jinjian Testing Instrument Co., Ltd.
- CELTEC Instruments / Pouchbursttester.com
Recent Development
- In December 2025, Gadget On’s launch of MagX 2.0 showcased innovation in precision-engineered, durable materials, indirectly highlighting the importance of material strength testing. This development reinforced demand for reliable digital automatic burst strength testers globally, as manufacturers increasingly prioritized quality assessment for high-performance, durable components across industrial and consumer applications.
- In July 2023, ABB’s enhancement of its L&W Bursting Strength Tester improved speed, reliability, and operator independence, enabling faster and more efficient testing. The upgrade strengthened market competitiveness, encouraged broader adoption of automated solutions, and positively influenced the global digital automatic burst strength tester market by demonstrating higher efficiency and lower total cost of ownership.
Frequently Asked Questions (FAQ) :
Q1. What are the main growth-driving factors for this market?
The market is driven by increasing global demand for strict quality assurance and standardization across manufacturing industries. Technological advancements, such as the integration of automation and digital reporting in testing processes, also encourage widespread adoption in packaging, textile, and paper sectors.
Q2. What are the main restraining factors for this market?
Key restraining factors include the high initial cost of purchasing and installing these advanced digital and automatic testers. Additionally, the need for skilled technicians to operate and maintain the sophisticated testing equipment acts as a constraint, especially in smaller or developing economies.
Q3. Which segment is expected to witness high growth?
The Paper and Packaging Industry segment is expected to witness high growth. This is due to rising demand for corrugated boxes and cartons in e-commerce, which requires reliable, automated testing to ensure the durability and integrity of various shipping materials.
Q4. Who are the top major players for this market?
The competitive landscape is moderately concentrated, with key players focused on innovation and digital integration. While specific names vary, manufacturers like Presto Stantest, Testronix, and GESTER International are recognized for holding significant market shares in specialized segments.
Q5. Which country is the largest player?
The Asia Pacific region, led primarily by China and India, holds the largest market share and is expected to exhibit the fastest growth. This is due to rapid industrialization, expansion of manufacturing activities, and an increasing focus on adopting international quality standards.
List of Figures
Figure 1: Global Digital Automatic Burst Strength Tester Market Revenue Breakdown (USD Billion, %) by Region, 2022 & 2029
Figure 2: Global Digital Automatic Burst Strength Tester Market Value Share (%), By Segment 1, 2022 & 2029
Figure 3: Global Digital Automatic Burst Strength Tester Market Forecast (USD Billion), by Sub-Segment 1, 2018-2029
Figure 4: Global Digital Automatic Burst Strength Tester Market Forecast (USD Billion), by Sub-Segment 2, 2018-2029
Figure 5: Global Digital Automatic Burst Strength Tester Market Value Share (%), By Segment 2, 2022 & 2029
Figure 6: Global Digital Automatic Burst Strength Tester Market Forecast (USD Billion), by Sub-Segment 1, 2018-2029
Figure 7: Global Digital Automatic Burst Strength Tester Market Forecast (USD Billion), by Sub-Segment 2, 2018-2029
Figure 8: Global Digital Automatic Burst Strength Tester Market Forecast (USD Billion), by Sub-Segment 3, 2018-2029
Figure 9: Global Digital Automatic Burst Strength Tester Market Forecast (USD Billion), by Others, 2018-2029
Figure 10: Global Digital Automatic Burst Strength Tester Market Value Share (%), By Segment 3, 2022 & 2029
Figure 11: Global Digital Automatic Burst Strength Tester Market Forecast (USD Billion), by Sub-Segment 1, 2018-2029
Figure 12: Global Digital Automatic Burst Strength Tester Market Forecast (USD Billion), by Sub-Segment 2, 2018-2029
Figure 13: Global Digital Automatic Burst Strength Tester Market Forecast (USD Billion), by Sub-Segment 3, 2018-2029
Figure 14: Global Digital Automatic Burst Strength Tester Market Forecast (USD Billion), by Others, 2018-2029
Figure 15: Global Digital Automatic Burst Strength Tester Market Value (USD Billion), by Region, 2022 & 2029
Figure 16: North America Digital Automatic Burst Strength Tester Market Value Share (%), By Segment 1, 2022 & 2029
Figure 17: North America Digital Automatic Burst Strength Tester Market Forecast (USD Billion), by Sub-Segment 1, 2018-2029
Figure 18: North America Digital Automatic Burst Strength Tester Market Forecast (USD Billion), by Sub-Segment 2, 2018-2029
Figure 19: North America Digital Automatic Burst Strength Tester Market Value Share (%), By Segment 2, 2022 & 2029
Figure 20: North America Digital Automatic Burst Strength Tester Market Forecast (USD Billion), by Sub-Segment 1, 2018-2029
Figure 21: North America Digital Automatic Burst Strength Tester Market Forecast (USD Billion), by Sub-Segment 2, 2018-2029
Figure 22: North America Digital Automatic Burst Strength Tester Market Forecast (USD Billion), by Sub-Segment 3, 2018-2029
Figure 23: North America Digital Automatic Burst Strength Tester Market Forecast (USD Billion), by Others, 2018-2029
Figure 24: North America Digital Automatic Burst Strength Tester Market Value Share (%), By Segment 3, 2022 & 2029
Figure 25: North America Digital Automatic Burst Strength Tester Market Forecast (USD Billion), by Sub-Segment 1, 2018-2029
Figure 26: North America Digital Automatic Burst Strength Tester Market Forecast (USD Billion), by Sub-Segment 2, 2018-2029
Figure 27: North America Digital Automatic Burst Strength Tester Market Forecast (USD Billion), by Sub-Segment 3, 2018-2029
Figure 28: North America Digital Automatic Burst Strength Tester Market Forecast (USD Billion), by Others, 2018-2029
Figure 29: North America Digital Automatic Burst Strength Tester Market Forecast (USD Billion), by U.S., 2018-2029
Figure 30: North America Digital Automatic Burst Strength Tester Market Forecast (USD Billion), by Canada, 2018-2029
Figure 31: Latin America Digital Automatic Burst Strength Tester Market Value Share (%), By Segment 1, 2022 & 2029
Figure 32: Latin America Digital Automatic Burst Strength Tester Market Forecast (USD Billion), by Sub-Segment 1, 2018-2029
Figure 33: Latin America Digital Automatic Burst Strength Tester Market Forecast (USD Billion), by Sub-Segment 2, 2018-2029
Figure 34: Latin America Digital Automatic Burst Strength Tester Market Value Share (%), By Segment 2, 2022 & 2029
Figure 35: Latin America Digital Automatic Burst Strength Tester Market Forecast (USD Billion), by Sub-Segment 1, 2018-2029
Figure 36: Latin America Digital Automatic Burst Strength Tester Market Forecast (USD Billion), by Sub-Segment 2, 2018-2029
Figure 37: Latin America Digital Automatic Burst Strength Tester Market Forecast (USD Billion), by Sub-Segment 3, 2018-2029
Figure 38: Latin America Digital Automatic Burst Strength Tester Market Forecast (USD Billion), by Others, 2018-2029
Figure 39: Latin America Digital Automatic Burst Strength Tester Market Value Share (%), By Segment 3, 2022 & 2029
Figure 40: Latin America Digital Automatic Burst Strength Tester Market Forecast (USD Billion), by Sub-Segment 1, 2018-2029
Figure 41: Latin America Digital Automatic Burst Strength Tester Market Forecast (USD Billion), by Sub-Segment 2, 2018-2029
Figure 42: Latin America Digital Automatic Burst Strength Tester Market Forecast (USD Billion), by Sub-Segment 3, 2018-2029
Figure 43: Latin America Digital Automatic Burst Strength Tester Market Forecast (USD Billion), by Others, 2018-2029
Figure 44: Latin America Digital Automatic Burst Strength Tester Market Forecast (USD Billion), by Brazil, 2018-2029
Figure 45: Latin America Digital Automatic Burst Strength Tester Market Forecast (USD Billion), by Mexico, 2018-2029
Figure 46: Latin America Digital Automatic Burst Strength Tester Market Forecast (USD Billion), by Rest of Latin America, 2018-2029
Figure 47: Europe Digital Automatic Burst Strength Tester Market Value Share (%), By Segment 1, 2022 & 2029
Figure 48: Europe Digital Automatic Burst Strength Tester Market Forecast (USD Billion), by Sub-Segment 1, 2018-2029
Figure 49: Europe Digital Automatic Burst Strength Tester Market Forecast (USD Billion), by Sub-Segment 2, 2018-2029
Figure 50: Europe Digital Automatic Burst Strength Tester Market Value Share (%), By Segment 2, 2022 & 2029
Figure 51: Europe Digital Automatic Burst Strength Tester Market Forecast (USD Billion), by Sub-Segment 1, 2018-2029
Figure 52: Europe Digital Automatic Burst Strength Tester Market Forecast (USD Billion), by Sub-Segment 2, 2018-2029
Figure 53: Europe Digital Automatic Burst Strength Tester Market Forecast (USD Billion), by Sub-Segment 3, 2018-2029
Figure 54: Europe Digital Automatic Burst Strength Tester Market Forecast (USD Billion), by Others, 2018-2029
Figure 55: Europe Digital Automatic Burst Strength Tester Market Value Share (%), By Segment 3, 2022 & 2029
Figure 56: Europe Digital Automatic Burst Strength Tester Market Forecast (USD Billion), by Sub-Segment 1, 2018-2029
Figure 57: Europe Digital Automatic Burst Strength Tester Market Forecast (USD Billion), by Sub-Segment 2, 2018-2029
Figure 58: Europe Digital Automatic Burst Strength Tester Market Forecast (USD Billion), by Sub-Segment 3, 2018-2029
Figure 59: Europe Digital Automatic Burst Strength Tester Market Forecast (USD Billion), by Others, 2018-2029
Figure 60: Europe Digital Automatic Burst Strength Tester Market Forecast (USD Billion), by U.K., 2018-2029
Figure 61: Europe Digital Automatic Burst Strength Tester Market Forecast (USD Billion), by Germany, 2018-2029
Figure 62: Europe Digital Automatic Burst Strength Tester Market Forecast (USD Billion), by France, 2018-2029
Figure 63: Europe Digital Automatic Burst Strength Tester Market Forecast (USD Billion), by Italy, 2018-2029
Figure 64: Europe Digital Automatic Burst Strength Tester Market Forecast (USD Billion), by Spain, 2018-2029
Figure 65: Europe Digital Automatic Burst Strength Tester Market Forecast (USD Billion), by Russia, 2018-2029
Figure 66: Europe Digital Automatic Burst Strength Tester Market Forecast (USD Billion), by Rest of Europe, 2018-2029
Figure 67: Asia Pacific Digital Automatic Burst Strength Tester Market Value Share (%), By Segment 1, 2022 & 2029
Figure 68: Asia Pacific Digital Automatic Burst Strength Tester Market Forecast (USD Billion), by Sub-Segment 1, 2018-2029
Figure 69: Asia Pacific Digital Automatic Burst Strength Tester Market Forecast (USD Billion), by Sub-Segment 2, 2018-2029
Figure 70: Asia Pacific Digital Automatic Burst Strength Tester Market Value Share (%), By Segment 2, 2022 & 2029
Figure 71: Asia Pacific Digital Automatic Burst Strength Tester Market Forecast (USD Billion), by Sub-Segment 1, 2018-2029
Figure 72: Asia Pacific Digital Automatic Burst Strength Tester Market Forecast (USD Billion), by Sub-Segment 2, 2018-2029
Figure 73: Asia Pacific Digital Automatic Burst Strength Tester Market Forecast (USD Billion), by Sub-Segment 3, 2018-2029
Figure 74: Asia Pacific Digital Automatic Burst Strength Tester Market Forecast (USD Billion), by Others, 2018-2029
Figure 75: Asia Pacific Digital Automatic Burst Strength Tester Market Value Share (%), By Segment 3, 2022 & 2029
Figure 76: Asia Pacific Digital Automatic Burst Strength Tester Market Forecast (USD Billion), by Sub-Segment 1, 2018-2029
Figure 77: Asia Pacific Digital Automatic Burst Strength Tester Market Forecast (USD Billion), by Sub-Segment 2, 2018-2029
Figure 78: Asia Pacific Digital Automatic Burst Strength Tester Market Forecast (USD Billion), by Sub-Segment 3, 2018-2029
Figure 79: Asia Pacific Digital Automatic Burst Strength Tester Market Forecast (USD Billion), by Others, 2018-2029
Figure 80: Asia Pacific Digital Automatic Burst Strength Tester Market Forecast (USD Billion), by China, 2018-2029
Figure 81: Asia Pacific Digital Automatic Burst Strength Tester Market Forecast (USD Billion), by India, 2018-2029
Figure 82: Asia Pacific Digital Automatic Burst Strength Tester Market Forecast (USD Billion), by Japan, 2018-2029
Figure 83: Asia Pacific Digital Automatic Burst Strength Tester Market Forecast (USD Billion), by Australia, 2018-2029
Figure 84: Asia Pacific Digital Automatic Burst Strength Tester Market Forecast (USD Billion), by Southeast Asia, 2018-2029
Figure 85: Asia Pacific Digital Automatic Burst Strength Tester Market Forecast (USD Billion), by Rest of Asia Pacific, 2018-2029
Figure 86: Middle East & Africa Digital Automatic Burst Strength Tester Market Value Share (%), By Segment 1, 2022 & 2029
Figure 87: Middle East & Africa Digital Automatic Burst Strength Tester Market Forecast (USD Billion), by Sub-Segment 1, 2018-2029
Figure 88: Middle East & Africa Digital Automatic Burst Strength Tester Market Forecast (USD Billion), by Sub-Segment 2, 2018-2029
Figure 89: Middle East & Africa Digital Automatic Burst Strength Tester Market Value Share (%), By Segment 2, 2022 & 2029
Figure 90: Middle East & Africa Digital Automatic Burst Strength Tester Market Forecast (USD Billion), by Sub-Segment 1, 2018-2029
Figure 91: Middle East & Africa Digital Automatic Burst Strength Tester Market Forecast (USD Billion), by Sub-Segment 2, 2018-2029
Figure 92: Middle East & Africa Digital Automatic Burst Strength Tester Market Forecast (USD Billion), by Sub-Segment 3, 2018-2029
Figure 93: Middle East & Africa Digital Automatic Burst Strength Tester Market Forecast (USD Billion), by Others, 2018-2029
Figure 94: Middle East & Africa Digital Automatic Burst Strength Tester Market Value Share (%), By Segment 3, 2022 & 2029
Figure 95: Middle East & Africa Digital Automatic Burst Strength Tester Market Forecast (USD Billion), by Sub-Segment 1, 2018-2029
Figure 96: Middle East & Africa Digital Automatic Burst Strength Tester Market Forecast (USD Billion), by Sub-Segment 2, 2018-2029
Figure 97: Middle East & Africa Digital Automatic Burst Strength Tester Market Forecast (USD Billion), by Sub-Segment 3, 2018-2029
Figure 98: Middle East & Africa Digital Automatic Burst Strength Tester Market Forecast (USD Billion), by Others, 2018-2029
Figure 99: Middle East & Africa Digital Automatic Burst Strength Tester Market Forecast (USD Billion), by GCC, 2018-2029
Figure 100: Middle East & Africa Digital Automatic Burst Strength Tester Market Forecast (USD Billion), by South Africa, 2018-2029
Figure 101: Middle East & Africa Digital Automatic Burst Strength Tester Market Forecast (USD Billion), by Rest of Middle East & Africa, 2018-2029
List of Tables
Table 1: Global Digital Automatic Burst Strength Tester Market Revenue (USD Billion) Forecast, by Segment 1, 2018-2029
Table 2: Global Digital Automatic Burst Strength Tester Market Revenue (USD Billion) Forecast, by Segment 2, 2018-2029
Table 3: Global Digital Automatic Burst Strength Tester Market Revenue (USD Billion) Forecast, by Segment 3, 2018-2029
Table 4: Global Digital Automatic Burst Strength Tester Market Revenue (USD Billion) Forecast, by Region, 2018-2029
Table 5: North America Digital Automatic Burst Strength Tester Market Revenue (USD Billion) Forecast, by Segment 1, 2018-2029
Table 6: North America Digital Automatic Burst Strength Tester Market Revenue (USD Billion) Forecast, by Segment 2, 2018-2029
Table 7: North America Digital Automatic Burst Strength Tester Market Revenue (USD Billion) Forecast, by Segment 3, 2018-2029
Table 8: North America Digital Automatic Burst Strength Tester Market Revenue (USD Billion) Forecast, by Country, 2018-2029
Table 9: Europe Digital Automatic Burst Strength Tester Market Revenue (USD Billion) Forecast, by Segment 1, 2018-2029
Table 10: Europe Digital Automatic Burst Strength Tester Market Revenue (USD Billion) Forecast, by Segment 2, 2018-2029
Table 11: Europe Digital Automatic Burst Strength Tester Market Revenue (USD Billion) Forecast, by Segment 3, 2018-2029
Table 12: Europe Digital Automatic Burst Strength Tester Market Revenue (USD Billion) Forecast, by Country, 2018-2029
Table 13: Latin America Digital Automatic Burst Strength Tester Market Revenue (USD Billion) Forecast, by Segment 1, 2018-2029
Table 14: Latin America Digital Automatic Burst Strength Tester Market Revenue (USD Billion) Forecast, by Segment 2, 2018-2029
Table 15: Latin America Digital Automatic Burst Strength Tester Market Revenue (USD Billion) Forecast, by Segment 3, 2018-2029
Table 16: Latin America Digital Automatic Burst Strength Tester Market Revenue (USD Billion) Forecast, by Country, 2018-2029
Table 17: Asia Pacific Digital Automatic Burst Strength Tester Market Revenue (USD Billion) Forecast, by Segment 1, 2018-2029
Table 18: Asia Pacific Digital Automatic Burst Strength Tester Market Revenue (USD Billion) Forecast, by Segment 2, 2018-2029
Table 19: Asia Pacific Digital Automatic Burst Strength Tester Market Revenue (USD Billion) Forecast, by Segment 3, 2018-2029
Table 20: Asia Pacific Digital Automatic Burst Strength Tester Market Revenue (USD Billion) Forecast, by Country, 2018-2029
Table 21: Middle East & Africa Digital Automatic Burst Strength Tester Market Revenue (USD Billion) Forecast, by Segment 1, 2018-2029
Table 22: Middle East & Africa Digital Automatic Burst Strength Tester Market Revenue (USD Billion) Forecast, by Segment 2, 2018-2029
Table 23: Middle East & Africa Digital Automatic Burst Strength Tester Market Revenue (USD Billion) Forecast, by Segment 3, 2018-2029
Table 24: Middle East & Africa Digital Automatic Burst Strength Tester Market Revenue (USD Billion) Forecast, by Country, 2018-2029
Research Process
Data Library Research are conducted by industry experts who offer insight on
industry structure, market segmentations technology assessment and competitive landscape (CL), and penetration, as well as on emerging trends. Their analysis is based on primary interviews (~ 80%) and secondary research (~ 20%) as well as years of professional expertise in their respective industries. Adding to this, by analysing historical trends and current market positions, our analysts predict where the market will be headed for the next five years. Furthermore, the varying trends of segment & categories geographically presented are also studied and the estimated based on the primary & secondary research.
In this particular report from the supply side Data Library Research has conducted primary surveys (interviews) with the key level executives (VP, CEO’s, Marketing Director, Business Development Manager
and SOFT) of the companies that active & prominent as well as the midsized organization
FIGURE 1: DLR RESEARH PROCESS
![research-methodology1]()
Primary Research
Extensive primary research was conducted to gain a deeper insight of the market and industry performance. The analysis is based on both primary and secondary research as well as years of professional expertise in the respective industries.
In addition to analysing current and historical trends, our analysts predict where the market is headed over the next five years.
It varies by segment for these categories geographically presented in the list of market tables. Speaking about this particular report we have conducted primary surveys (interviews) with the key level executives (VP, CEO’s, Marketing Director, Business Development Manager and many more) of the major players active in the market.
Secondary Research
Secondary research was mainly used to collect and identify information useful for the extensive, technical, market-oriented, and Friend’s study of the Global Extra Neutral Alcohol. It was also used to obtain key information about major players, market classification and segmentation according to the industry trends, geographical markets, and developments related to the market and technology perspectives. For this study, analysts have gathered information from various credible sources, such as annual reports, sec filings, journals, white papers, SOFT presentations, and company web sites.
Market Size Estimation
Both, top-down and bottom-up approaches were used to estimate and validate the size of the Global market and to estimate the size of various other dependent submarkets in the overall Extra Neutral Alcohol. The key players in the market were identified through secondary research and their market contributions in the respective geographies were determined through primary and secondary research.
Forecast Model
![research-methodology2]()