E-Liquids Market Overview and Analysis

The Global E-Liquids Market is projected to reach USD 2.87 billion in 2025, with an anticipated growth to USD 4.50 billion by 2034, reflecting a CAGR of 6.9% from 2025-2032.

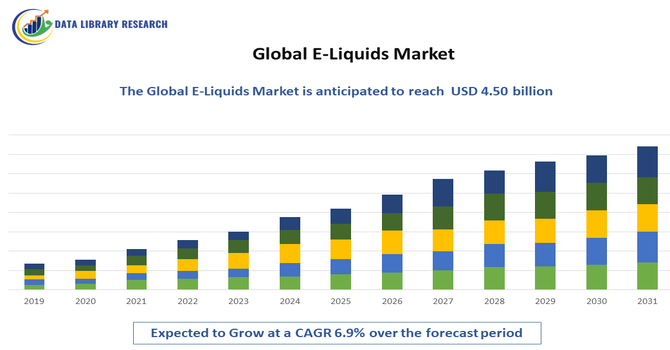
The Global E Liquids Market refers to the worldwide industry involved in manufacturing, distribution and retailing of liquids (“e liquids” or “vape juice”) used in electronic cigarettes and vaping devices. It encompasses various formulations (propylene glycol, vegetable glycerin, flavors, nicotine) and product types aimed at smokers and vapers worldwide. The Global E-Liquids Market is experiencing robust growth, primarily driven by the increasing popularity of e-cigarettes and vaping as alternatives to traditional tobacco smoking. Rising awareness about the reduced health risks associated with vaping, compared to conventional cigarettes, has encouraged smokers to shift toward e-liquids. Additionally, the growing variety of flavors, ranging from tobacco and menthol to fruit and dessert-based options, has expanded consumer appeal across different demographics. Technological advancements in vaping devices, along with the rising influence of online retail and social media marketing, are further propelling market expansion.

E-Liquids Market Latest Trends

 The latest trends in the Global E-Liquids Market highlight a strong shift toward nicotine salt formulations, offering smoother throat hits and faster nicotine absorption, which has gained immense popularity among both new and experienced vapers. There is a growing demand for customizable and premium e-liquid blends, featuring unique flavor combinations, organic ingredients, and reduced harmful chemical content. Sustainability is also emerging as a key focus, with manufacturers adopting eco-friendly packaging and recyclable materials.

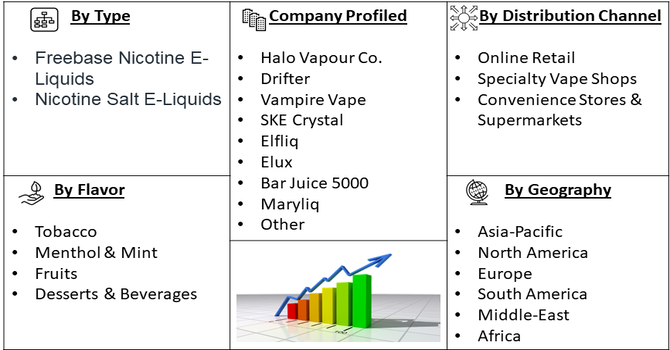
Segmentation: Global E-Liquids Market is segmented By Product Type (Freebase Nicotine E-Liquids, Nicotine Salt E-Liquids), Flavor (Tobacco, Menthol & Mint, Fruits, Desserts & Beverages), Nicotine Content (Nicotine-Free, Low Nicotine, Medium Nicotine, High Nicotine), Distribution Channel (Online Retail, Specialty Vape Shops, Convenience Stores & Supermarkets), and Geography (North America, Europe, Asia-Pacific, Middle East and Africa, and South America). The report provides the value (in USD million) for the above segments.

Market Drivers:

  • Increasing Adoption of E-Cigarettes and Vaping Products

One of the primary drivers of the e-liquids market is the growing adoption of e-cigarettes and vaping devices as alternatives to conventional tobacco products. Consumers are increasingly switching to vaping due to its perception as a safer and less harmful option compared to traditional smoking. The rising awareness of health risks associated with combustible cigarettes, combined with the convenience and discreet nature of vaping devices, has led to higher demand for e-liquids. This trend is further supported by technological advancements in vaping devices that enhance nicotine delivery, flavor experience, and overall user satisfaction, boosting the overall consumption of e-liquids globally.

  • Expanding Flavor Variety and Consumer Preferences

The increasing diversity of e-liquid flavors is another major growth driver. Manufacturers are offering an extensive range of options, including fruits, menthol, desserts, beverages, and specialty blends, catering to diverse consumer tastes and preferences. Flavor innovation attracts both new users and experienced vapers seeking personalized experiences, making e-liquids more appealing and driving repeat purchases. Additionally, the launch of nicotine salt-based e-liquids, which provide smoother throat hits and faster nicotine absorption, has further expanded the consumer base, particularly among younger adults and former smokers seeking satisfaction comparable to traditional cigarettes.

Market Restraints:

  • Stringent Regulatory Policies

Governments and regulatory authorities across key markets, such as the U.S. Food and Drug Administration (FDA) and the European Union, have imposed strict regulations on e-liquids and vaping products. These include restrictions on nicotine concentration, flavor bans, labeling requirements, and marketing limitations, particularly aimed at preventing youth consumption. Compliance with these regulations increases production costs and can limit product availability, thereby restraining market expansion.

Socio economic Impact on E-Liquids Market

The global e-liquids market has had significant socioeconomic impacts, balancing economic growth with public health considerations. Rapid market expansion has created numerous employment opportunities in manufacturing, distribution, and retail, particularly in regions like North America and Europe. It has also generated substantial tax revenues for governments and contributed to trade and export activities, stimulating broader economic development. However, the market raises social concerns, as patterns of consumption may disproportionately affect vulnerable populations, including youth and lower-income groups. Additionally, inconsistent regulations across countries can lead to illicit trade and reduced tax compliance. Thus, while the e-liquids industry supports economic activity and job creation, it highlights the need for careful regulatory oversight to ensure public health and social equity are safeguarded.

Segmental Analysis:

  • Nicotine Salt E-Liquids segment is expected to witness highest growth over the forecast period

Nicotine salt e-liquids are rapidly gaining popularity due to their smoother throat hit and faster nicotine absorption compared to traditional freebase nicotine e-liquids. This makes them particularly appealing to new vapers and former smokers seeking satisfaction comparable to conventional cigarettes. The growing demand for compact, pod-based vaping devices, which are optimized for nicotine salts, further drives this segment. The ability to deliver higher nicotine concentrations without harshness is contributing significantly to the adoption of nicotine salt e-liquids globally.

  • Fruits segment is expected to witness highest growth over the forecast period

Fruit-flavored e-liquids are among the most preferred flavors in the market, especially among younger adults and new users. They offer a variety of taste profiles, including berries, citrus, tropical fruits, and mixed fruit blends, which enhance the vaping experience. The popularity of fruity flavors is bolstered by flavor innovation, targeted marketing campaigns, and consumer preference for diverse, enjoyable options, making this segment a major growth contributor in the e-liquids market.

  • Medium Nicotine (6–12 mg/ml) segment is expected to witness highest growth over the forecast period

Medium nicotine e-liquids strike a balance between satisfaction and smoothness, catering to regular vapers who want a consistent nicotine hit without the harshness associated with high nicotine levels. This concentration range is widely used in pod systems and refillable devices, making it accessible and popular among both beginner and experienced users. The strong consumer preference for medium nicotine formulations contributes to steady market growth for this segment.

  • Online Retail segment is expected to witness highest growth over the forecast period

Online retail has emerged as a key distribution channel for e-liquids, driven by convenience, wide product variety, competitive pricing, and direct-to-consumer access. E-commerce platforms allow consumers to explore flavors, nicotine strengths, and device compatibility from the comfort of their homes. The rise of digital marketing, social media promotions, and subscription-based models further accelerates online sales, making this segment one of the fastest-growing distribution channels globally.

  • North America region is expected to witness highest growth over the forecast period

North America dominates the global e-liquids market due to high vaping adoption rates, favorable regulatory frameworks in certain regions, and the presence of leading e-liquid manufacturers. The U.S. market, in particular, benefits from growing awareness of reduced-risk alternatives to conventional cigarettes, the popularity of flavored e-liquids, and widespread availability of vaping devices through online and specialty retail channels.

Continuous innovation in nicotine formulations and devices is further driving regional market growth. The U.S. e-liquids market is also propelled by strong marketing and brand loyalty among consumers, alongside increasing investment in research and development by key players. Rising health consciousness and a shift toward customizable vaping experiences, such as adjustable nicotine strengths and diverse flavor profiles, are further expanding the consumer base. Regulatory clarity in some states supports legal sales, while e-commerce platforms enhance accessibility, making the U.S. a pivotal market for both domestic and international e-liquid manufacturers.

E-Liquids Market Competitive Landscape:

The Global E-Liquids Market is characterized by a diverse and competitive landscape, encompassing a range of companies from established brands to emerging manufacturers. These companies offer a wide array of e-liquid products, catering to various consumer preferences and regulatory standards across different regions.

Key Players:

  • Halo Vapour Co.
  • Drifter
  • Vampire Vape
  • SKE Crystal
  • Elfliq
  • Elux
  • Bar Juice 5000
  • Maryliq
  • Ohm Brew
  • IVG
  • Doozy Vape Co.
  • Cotton & Cable
  • WizMix
  • Keep It 100 E-Liquid
  • Innevape E-Liquids
  • Juice Head E-Liquid
  • Candy King eJuice
  • VGOD E-Liquids
  • Nomenon E-Liquid
  • Custard Monster E-Liquid

Recent Development

  • In October 2025, MAXUS, a US-based vaping brand known for producing all its products in the United States with premium American-made e-liquids, officially unveiled its latest innovation—the MAXUS STAR 50K. This new disposable vape featured advanced technology, refined craftsmanship, and flavors designed specifically to suit the preferences of US consumers.


  • In June 2025, ELFBAR and LOST MARY recently showcased significant advancements in research and development, product innovation, and enhanced testing protocols. The brands continued to set industry standards by focusing on safer materials and e-liquid ingredients for vaping products. Their efforts extended beyond scientific research to include a comprehensive safety evaluation process. This procedure encompassed 281 tests in total: 142 on e-liquids, 22 on aerosols, 86 on device materials, and 31 on product reliability parameters, reflecting their ongoing commitment to delivering reduced-risk alternatives for adult users globally.


Frequently Asked Questions (FAQ) :

Q1. What are the main growth-driving factors for this market?

The primary growth drivers are the increasing number of traditional smokers transitioning to e-cigarettes due to the perception that vaping is a less harmful alternative to combustible tobacco products. Product innovation, such as the introduction of convenient pod-based systems, adjustable power devices, and a vast diversity of e-liquid flavors, significantly enhances consumer appeal. The relative affordability of vaping products compared to traditional cigarettes in many markets also contributes substantially to market expansion.

Q2. What are the main restraining factors for this market?

Strict and evolving regulatory frameworks worldwide pose the most significant restraint on the market. Governments are increasingly implementing restrictions on e-liquid sales, particularly banning or limiting certain flavors and imposing high taxes to discourage youth vaping. Additionally, public health controversies and safety concerns regarding the chemicals used in e-liquids and isolated instances of product-related lung injuries create negative perceptions, leading to consumer hesitancy and stricter policy enforcement.

Q3. Which segment is expected to witness high growth?

The Flavored E-liquids segment, excluding traditional tobacco and menthol flavors, is anticipated to witness substantial growth despite regulatory challenges. While some regions ban certain flavors, the demand for fruit, dessert, and confectionery flavors remains high among adult users globally, particularly in markets with more lenient regulations. The continuous innovation in nicotine salt-based e-liquids, which offer higher nicotine concentration with a smoother throat hit, also drives growth in the overall category.

Q4. Who are the top major players for this market?

The market is dominated by large tobacco companies that have diversified into the vaping industry, alongside specialized e-liquid manufacturers. Top major players include Philip Morris International (PMI), Altria Group (which acquired NJOY), British American Tobacco (BAT), and Japan Tobacco International (JTI). Specialized companies like Juul Labs (often partnered with major firms) and various independent e-liquid manufacturers also hold significant market shares through brand innovation and expansive product portfolios.

Q5. Which country is the largest player?

North America, with the United States as the largest single country, currently holds the biggest revenue share in the global e-liquids market. This dominance is due to the high adoption rate of e-cigarettes as a smoking cessation or alternative product, a developed retail and distribution infrastructure, and the early presence of major industry players. The massive consumer base and significant purchasing power in the U.S. drive its market leadership.

E-Liquids MARKET STUDY GLOBAL MARKET ANALYSIS, INSIGHTS AND FORECAST, 2022-2029

    1. Introduction

    • 1.1. Research Scope
    • 1.2. Market Segmentation
    • 1.3. Research Methodology
    • 1.4. Definitions and Assumptions

    2. Executive Summary

      3. Market Dynamics

      • 3.1. Market Drivers
      • 3.2. Market Restraints
      • 3.3. Market Opportunities

      4. Key Insights

      • 4.1. Key Emerging Trends – For Major Countries
      • 4.2. Latest Technological Advancement
      • 4.3. Regulatory Landscape
      • 4.4. Industry SWOT Analysis
      • 4.5. Porters Five Forces Analysis

      5. Global E-Liquids Market Analysis (USD Billion), Insights and Forecast, 2018-2029

      • 5.1. Key Findings / Summary
      • 5.2. Market Analysis, Insights and Forecast – By Segment 1
        • 5.2.1. Sub-Segment 1
        • 5.2.2. Sub-Segment 2
      • 5.3. Market Analysis, Insights and Forecast – By Segment 2
        • 5.3.1. Sub-Segment 1
        • 5.3.2. Sub-Segment 2
        • 5.3.3. Sub-Segment 3
        • 5.3.4. Others
      • 5.4. Market Analysis, Insights and Forecast – By Segment 3
        • 5.4.1. Sub-Segment 1
        • 5.4.2. Sub-Segment 2
        • 5.4.3. Sub-Segment 3
        • 5.4.4. Others
      • 5.5. Market Analysis, Insights and Forecast – By Region
        • 5.5.1. North America
        • 5.5.2. Latin America
        • 5.5.3. Europe
        • 5.5.4. Asia Pacific
        • 5.5.5. Middle East and Africa

      6. North America E-Liquids Market Analysis (USD Billion), Insights and Forecast, 2018-2029

      • 6.1. Key Findings / Summary
      • 6.2. Market Analysis, Insights and Forecast – By Segment 1
        • 6.2.1. Sub-Segment 1
        • 6.2.2. Sub-Segment 2
      • 6.3. Market Analysis, Insights and Forecast – By Segment 2
        • 6.3.1. Sub-Segment 1
        • 6.3.2. Sub-Segment 2
        • 6.3.3. Sub-Segment 3
        • 6.3.4. Others
      • 6.4. Market Analysis, Insights and Forecast – By Segment 3
        • 6.4.1. Sub-Segment 1
        • 6.4.2. Sub-Segment 2
        • 6.4.3. Sub-Segment 3
        • 6.4.4. Others
      • 6.5. Market Analysis, Insights and Forecast – By Country
        • 6.5.1. U.S.
        • 6.5.2. Canada

      7. Latin America E-Liquids Market Analysis (USD Billion), Insights and Forecast, 2018-2029

      • 7.1. Key Findings / Summary
      • 7.2. Market Analysis, Insights and Forecast – By Segment 1
        • 7.2.1. Sub-Segment 1
        • 7.2.2. Sub-Segment 2
      • 7.3. Market Analysis, Insights and Forecast – By Segment 2
        • 7.3.1. Sub-Segment 1
        • 7.3.2. Sub-Segment 2
        • 7.3.3. Sub-Segment 3
        • 7.3.4. Others
      • 7.4. Market Analysis, Insights and Forecast – By Segment 3
        • 7.4.1. Sub-Segment 1
        • 7.4.2. Sub-Segment 2
        • 7.4.3. Sub-Segment 3
        • 7.4.4. Others
      • 7.5. Insights and Forecast – By Country
        • 7.5.1. Brazil
        • 7.5.2. Mexico
        • 7.5.3. Rest of Latin America

      8. Europe E-Liquids Market Analysis (USD Billion), Insights and Forecast, 2018-2029

      • 8.1. Key Findings / Summary
      • 8.2. Market Analysis, Insights and Forecast – By Segment 1
        • 8.2.1. Sub-Segment 1
        • 8.2.2. Sub-Segment 2
      • 8.3. Market Analysis, Insights and Forecast – By Segment 2
        • 8.3.1. Sub-Segment 1
        • 8.3.2. Sub-Segment 2
        • 8.3.3. Sub-Segment 3
        • 8.3.4. Others
      • 8.4. Market Analysis, Insights and Forecast – By Segment 3
        • 8.4.1. Sub-Segment 1
        • 8.4.2. Sub-Segment 2
        • 8.4.3. Sub-Segment 3
        • 8.4.4. Others
      • 8.5. Market Analysis, Insights and Forecast – By Country
        • 8.5.1. UK
        • 8.5.2. Germany
        • 8.5.3. France
        • 8.5.4. Italy
        • 8.5.5. Spain
        • 8.5.6. Russia
        • 8.5.7. Rest of Europe

      9. Asia Pacific E-Liquids Market Analysis (USD Billion), Insights and Forecast, 2018-2029

      • 9.1. Key Findings / Summary
      • 9.2. Market Analysis, Insights and Forecast – By Segment 1
        • 9.2.1. Sub-Segment 1
        • 9.2.2. Sub-Segment 2
      • 9.3. Market Analysis, Insights and Forecast – By Segment 2
        • 9.3.1. Sub-Segment 1
        • 9.3.2. Sub-Segment 2
        • 9.3.3. Sub-Segment 3
        • 9.3.4. Others
      • 9.4. Market Analysis, Insights and Forecast – By Segment 3
        • 9.4.1. Sub-Segment 1
        • 9.4.2. Sub-Segment 2
        • 9.4.3. Sub-Segment 3
        • 9.4.4. Others
      • 9.5. Market Analysis, Insights and Forecast – By Country
        • 9.5.1. China
        • 9.5.2. India
        • 9.5.3. Japan
        • 9.5.4. Australia
        • 9.5.5. South East Asia
        • 9.5.6. Rest of Asia Pacific

      10. Middle East & Africa E-Liquids Market Analysis (USD Billion), Insights and Forecast, 2018-2029

      • 10.1. Key Findings / Summary
      • 10.2. Market Analysis, Insights and Forecast – By Segment 1
        • 10.2.1. Sub-Segment 1
        • 10.2.2. Sub-Segment 2
      • 10.3. Market Analysis, Insights and Forecast – By Segment 2
        • 10.3.1. Sub-Segment 1
        • 10.3.2. Sub-Segment 2
        • 10.3.3. Sub-Segment 3
        • 10.3.4. Others
      • 10.4. Market Analysis, Insights and Forecast – By Segment 3
        • 10.4.1. Sub-Segment 1
        • 10.4.2. Sub-Segment 2
        • 10.4.3. Sub-Segment 3
        • 10.4.4. Others
      • 10.5. Market Analysis, Insights and Forecast – By Country
        • 10.5.1. GCC
        • 10.5.2. South Africa
        • 10.5.3. Rest of Middle East & Africa

      11. Competitive Analysis

      • 11.1. Company Market Share Analysis, 2018
      • 11.2. Key Industry Developments
      • 11.3. Company Profile
        • 11.3.1. Company 1
          • 11.3.1.1. Business Overview
          • 11.3.1.2. Segment 1 & Service Offering
          • 11.3.1.3. Overall Revenue
          • 11.3.1.4. Geographic Presence
          • 11.3.1.5. Recent Development
        *Similar details will be provided for the following companies
        • 11.3.2. Company 2
        • 11.3.3. Company 3
        • 11.3.4. Company 4
        • 11.3.5. Company 5
        • 11.3.6. Company 6
        • 11.3.7. Company 7
        • 11.3.8. Company 8
        • 11.3.9. Company 9
        • 11.3.10. Company 10
        • 11.3.11. Company 11
        • 11.3.12. Company 12
      List of Figures

      Figure 1: Global E-Liquids Market Revenue Breakdown (USD Billion, %) by Region, 2022 & 2029
      Figure 2: Global E-Liquids Market Value Share (%), By Segment 1, 2022 & 2029
      Figure 3: Global E-Liquids Market Forecast (USD Billion), by Sub-Segment 1, 2018-2029
      Figure 4: Global E-Liquids Market Forecast (USD Billion), by Sub-Segment 2, 2018-2029
      Figure 5: Global E-Liquids Market Value Share (%), By Segment 2, 2022 & 2029
      Figure 6: Global E-Liquids Market Forecast (USD Billion), by Sub-Segment 1, 2018-2029
      Figure 7: Global E-Liquids Market Forecast (USD Billion), by Sub-Segment 2, 2018-2029
      Figure 8: Global E-Liquids Market Forecast (USD Billion), by Sub-Segment 3, 2018-2029
      Figure 9: Global E-Liquids Market Forecast (USD Billion), by Others, 2018-2029
      Figure 10: Global E-Liquids Market Value Share (%), By Segment 3, 2022 & 2029
      Figure 11: Global E-Liquids Market Forecast (USD Billion), by Sub-Segment 1, 2018-2029
      Figure 12: Global E-Liquids Market Forecast (USD Billion), by Sub-Segment 2, 2018-2029
      Figure 13: Global E-Liquids Market Forecast (USD Billion), by Sub-Segment 3, 2018-2029
      Figure 14: Global E-Liquids Market Forecast (USD Billion), by Others, 2018-2029
      Figure 15: Global E-Liquids Market Value (USD Billion), by Region, 2022 & 2029
      Figure 16: North America E-Liquids Market Value Share (%), By Segment 1, 2022 & 2029
      Figure 17: North America E-Liquids Market Forecast (USD Billion), by Sub-Segment 1, 2018-2029
      Figure 18: North America E-Liquids Market Forecast (USD Billion), by Sub-Segment 2, 2018-2029
      Figure 19: North America E-Liquids Market Value Share (%), By Segment 2, 2022 & 2029
      Figure 20: North America E-Liquids Market Forecast (USD Billion), by Sub-Segment 1, 2018-2029
      Figure 21: North America E-Liquids Market Forecast (USD Billion), by Sub-Segment 2, 2018-2029
      Figure 22: North America E-Liquids Market Forecast (USD Billion), by Sub-Segment 3, 2018-2029
      Figure 23: North America E-Liquids Market Forecast (USD Billion), by Others, 2018-2029
      Figure 24: North America E-Liquids Market Value Share (%), By Segment 3, 2022 & 2029
      Figure 25: North America E-Liquids Market Forecast (USD Billion), by Sub-Segment 1, 2018-2029
      Figure 26: North America E-Liquids Market Forecast (USD Billion), by Sub-Segment 2, 2018-2029
      Figure 27: North America E-Liquids Market Forecast (USD Billion), by Sub-Segment 3, 2018-2029
      Figure 28: North America E-Liquids Market Forecast (USD Billion), by Others, 2018-2029
      Figure 29: North America E-Liquids Market Forecast (USD Billion), by U.S., 2018-2029
      Figure 30: North America E-Liquids Market Forecast (USD Billion), by Canada, 2018-2029
      Figure 31: Latin America E-Liquids Market Value Share (%), By Segment 1, 2022 & 2029
      Figure 32: Latin America E-Liquids Market Forecast (USD Billion), by Sub-Segment 1, 2018-2029
      Figure 33: Latin America E-Liquids Market Forecast (USD Billion), by Sub-Segment 2, 2018-2029
      Figure 34: Latin America E-Liquids Market Value Share (%), By Segment 2, 2022 & 2029
      Figure 35: Latin America E-Liquids Market Forecast (USD Billion), by Sub-Segment 1, 2018-2029
      Figure 36: Latin America E-Liquids Market Forecast (USD Billion), by Sub-Segment 2, 2018-2029
      Figure 37: Latin America E-Liquids Market Forecast (USD Billion), by Sub-Segment 3, 2018-2029
      Figure 38: Latin America E-Liquids Market Forecast (USD Billion), by Others, 2018-2029
      Figure 39: Latin America E-Liquids Market Value Share (%), By Segment 3, 2022 & 2029
      Figure 40: Latin America E-Liquids Market Forecast (USD Billion), by Sub-Segment 1, 2018-2029
      Figure 41: Latin America E-Liquids Market Forecast (USD Billion), by Sub-Segment 2, 2018-2029
      Figure 42: Latin America E-Liquids Market Forecast (USD Billion), by Sub-Segment 3, 2018-2029
      Figure 43: Latin America E-Liquids Market Forecast (USD Billion), by Others, 2018-2029
      Figure 44: Latin America E-Liquids Market Forecast (USD Billion), by Brazil, 2018-2029
      Figure 45: Latin America E-Liquids Market Forecast (USD Billion), by Mexico, 2018-2029
      Figure 46: Latin America E-Liquids Market Forecast (USD Billion), by Rest of Latin America, 2018-2029
      Figure 47: Europe E-Liquids Market Value Share (%), By Segment 1, 2022 & 2029
      Figure 48: Europe E-Liquids Market Forecast (USD Billion), by Sub-Segment 1, 2018-2029
      Figure 49: Europe E-Liquids Market Forecast (USD Billion), by Sub-Segment 2, 2018-2029
      Figure 50: Europe E-Liquids Market Value Share (%), By Segment 2, 2022 & 2029
      Figure 51: Europe E-Liquids Market Forecast (USD Billion), by Sub-Segment 1, 2018-2029
      Figure 52: Europe E-Liquids Market Forecast (USD Billion), by Sub-Segment 2, 2018-2029
      Figure 53: Europe E-Liquids Market Forecast (USD Billion), by Sub-Segment 3, 2018-2029
      Figure 54: Europe E-Liquids Market Forecast (USD Billion), by Others, 2018-2029
      Figure 55: Europe E-Liquids Market Value Share (%), By Segment 3, 2022 & 2029
      Figure 56: Europe E-Liquids Market Forecast (USD Billion), by Sub-Segment 1, 2018-2029
      Figure 57: Europe E-Liquids Market Forecast (USD Billion), by Sub-Segment 2, 2018-2029
      Figure 58: Europe E-Liquids Market Forecast (USD Billion), by Sub-Segment 3, 2018-2029
      Figure 59: Europe E-Liquids Market Forecast (USD Billion), by Others, 2018-2029
      Figure 60: Europe E-Liquids Market Forecast (USD Billion), by U.K., 2018-2029
      Figure 61: Europe E-Liquids Market Forecast (USD Billion), by Germany, 2018-2029
      Figure 62: Europe E-Liquids Market Forecast (USD Billion), by France, 2018-2029
      Figure 63: Europe E-Liquids Market Forecast (USD Billion), by Italy, 2018-2029
      Figure 64: Europe E-Liquids Market Forecast (USD Billion), by Spain, 2018-2029
      Figure 65: Europe E-Liquids Market Forecast (USD Billion), by Russia, 2018-2029
      Figure 66: Europe E-Liquids Market Forecast (USD Billion), by Rest of Europe, 2018-2029
      Figure 67: Asia Pacific E-Liquids Market Value Share (%), By Segment 1, 2022 & 2029
      Figure 68: Asia Pacific E-Liquids Market Forecast (USD Billion), by Sub-Segment 1, 2018-2029
      Figure 69: Asia Pacific E-Liquids Market Forecast (USD Billion), by Sub-Segment 2, 2018-2029
      Figure 70: Asia Pacific E-Liquids Market Value Share (%), By Segment 2, 2022 & 2029
      Figure 71: Asia Pacific E-Liquids Market Forecast (USD Billion), by Sub-Segment 1, 2018-2029
      Figure 72: Asia Pacific E-Liquids Market Forecast (USD Billion), by Sub-Segment 2, 2018-2029
      Figure 73: Asia Pacific E-Liquids Market Forecast (USD Billion), by Sub-Segment 3, 2018-2029
      Figure 74: Asia Pacific E-Liquids Market Forecast (USD Billion), by Others, 2018-2029
      Figure 75: Asia Pacific E-Liquids Market Value Share (%), By Segment 3, 2022 & 2029
      Figure 76: Asia Pacific E-Liquids Market Forecast (USD Billion), by Sub-Segment 1, 2018-2029
      Figure 77: Asia Pacific E-Liquids Market Forecast (USD Billion), by Sub-Segment 2, 2018-2029
      Figure 78: Asia Pacific E-Liquids Market Forecast (USD Billion), by Sub-Segment 3, 2018-2029
      Figure 79: Asia Pacific E-Liquids Market Forecast (USD Billion), by Others, 2018-2029
      Figure 80: Asia Pacific E-Liquids Market Forecast (USD Billion), by China, 2018-2029
      Figure 81: Asia Pacific E-Liquids Market Forecast (USD Billion), by India, 2018-2029
      Figure 82: Asia Pacific E-Liquids Market Forecast (USD Billion), by Japan, 2018-2029
      Figure 83: Asia Pacific E-Liquids Market Forecast (USD Billion), by Australia, 2018-2029
      Figure 84: Asia Pacific E-Liquids Market Forecast (USD Billion), by Southeast Asia, 2018-2029
      Figure 85: Asia Pacific E-Liquids Market Forecast (USD Billion), by Rest of Asia Pacific, 2018-2029
      Figure 86: Middle East & Africa E-Liquids Market Value Share (%), By Segment 1, 2022 & 2029
      Figure 87: Middle East & Africa E-Liquids Market Forecast (USD Billion), by Sub-Segment 1, 2018-2029
      Figure 88: Middle East & Africa E-Liquids Market Forecast (USD Billion), by Sub-Segment 2, 2018-2029
      Figure 89: Middle East & Africa E-Liquids Market Value Share (%), By Segment 2, 2022 & 2029
      Figure 90: Middle East & Africa E-Liquids Market Forecast (USD Billion), by Sub-Segment 1, 2018-2029
      Figure 91: Middle East & Africa E-Liquids Market Forecast (USD Billion), by Sub-Segment 2, 2018-2029
      Figure 92: Middle East & Africa E-Liquids Market Forecast (USD Billion), by Sub-Segment 3, 2018-2029
      Figure 93: Middle East & Africa E-Liquids Market Forecast (USD Billion), by Others, 2018-2029
      Figure 94: Middle East & Africa E-Liquids Market Value Share (%), By Segment 3, 2022 & 2029
      Figure 95: Middle East & Africa E-Liquids Market Forecast (USD Billion), by Sub-Segment 1, 2018-2029
      Figure 96: Middle East & Africa E-Liquids Market Forecast (USD Billion), by Sub-Segment 2, 2018-2029
      Figure 97: Middle East & Africa E-Liquids Market Forecast (USD Billion), by Sub-Segment 3, 2018-2029
      Figure 98: Middle East & Africa E-Liquids Market Forecast (USD Billion), by Others, 2018-2029
      Figure 99: Middle East & Africa E-Liquids Market Forecast (USD Billion), by GCC, 2018-2029
      Figure 100: Middle East & Africa E-Liquids Market Forecast (USD Billion), by South Africa, 2018-2029
      Figure 101: Middle East & Africa E-Liquids Market Forecast (USD Billion), by Rest of Middle East & Africa, 2018-2029 
      List of Tables
      Table 1: Global E-Liquids Market Revenue (USD Billion) Forecast, by Segment 1, 2018-2029
      Table 2: Global E-Liquids Market Revenue (USD Billion) Forecast, by Segment 2, 2018-2029
      Table 3: Global E-Liquids Market Revenue (USD Billion) Forecast, by Segment 3, 2018-2029
      Table 4: Global E-Liquids Market Revenue (USD Billion) Forecast, by Region, 2018-2029
      Table 5: North America E-Liquids Market Revenue (USD Billion) Forecast, by Segment 1, 2018-2029
      Table 6: North America E-Liquids Market Revenue (USD Billion) Forecast, by Segment 2, 2018-2029
      Table 7: North America E-Liquids Market Revenue (USD Billion) Forecast, by Segment 3, 2018-2029
      Table 8: North America E-Liquids Market Revenue (USD Billion) Forecast, by Country, 2018-2029
      Table 9: Europe E-Liquids Market Revenue (USD Billion) Forecast, by Segment 1, 2018-2029
      Table 10: Europe E-Liquids Market Revenue (USD Billion) Forecast, by Segment 2, 2018-2029
      Table 11: Europe E-Liquids Market Revenue (USD Billion) Forecast, by Segment 3, 2018-2029
      Table 12: Europe E-Liquids Market Revenue (USD Billion) Forecast, by Country, 2018-2029
      Table 13: Latin America E-Liquids Market Revenue (USD Billion) Forecast, by Segment 1, 2018-2029
      Table 14: Latin America E-Liquids Market Revenue (USD Billion) Forecast, by Segment 2, 2018-2029
      Table 15: Latin America E-Liquids Market Revenue (USD Billion) Forecast, by Segment 3, 2018-2029
      Table 16: Latin America E-Liquids Market Revenue (USD Billion) Forecast, by Country, 2018-2029
      Table 17: Asia Pacific E-Liquids Market Revenue (USD Billion) Forecast, by Segment 1, 2018-2029
      Table 18: Asia Pacific E-Liquids Market Revenue (USD Billion) Forecast, by Segment 2, 2018-2029
      Table 19: Asia Pacific E-Liquids Market Revenue (USD Billion) Forecast, by Segment 3, 2018-2029
      Table 20: Asia Pacific E-Liquids Market Revenue (USD Billion) Forecast, by Country, 2018-2029
      Table 21: Middle East & Africa E-Liquids Market Revenue (USD Billion) Forecast, by Segment 1, 2018-2029
      Table 22: Middle East & Africa E-Liquids Market Revenue (USD Billion) Forecast, by Segment 2, 2018-2029
      Table 23: Middle East & Africa E-Liquids Market Revenue (USD Billion) Forecast, by Segment 3, 2018-2029
      Table 24: Middle East & Africa E-Liquids Market Revenue (USD Billion) Forecast, by Country, 2018-2029
      Research Process

      Data Library Research are conducted by industry experts who offer insight on industry structure, market segmentations technology assessment and competitive landscape (CL), and penetration, as well as on emerging trends. Their analysis is based on primary interviews (~ 80%) and secondary research (~ 20%) as well as years of professional expertise in their respective industries. Adding to this, by analysing historical trends and current market positions, our analysts predict where the market will be headed for the next five years. Furthermore, the varying trends of segment & categories geographically presented are also studied and the estimated based on the primary & secondary research.

      In this particular report from the supply side Data Library Research has conducted primary surveys (interviews) with the key level executives (VP, CEO’s, Marketing Director, Business Development Manager and SOFT) of the companies that active & prominent as well as the midsized organization

      FIGURE 1: DLR RESEARH PROCESS

      research-methodology1

      Primary Research

      Extensive primary research was conducted to gain a deeper insight of the market and industry performance. The analysis is based on both primary and secondary research as well as years of professional expertise in the respective industries.

      In addition to analysing current and historical trends, our analysts predict where the market is headed over the next five years.

      It varies by segment for these categories geographically presented in the list of market tables. Speaking about this particular report we have conducted primary surveys (interviews) with the key level executives (VP, CEO’s, Marketing Director, Business Development Manager and many more) of the major players active in the market.

      Secondary Research

      Secondary research was mainly used to collect and identify information useful for the extensive, technical, market-oriented, and Friend’s study of the Global Extra Neutral Alcohol. It was also used to obtain key information about major players, market classification and segmentation according to the industry trends, geographical markets, and developments related to the market and technology perspectives. For this study, analysts have gathered information from various credible sources, such as annual reports, sec filings, journals, white papers, SOFT presentations, and company web sites.

      Market Size Estimation

      Both, top-down and bottom-up approaches were used to estimate and validate the size of the Global market and to estimate the size of various other dependent submarkets in the overall Extra Neutral Alcohol. The key players in the market were identified through secondary research and their market contributions in the respective geographies were determined through primary and secondary research.

      Forecast Model

      research-methodology2

      Happy to Assist You

      If you have a question?

      info@datalibraryresearch.com

      IND : +91 955 279 0357

      Browse Related Reports