Expandable Microspheres Overview and Analysis:

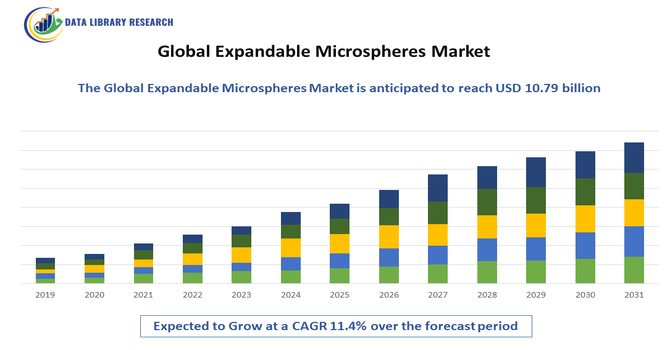
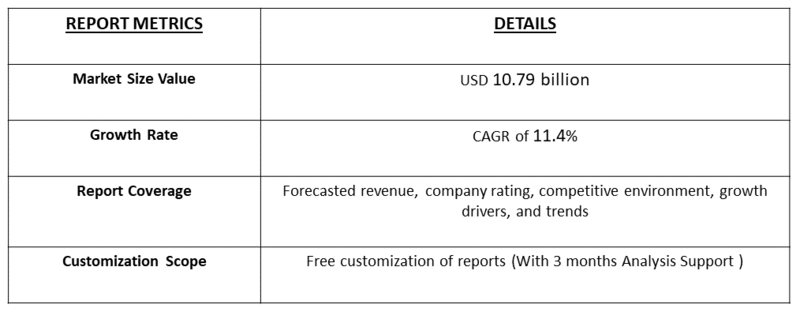
The Expandable Microspheres Market was valued at USD 5.07 billion in 2025 and is anticipated to register a CAGR of over 11.4% between 2024 and 2032, reaching USD 10.79 billion by 2032.

Expandable microspheres are tiny, hollow polymer spheres that contain a gas or liquid hydrocarbon inside. When heated, the internal material expands, causing the microspheres to enlarge dramatically while remaining lightweight. This unique property makes them highly valuable as lightweight fillers, foaming agents, and surface modifiers across multiple industries. They are widely used in plastics, coatings, adhesives, sealants, automotive parts, and packaging to reduce material density, lower production costs, and enhance performance. Their ability to provide thermal insulation, sound dampening, and smooth surface finishes further extends their applications, making expandable microspheres an increasingly important material in modern manufacturing and product design.

Expandable Microspheres Market Latest Trends:

Expandable microspheres are gaining strong traction across industries due to their lightweight, insulating, and cost-saving properties. A key trend driving the market is their rising use in packaging, construction, and automotive sectors, where reducing weight without compromising strength is a major goal. Sustainability is another factor, as microspheres help cut raw material usage and improve energy efficiency. Demand is also growing in paints, coatings, and sealants, where they enhance texture and durability. Emerging economies are showing increased adoption as manufacturers look for affordable, high-performance additives. Continuous innovations in microsphere technology, including bio-based and customized grades, are further boosting opportunities. Thus, overall, the market is moving toward eco-friendly, versatile solutions with broad industrial applications.

Segmentation:

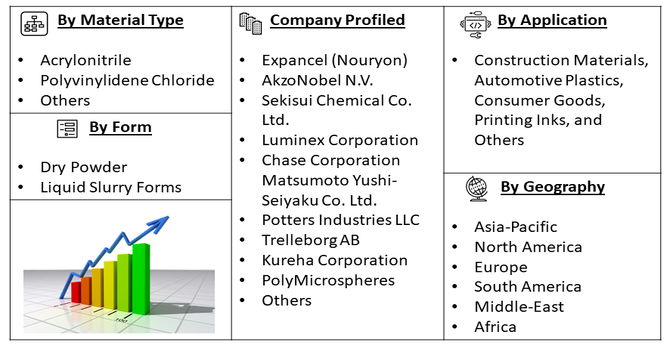
The Global Expandable Microspheres Market is Segmented by Material Type (Acrylonitrile, Polyvinylidene Chloride, and Others), Form (Dry Powder and Liquid Slurry Forms), Application (Construction Materials, Automotive Plastics, Consumer Goods, Printing Inks, and Others), and Geography (North America, Europe, Asia-Pacific, Latin America, and Middle East & Africa). The report provides the value (in USD million) for the above segments.

Market Drivers:

  • Growing Demand for Lightweight and Energy-Efficient Materials

The growing demand for lightweight and insulating materials in various industries, such as construction, automotive, and packaging, is a significant driver for the global expandable microspheres market.

Expandable microspheres offer a unique combination of low density, thermal insulation properties, and improved mechanical performance, making them an attractive choice for applications where weight reduction and thermal efficiency are crucial. For instance, in September 2025, The FDA approved SIR-Spheres Y-90 resin microspheres for patients with unresectable hepatocellular carcinoma (HCC) without macrovascular invasion and with well-compensated liver function. The approval was supported by the DOORwaY90 trial, which demonstrated a 98.5% overall response rate, 100% local tumor control, and a median response duration exceeding 300 days. With a favorable safety profile, SIR-Spheres position themselves as a strong first-line treatment option in the HCC market. Thus, the expandable microspheres market is poised for sustained growth, driven by rising demand for lightweight, sustainable, and high-performance materials across industries, with continuous innovations and regulatory milestones further strengthening its global adoption.

As industries increasingly prioritize sustainability and energy efficiency, the demand for expandable microspheres is expected to rise, as they enable the development of more eco-friendly and energy-efficient products.

  • Expanding Applications in the Construction Sector

The construction sector is a major end-use industry for expandable microspheres, and the segment is expected to witness significant growth in the coming years. Expandable microspheres are widely used in the production of lightweight concrete, insulation materials, and other construction products, helping to improve thermal and acoustic performance, reduce weight, and enhance the overall quality and durability of buildings. The growing emphasis on energy-efficient and sustainable construction practices, coupled with the increasing adoption of advanced building materials, is driving the demand for expandable microspheres in the construction industry.

Market Restraint:

  • High Raw Material Costs and Environmental Concerns:

One of the key restraints for the global expandable microspheres market is the high cost of raw materials, particularly the blowing agents and polymeric materials used in the production of these microspheres. The manufacturing process of expandable microspheres also involves the use of various chemicals and solvents, which can raise environmental concerns and increase the regulatory oversight on the industry. The need to address these environmental challenges and develop more sustainable production methods may hinder the growth of the expandable microspheres market, as companies must balance the demand for these products with the need to minimize their environmental impact.

Social Economic Impact On Expandable Microspheres Market

Socio-economically, microspheres help industries lower material and energy costs, reduce environmental impact, and support innovation in green products. Their adoption also stimulates new business opportunities in emerging economies, creating employment and enhancing competitiveness. Pre-COVID-19, the expandable microspheres market was expanding steadily, supported by automotive, packaging, and construction sectors that sought lightweight and cost-efficient materials, contributing to job creation and industrial growth. Post-COVID-19, the industry faced temporary setbacks due to supply chain disruptions and reduced manufacturing activity, but recovery was accelerated by booming e-commerce packaging, revival in construction projects, and renewed focus on sustainability. Thus, overall, the market plays a role in balancing industrial growth with sustainable development goals.

Segmental Analysis:

  • Polyvinylidene Chloride Segment is Expected to Witness Significant Growth Over the Forecasted Period

The Polyvinylidene Chloride (PVDC) segment of the expandable microspheres market is poised for substantial growth due to its unique combination of properties, particularly its excellent barrier capabilities and flame retardancy. PVDC microspheres are highly valued in packaging applications for their ability to prevent the permeation of gases and moisture, extending the shelf life of food and pharmaceutical products.

Furthermore, their inherent flame-retardant nature makes them ideal for use in construction materials, textiles, and electronics where fire safety is paramount. As regulatory standards for safety and product preservation become more stringent globally, the demand for PVDC-based expandable microspheres is expected to rise significantly, driving expansion in this specific product category.

  • Liquid Slurry Forms Segment is Expected to Witness Significant Growth Over the Forecasted Period

The liquid slurry forms segment of expandable microspheres is anticipated to experience notable growth, owing to its enhanced handling, dosing accuracy, and application efficiency. Liquid slurries provide a pre-dispersed, homogeneous mixture that simplifies integration into various manufacturing processes, particularly in water-based systems like paints, coatings, adhesives, and construction materials. This form reduces dusting, improves workplace safety, and ensures more consistent dispersion and final product quality compared to dry powders. As end-user industries prioritize operational efficiency, reduced waste, and easier processing, the adoption of convenient and performance-optimized liquid slurry formulations is expected to accelerate, driving robust growth in this segment.

  • Construction Segment is Expected to Witness Significant Growth Over the Forecasted Period

The construction segment is projected to be a major growth avenue for expandable microspheres, fueled by the global push towards energy-efficient and sustainable building practices. These microspheres are extensively used as lightweight fillers in concrete, plaster, and screeds to reduce structural load and enhance thermal insulation properties, thereby lowering energy consumption in buildings. Their ability to improve crack resistance, durability, and workability of construction materials makes them highly valuable. With rising urbanization, infrastructure development, and stringent building energy codes worldwide, the demand for high-performance, lightweight construction materials is surging, positioning this segment for significant expansion over the forecast period.

  • Asia Pacific Region Segment is Expected to Witness Significant Growth Over the Forecasted Period

The Asia Pacific region is set to dominate and exhibit the highest growth in the expandable microspheres market, driven by robust industrial and infrastructural expansion. China, India, Japan, and South Korea are key contributors, with booming construction sectors, rapidly growing automotive production, and strong manufacturing bases for plastics, paints, and coatings. Government initiatives promoting infrastructure development, urbanization, and investments in lightweight materials for energy efficiency further propel demand.

The presence of major global players and low-cost manufacturing capabilities also strengthens the supply chain. For instance, In June 2023, Matsumoto Yushi-Seiyaku expanded its microsphere production capacity in China to strengthen its presence in the rapidly growing Asian construction market. This strategic move enabled the company to meet rising regional demand for lightweight and high-performance materials used in insulation, coatings, and building products. By increasing local production, Matsumoto Yushi-Seiyaku reduced supply chain dependencies, improved cost efficiency, and positioned itself to capture greater market share in Asia’s infrastructure and urban development boom. The expansion also reflected the company’s long-term commitment to innovation and sustainability in the microsphere market, addressing customer needs for energy-efficient and eco-friendly construction solutions. This combination of high demand, supportive policies, and production capacity makes Asia Pacific the fastest-growing and largest regional market.

Expandable Microspheres Market Competitive Landscape:

The competitive landscape of the global expandable microspheres market is characterized by intense rivalry among key players such as Kureha Corporation, Nouryon, and Crerax, which focus on product innovation, strategic partnerships, and acquisitions to strengthen their market positions. These companies invest in developing advanced microsphere materials tailored for diverse applications like medical, automotive, and construction. Market leaders leverage technological advancements to enhance microsphere properties such as biocompatibility, controlled expansion, and lightweight performance. Geographic expansion, particularly in Asia-Pacific and Europe, is a central growth strategy. The market is also witnessing consolidation trends as players aim to capture increasing demand in emerging industries while responding to environmental regulations and raw material cost fluctuations, maintaining a dynamic and evolving competitive environment.

The 10 major players in the global expandable microspheres market are:

  • Expancel (Nouryon)
  • AkzoNobel N.V.
  • Sekisui Chemical Co. Ltd.
  • Luminex Corporation
  • Chase Corporation Matsumoto Yushi-Seiyaku Co. Ltd.
  • Potters Industries LLC
  • Trelleborg AB
  • Kureha Corporation
  • PolyMicrospheres

Recent Developments:

  • In September 2025, Varian, a Siemens Healthineers company, announced that its Embozene microspheres had received CE Marking for Genicular Artery Embolisation (GAE) in knee osteoarthritis, making it the first embolic agent approved for this procedure. With knee osteoarthritis affecting over 375 million people worldwide and current therapies offering only temporary relief, this milestone highlighted a significant market opportunity for microsphere-based solutions that address unmet patient needs and delay invasive surgery.
  • In December 2024, Nouryon launched its product concept, Expancel® BIO microspheres, at the 2024 Foam Expo Europe in Stuttgart, Germany. This groundbreaking concept for expandable microspheres marked a major advancement in Nouryon’s innovation portfolio, introducing a partially biobased and high-performance lightweight filler and blowing agent that addressed the evolving needs of the market.


Frequently Asked Questions (FAQ) :

Q1. What are the main growth driving factors for this market?

The increasing demand for lightweight and insulating materials in various industries, such as construction, automotive, and packaging, is the primary driver of the global expandable microspheres market.

Q2. What are the main restraining factors for this market?

The market faces challenges from fluctuating raw material prices and stringent environmental regulations that restrict the use of certain additives. Additionally, manufacturing complexities and competition from alternative lightweight materials may restrain growth, particularly impacting cost-sensitive segments and slowing widespread adoption in developing regions.

Q3. Which segment is expected to witness high growth?

The construction segment is expected to witness high growth due to rising demand for thermal insulation and lightweight filler materials. Additionally, specialized applications in aerospace, medical devices, and oil & gas are projected to accelerate growth notably during 2030–2035, reflecting broader adoption in high-performance and emerging industries.

Q4. Who are the top major players for this market?

Key players in the market include Kureha Corporation (Japan), Nouryon (Netherlands), Crerax (China), along with industry leaders such as BASF, AkzoNobel, and 3M. These companies focus on product innovation and expanding application areas to capture significant market shares.

Q5. Which country is the largest player?

China is the largest market for expandable microspheres, exhibiting the highest growth rate of approximately 15.4%. Driven by rapid industrialization, expanding automotive and construction sectors, and government support for medical device innovation, China leads regional and global demand.

Expandable Microspheres MARKET STUDY GLOBAL MARKET ANALYSIS, INSIGHTS AND FORECAST, 2023-2030

    1. Introduction

    • 1.1. Research Scope
    • 1.2. Market Segmentation
    • 1.3. Research Methodology
    • 1.4. Definitions and Assumptions

    2. Executive Summary

      3. Market Dynamics

      • 3.1. Market Drivers
      • 3.2. Market Restraints
      • 3.3. Market Opportunities

      4. Key Insights

      • 4.1. Key Emerging Trends – For Major Countries
      • 4.2. Latest Technological Advancement
      • 4.3. Regulatory Landscape
      • 4.4. Industry SWOT Analysis
      • 4.5. Porters Five Forces Analysis

      5. Global Expandable Microspheres Market Analysis (USD Billion), Insights and Forecast, 2016-2030

      • 5.1. Key Findings / Summary
      • 5.2. Market Analysis, Insights and Forecast – By Segment 1
        • 5.2.1. Sub-Segment 1
        • 5.2.2. Sub-Segment 2
      • 5.3. Market Analysis, Insights and Forecast – By Segment 2
        • 5.3.1. Sub-Segment 1
        • 5.3.2. Sub-Segment 2
        • 5.3.3. Sub-Segment 3
        • 5.3.4. Others
      • 5.4. Market Analysis, Insights and Forecast – By Segment 3
        • 5.4.1. Sub-Segment 1
        • 5.4.2. Sub-Segment 2
        • 5.4.3. Sub-Segment 3
        • 5.4.4. Others
      • 5.5. Market Analysis, Insights and Forecast – By Region
        • 5.5.1. North America
        • 5.5.2. Latin America
        • 5.5.3. Europe
        • 5.5.4. Asia Pacific
        • 5.5.5. Middle East and Africa

      6. North America Expandable Microspheres Market Analysis (USD Billion), Insights and Forecast, 2016-2030

      • 6.1. Key Findings / Summary
      • 6.2. Market Analysis, Insights and Forecast – By Segment 1
        • 6.2.1. Sub-Segment 1
        • 6.2.2. Sub-Segment 2
      • 6.3. Market Analysis, Insights and Forecast – By Segment 2
        • 6.3.1. Sub-Segment 1
        • 6.3.2. Sub-Segment 2
        • 6.3.3. Sub-Segment 3
        • 6.3.4. Others
      • 6.4. Market Analysis, Insights and Forecast – By Segment 3
        • 6.4.1. Sub-Segment 1
        • 6.4.2. Sub-Segment 2
        • 6.4.3. Sub-Segment 3
        • 6.4.4. Others
      • 6.5. Market Analysis, Insights and Forecast – By Country
        • 6.5.1. U.S.
        • 6.5.2. Canada

      7. Latin America Expandable Microspheres Market Analysis (USD Billion), Insights and Forecast, 2016-2030

      • 7.1. Key Findings / Summary
      • 7.2. Market Analysis, Insights and Forecast – By Segment 1
        • 7.2.1. Sub-Segment 1
        • 7.2.2. Sub-Segment 2
      • 7.3. Market Analysis, Insights and Forecast – By Segment 2
        • 7.3.1. Sub-Segment 1
        • 7.3.2. Sub-Segment 2
        • 7.3.3. Sub-Segment 3
        • 7.3.4. Others
      • 7.4. Market Analysis, Insights and Forecast – By Segment 3
        • 7.4.1. Sub-Segment 1
        • 7.4.2. Sub-Segment 2
        • 7.4.3. Sub-Segment 3
        • 7.4.4. Others
      • 7.5. Insights and Forecast – By Country
        • 7.5.1. Brazil
        • 7.5.2. Mexico
        • 7.5.3. Rest of Latin America

      8. Europe Expandable Microspheres Market Analysis (USD Billion), Insights and Forecast, 2016-2030

      • 8.1. Key Findings / Summary
      • 8.2. Market Analysis, Insights and Forecast – By Segment 1
        • 8.2.1. Sub-Segment 1
        • 8.2.2. Sub-Segment 2
      • 8.3. Market Analysis, Insights and Forecast – By Segment 2
        • 8.3.1. Sub-Segment 1
        • 8.3.2. Sub-Segment 2
        • 8.3.3. Sub-Segment 3
        • 8.3.4. Others
      • 8.4. Market Analysis, Insights and Forecast – By Segment 3
        • 8.4.1. Sub-Segment 1
        • 8.4.2. Sub-Segment 2
        • 8.4.3. Sub-Segment 3
        • 8.4.4. Others
      • 8.5. Market Analysis, Insights and Forecast – By Country
        • 8.5.1. UK
        • 8.5.2. Germany
        • 8.5.3. France
        • 8.5.4. Italy
        • 8.5.5. Spain
        • 8.5.6. Russia
        • 8.5.7. Rest of Europe

      9. Asia Pacific Expandable Microspheres Market Analysis (USD Billion), Insights and Forecast, 2016-2030

      • 9.1. Key Findings / Summary
      • 9.2. Market Analysis, Insights and Forecast – By Segment 1
        • 9.2.1. Sub-Segment 1
        • 9.2.2. Sub-Segment 2
      • 9.3. Market Analysis, Insights and Forecast – By Segment 2
        • 9.3.1. Sub-Segment 1
        • 9.3.2. Sub-Segment 2
        • 9.3.3. Sub-Segment 3
        • 9.3.4. Others
      • 9.4. Market Analysis, Insights and Forecast – By Segment 3
        • 9.4.1. Sub-Segment 1
        • 9.4.2. Sub-Segment 2
        • 9.4.3. Sub-Segment 3
        • 9.4.4. Others
      • 9.5. Market Analysis, Insights and Forecast – By Country
        • 9.5.1. China
        • 9.5.2. India
        • 9.5.3. Japan
        • 9.5.4. Australia
        • 9.5.5. South East Asia
        • 9.5.6. Rest of Asia Pacific

      10. Middle East & Africa Expandable Microspheres Market Analysis (USD Billion), Insights and Forecast, 2016-2030

      • 10.1. Key Findings / Summary
      • 10.2. Market Analysis, Insights and Forecast – By Segment 1
        • 10.2.1. Sub-Segment 1
        • 10.2.2. Sub-Segment 2
      • 10.3. Market Analysis, Insights and Forecast – By Segment 2
        • 10.3.1. Sub-Segment 1
        • 10.3.2. Sub-Segment 2
        • 10.3.3. Sub-Segment 3
        • 10.3.4. Others
      • 10.4. Market Analysis, Insights and Forecast – By Segment 3
        • 10.4.1. Sub-Segment 1
        • 10.4.2. Sub-Segment 2
        • 10.4.3. Sub-Segment 3
        • 10.4.4. Others
      • 10.5. Market Analysis, Insights and Forecast – By Country
        • 10.5.1. GCC
        • 10.5.2. South Africa
        • 10.5.3. Rest of Middle East & Africa

      11. Competitive Analysis

      • 11.1. Company Market Share Analysis, 2018
      • 11.2. Key Industry Developments
      • 11.3. Company Profile
        • 11.3.1. Company 1
          • 11.3.1.1. Business Overview
          • 11.3.1.2. Segment 1 & Service Offering
          • 11.3.1.3. Overall Revenue
          • 11.3.1.4. Geographic Presence
          • 11.3.1.5. Recent Development
        *Similar details will be provided for the following companies
        • 11.3.2. Company 2
        • 11.3.3. Company 3
        • 11.3.4. Company 4
        • 11.3.5. Company 5
        • 11.3.6. Company 6
        • 11.3.7. Company 7
        • 11.3.8. Company 8
        • 11.3.9. Company 9
        • 11.3.10. Company 10
        • 11.3.11. Company 11
        • 11.3.12. Company 12
      List of Figures

      Figure 1: Global Expandable Microspheres Market Revenue Breakdown (USD Billion, %) by Region, 2023 & 2030
      Figure 2: Global Expandable Microspheres Market Value Share (%), By Segment 1, 2023 & 2030
      Figure 3: Global Expandable Microspheres Market Forecast (USD Billion), by Sub-Segment 1, 2018-2030
      Figure 4: Global Expandable Microspheres Market Forecast (USD Billion), by Sub-Segment 2, 2018-2030
      Figure 5: Global Expandable Microspheres Market Value Share (%), By Segment 2, 2023 & 2030
      Figure 6: Global Expandable Microspheres Market Forecast (USD Billion), by Sub-Segment 1, 2018-2030
      Figure 7: Global Expandable Microspheres Market Forecast (USD Billion), by Sub-Segment 2, 2018-2030
      Figure 8: Global Expandable Microspheres Market Forecast (USD Billion), by Sub-Segment 3, 2018-2030
      Figure 9: Global Expandable Microspheres Market Forecast (USD Billion), by Others, 2018-2030
      Figure 10: Global Expandable Microspheres Market Value Share (%), By Segment 3, 2023 & 2030
      Figure 11: Global Expandable Microspheres Market Forecast (USD Billion), by Sub-Segment 1, 2018-2030
      Figure 12: Global Expandable Microspheres Market Forecast (USD Billion), by Sub-Segment 2, 2018-2030
      Figure 13: Global Expandable Microspheres Market Forecast (USD Billion), by Sub-Segment 3, 2018-2030
      Figure 14: Global Expandable Microspheres Market Forecast (USD Billion), by Others, 2018-2030
      Figure 15: Global Expandable Microspheres Market Value (USD Billion), by Region, 2023 & 2030
      Figure 16: North America Expandable Microspheres Market Value Share (%), By Segment 1, 2023 & 2030
      Figure 17: North America Expandable Microspheres Market Forecast (USD Billion), by Sub-Segment 1, 2018-2030
      Figure 18: North America Expandable Microspheres Market Forecast (USD Billion), by Sub-Segment 2, 2018-2030
      Figure 19: North America Expandable Microspheres Market Value Share (%), By Segment 2, 2023 & 2030
      Figure 20: North America Expandable Microspheres Market Forecast (USD Billion), by Sub-Segment 1, 2018-2030
      Figure 21: North America Expandable Microspheres Market Forecast (USD Billion), by Sub-Segment 2, 2018-2030
      Figure 22: North America Expandable Microspheres Market Forecast (USD Billion), by Sub-Segment 3, 2018-2030
      Figure 23: North America Expandable Microspheres Market Forecast (USD Billion), by Others, 2018-2030
      Figure 24: North America Expandable Microspheres Market Value Share (%), By Segment 3, 2023 & 2030
      Figure 25: North America Expandable Microspheres Market Forecast (USD Billion), by Sub-Segment 1, 2018-2030
      Figure 26: North America Expandable Microspheres Market Forecast (USD Billion), by Sub-Segment 2, 2018-2030
      Figure 27: North America Expandable Microspheres Market Forecast (USD Billion), by Sub-Segment 3, 2018-2030
      Figure 28: North America Expandable Microspheres Market Forecast (USD Billion), by Others, 2018-2030
      Figure 29: North America Expandable Microspheres Market Forecast (USD Billion), by U.S., 2018-2030
      Figure 30: North America Expandable Microspheres Market Forecast (USD Billion), by Canada, 2018-2030
      Figure 31: Latin America Expandable Microspheres Market Value Share (%), By Segment 1, 2023 & 2030
      Figure 32: Latin America Expandable Microspheres Market Forecast (USD Billion), by Sub-Segment 1, 2018-2030
      Figure 33: Latin America Expandable Microspheres Market Forecast (USD Billion), by Sub-Segment 2, 2018-2030
      Figure 34: Latin America Expandable Microspheres Market Value Share (%), By Segment 2, 2023 & 2030
      Figure 35: Latin America Expandable Microspheres Market Forecast (USD Billion), by Sub-Segment 1, 2018-2030
      Figure 36: Latin America Expandable Microspheres Market Forecast (USD Billion), by Sub-Segment 2, 2018-2030
      Figure 37: Latin America Expandable Microspheres Market Forecast (USD Billion), by Sub-Segment 3, 2018-2030
      Figure 38: Latin America Expandable Microspheres Market Forecast (USD Billion), by Others, 2018-2030
      Figure 39: Latin America Expandable Microspheres Market Value Share (%), By Segment 3, 2023 & 2030
      Figure 40: Latin America Expandable Microspheres Market Forecast (USD Billion), by Sub-Segment 1, 2018-2030
      Figure 41: Latin America Expandable Microspheres Market Forecast (USD Billion), by Sub-Segment 2, 2018-2030
      Figure 42: Latin America Expandable Microspheres Market Forecast (USD Billion), by Sub-Segment 3, 2018-2030
      Figure 43: Latin America Expandable Microspheres Market Forecast (USD Billion), by Others, 2018-2030
      Figure 44: Latin America Expandable Microspheres Market Forecast (USD Billion), by Brazil, 2018-2030
      Figure 45: Latin America Expandable Microspheres Market Forecast (USD Billion), by Mexico, 2018-2030
      Figure 46: Latin America Expandable Microspheres Market Forecast (USD Billion), by Rest of Latin America, 2018-2030
      Figure 47: Europe Expandable Microspheres Market Value Share (%), By Segment 1, 2023 & 2030
      Figure 48: Europe Expandable Microspheres Market Forecast (USD Billion), by Sub-Segment 1, 2018-2030
      Figure 49: Europe Expandable Microspheres Market Forecast (USD Billion), by Sub-Segment 2, 2018-2030
      Figure 50: Europe Expandable Microspheres Market Value Share (%), By Segment 2, 2023 & 2030
      Figure 51: Europe Expandable Microspheres Market Forecast (USD Billion), by Sub-Segment 1, 2018-2030
      Figure 52: Europe Expandable Microspheres Market Forecast (USD Billion), by Sub-Segment 2, 2018-2030
      Figure 53: Europe Expandable Microspheres Market Forecast (USD Billion), by Sub-Segment 3, 2018-2030
      Figure 54: Europe Expandable Microspheres Market Forecast (USD Billion), by Others, 2018-2030
      Figure 55: Europe Expandable Microspheres Market Value Share (%), By Segment 3, 2023 & 2030
      Figure 56: Europe Expandable Microspheres Market Forecast (USD Billion), by Sub-Segment 1, 2018-2030
      Figure 57: Europe Expandable Microspheres Market Forecast (USD Billion), by Sub-Segment 2, 2018-2030
      Figure 58: Europe Expandable Microspheres Market Forecast (USD Billion), by Sub-Segment 3, 2018-2030
      Figure 59: Europe Expandable Microspheres Market Forecast (USD Billion), by Others, 2018-2030
      Figure 60: Europe Expandable Microspheres Market Forecast (USD Billion), by U.K., 2018-2030
      Figure 61: Europe Expandable Microspheres Market Forecast (USD Billion), by Germany, 2018-2030
      Figure 62: Europe Expandable Microspheres Market Forecast (USD Billion), by France, 2018-2030
      Figure 63: Europe Expandable Microspheres Market Forecast (USD Billion), by Italy, 2018-2030
      Figure 64: Europe Expandable Microspheres Market Forecast (USD Billion), by Spain, 2018-2030
      Figure 65: Europe Expandable Microspheres Market Forecast (USD Billion), by Russia, 2018-2030
      Figure 66: Europe Expandable Microspheres Market Forecast (USD Billion), by Rest of Europe, 2018-2030
      Figure 67: Asia Pacific Expandable Microspheres Market Value Share (%), By Segment 1, 2023 & 2030
      Figure 68: Asia Pacific Expandable Microspheres Market Forecast (USD Billion), by Sub-Segment 1, 2018-2030
      Figure 69: Asia Pacific Expandable Microspheres Market Forecast (USD Billion), by Sub-Segment 2, 2018-2030
      Figure 70: Asia Pacific Expandable Microspheres Market Value Share (%), By Segment 2, 2023 & 2030
      Figure 71: Asia Pacific Expandable Microspheres Market Forecast (USD Billion), by Sub-Segment 1, 2018-2030
      Figure 72: Asia Pacific Expandable Microspheres Market Forecast (USD Billion), by Sub-Segment 2, 2018-2030
      Figure 73: Asia Pacific Expandable Microspheres Market Forecast (USD Billion), by Sub-Segment 3, 2018-2030
      Figure 74: Asia Pacific Expandable Microspheres Market Forecast (USD Billion), by Others, 2018-2030
      Figure 75: Asia Pacific Expandable Microspheres Market Value Share (%), By Segment 3, 2023 & 2030
      Figure 76: Asia Pacific Expandable Microspheres Market Forecast (USD Billion), by Sub-Segment 1, 2018-2030
      Figure 77: Asia Pacific Expandable Microspheres Market Forecast (USD Billion), by Sub-Segment 2, 2018-2030
      Figure 78: Asia Pacific Expandable Microspheres Market Forecast (USD Billion), by Sub-Segment 3, 2018-2030
      Figure 79: Asia Pacific Expandable Microspheres Market Forecast (USD Billion), by Others, 2018-2030
      Figure 80: Asia Pacific Expandable Microspheres Market Forecast (USD Billion), by China, 2018-2030
      Figure 81: Asia Pacific Expandable Microspheres Market Forecast (USD Billion), by India, 2018-2030
      Figure 82: Asia Pacific Expandable Microspheres Market Forecast (USD Billion), by Japan, 2018-2030
      Figure 83: Asia Pacific Expandable Microspheres Market Forecast (USD Billion), by Australia, 2018-2030
      Figure 84: Asia Pacific Expandable Microspheres Market Forecast (USD Billion), by Southeast Asia, 2018-2030
      Figure 85: Asia Pacific Expandable Microspheres Market Forecast (USD Billion), by Rest of Asia Pacific, 2018-2030
      Figure 86: Middle East & Africa Expandable Microspheres Market Value Share (%), By Segment 1, 2023 & 2030
      Figure 87: Middle East & Africa Expandable Microspheres Market Forecast (USD Billion), by Sub-Segment 1, 2018-2030
      Figure 88: Middle East & Africa Expandable Microspheres Market Forecast (USD Billion), by Sub-Segment 2, 2018-2030
      Figure 89: Middle East & Africa Expandable Microspheres Market Value Share (%), By Segment 2, 2023 & 2030
      Figure 90: Middle East & Africa Expandable Microspheres Market Forecast (USD Billion), by Sub-Segment 1, 2018-2030
      Figure 91: Middle East & Africa Expandable Microspheres Market Forecast (USD Billion), by Sub-Segment 2, 2018-2030
      Figure 92: Middle East & Africa Expandable Microspheres Market Forecast (USD Billion), by Sub-Segment 3, 2018-2030
      Figure 93: Middle East & Africa Expandable Microspheres Market Forecast (USD Billion), by Others, 2018-2030
      Figure 94: Middle East & Africa Expandable Microspheres Market Value Share (%), By Segment 3, 2023 & 2030
      Figure 95: Middle East & Africa Expandable Microspheres Market Forecast (USD Billion), by Sub-Segment 1, 2018-2030
      Figure 96: Middle East & Africa Expandable Microspheres Market Forecast (USD Billion), by Sub-Segment 2, 2018-2030
      Figure 97: Middle East & Africa Expandable Microspheres Market Forecast (USD Billion), by Sub-Segment 3, 2018-2030
      Figure 98: Middle East & Africa Expandable Microspheres Market Forecast (USD Billion), by Others, 2018-2030
      Figure 99: Middle East & Africa Expandable Microspheres Market Forecast (USD Billion), by GCC, 2018-2030
      Figure 100: Middle East & Africa Expandable Microspheres Market Forecast (USD Billion), by South Africa, 2018-2030
      Figure 101: Middle East & Africa Expandable Microspheres Market Forecast (USD Billion), by Rest of Middle East & Africa, 2018-2030 
      List of Tables
      Table 1: Global Expandable Microspheres Market Revenue (USD Billion) Forecast, by Segment 1, 2018-2030
      Table 2: Global Expandable Microspheres Market Revenue (USD Billion) Forecast, by Segment 2, 2018-2030
      Table 3: Global Expandable Microspheres Market Revenue (USD Billion) Forecast, by Segment 3, 2018-2030
      Table 4: Global Expandable Microspheres Market Revenue (USD Billion) Forecast, by Region, 2018-2030
      Table 5: North America Expandable Microspheres Market Revenue (USD Billion) Forecast, by Segment 1, 2018-2030
      Table 6: North America Expandable Microspheres Market Revenue (USD Billion) Forecast, by Segment 2, 2018-2030
      Table 7: North America Expandable Microspheres Market Revenue (USD Billion) Forecast, by Segment 3, 2018-2030
      Table 8: North America Expandable Microspheres Market Revenue (USD Billion) Forecast, by Country, 2018-2030
      Table 9: Europe Expandable Microspheres Market Revenue (USD Billion) Forecast, by Segment 1, 2018-2030
      Table 10: Europe Expandable Microspheres Market Revenue (USD Billion) Forecast, by Segment 2, 2018-2030
      Table 11: Europe Expandable Microspheres Market Revenue (USD Billion) Forecast, by Segment 3, 2018-2030
      Table 12: Europe Expandable Microspheres Market Revenue (USD Billion) Forecast, by Country, 2018-2030
      Table 13: Latin America Expandable Microspheres Market Revenue (USD Billion) Forecast, by Segment 1, 2018-2030
      Table 14: Latin America Expandable Microspheres Market Revenue (USD Billion) Forecast, by Segment 2, 2018-2030
      Table 15: Latin America Expandable Microspheres Market Revenue (USD Billion) Forecast, by Segment 3, 2018-2030
      Table 16: Latin America Expandable Microspheres Market Revenue (USD Billion) Forecast, by Country, 2018-2030
      Table 17: Asia Pacific Expandable Microspheres Market Revenue (USD Billion) Forecast, by Segment 1, 2018-2030
      Table 18: Asia Pacific Expandable Microspheres Market Revenue (USD Billion) Forecast, by Segment 2, 2018-2030
      Table 19: Asia Pacific Expandable Microspheres Market Revenue (USD Billion) Forecast, by Segment 3, 2018-2030
      Table 20: Asia Pacific Expandable Microspheres Market Revenue (USD Billion) Forecast, by Country, 2018-2030
      Table 21: Middle East & Africa Expandable Microspheres Market Revenue (USD Billion) Forecast, by Segment 1, 2018-2030
      Table 22: Middle East & Africa Expandable Microspheres Market Revenue (USD Billion) Forecast, by Segment 2, 2018-2030
      Table 23: Middle East & Africa Expandable Microspheres Market Revenue (USD Billion) Forecast, by Segment 3, 2018-2030
      Table 24: Middle East & Africa Expandable Microspheres Market Revenue (USD Billion) Forecast, by Country, 2018-2030
      Research Process

      Data Library Research are conducted by industry experts who offer insight on industry structure, market segmentations technology assessment and competitive landscape (CL), and penetration, as well as on emerging trends. Their analysis is based on primary interviews (~ 80%) and secondary research (~ 20%) as well as years of professional expertise in their respective industries. Adding to this, by analysing historical trends and current market positions, our analysts predict where the market will be headed for the next five years. Furthermore, the varying trends of segment & categories geographically presented are also studied and the estimated based on the primary & secondary research.

      In this particular report from the supply side Data Library Research has conducted primary surveys (interviews) with the key level executives (VP, CEO’s, Marketing Director, Business Development Manager and SOFT) of the companies that active & prominent as well as the midsized organization

      FIGURE 1: DLR RESEARH PROCESS

      research-methodology1

      Primary Research

      Extensive primary research was conducted to gain a deeper insight of the market and industry performance. The analysis is based on both primary and secondary research as well as years of professional expertise in the respective industries.

      In addition to analysing current and historical trends, our analysts predict where the market is headed over the next five years.

      It varies by segment for these categories geographically presented in the list of market tables. Speaking about this particular report we have conducted primary surveys (interviews) with the key level executives (VP, CEO’s, Marketing Director, Business Development Manager and many more) of the major players active in the market.

      Secondary Research

      Secondary research was mainly used to collect and identify information useful for the extensive, technical, market-oriented, and Friend’s study of the Global Extra Neutral Alcohol. It was also used to obtain key information about major players, market classification and segmentation according to the industry trends, geographical markets, and developments related to the market and technology perspectives. For this study, analysts have gathered information from various credible sources, such as annual reports, sec filings, journals, white papers, SOFT presentations, and company web sites.

      Market Size Estimation

      Both, top-down and bottom-up approaches were used to estimate and validate the size of the Global market and to estimate the size of various other dependent submarkets in the overall Extra Neutral Alcohol. The key players in the market were identified through secondary research and their market contributions in the respective geographies were determined through primary and secondary research.

      Forecast Model

      research-methodology2

      Happy to Assist You

      If you have a question?

      info@datalibraryresearch.com

      IND : +91 955 279 0357

      Browse Related Reports