Get Complete Analysis Of The Report - Download Updated Free Sample PDF
The Global Fuel Cell Yacht Market is being propelled by a confluence of decarbonization pressures, luxury-market demand for quiet zero-emission propulsion, and rapid technological progress in fuel cells and hydrogen systems: stricter maritime emissions targets and owner demand for cleaner credentials are accelerating interest in hydrogen fuel cells as an alternative to diesel, especially for high-end yachts and superyachts that value silent operation and emission-free cruising; improvements in fuel-cell efficiency, cost declines from scale, and better integration with battery-hybrid systems are making fuel-cell powertrains technically and commercially more attractive.
The latest trends in the Global Fuel Cell Yacht Market highlight the rapid transition toward sustainable luxury boating through hydrogen-powered propulsion systems. Leading yacht manufacturers are increasingly adopting proton exchange membrane (PEM) fuel cells and solid oxide fuel cells (SOFCs) to deliver quiet, zero-emission cruising experiences, catering to environmentally conscious high-net-worth buyers. A growing number of hybrid yacht models are integrating fuel cells with battery-electric systems for improved efficiency and extended range. Additionally, there is a surge in partnerships between fuel cell developers and marine engineering firms, aiming to enhance onboard hydrogen storage safety and optimize space utilization. Governments and classification societies are also introducing regulatory frameworks and pilot projects to support hydrogen infrastructure at marinas and ports.
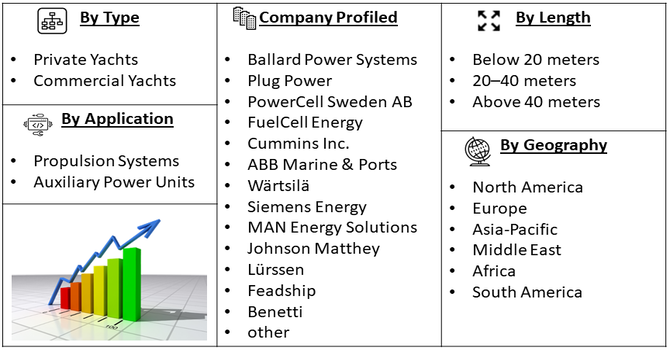
Segmentation: Global Fuel Cell Yacht Market is segmented By Type (Private Yachts, Commercial Yachts), Fuel Cell Type (Proton Exchange Membrane (PEM) Fuel Cells, Solid Oxide Fuel Cells), Application (Propulsion Systems, Auxiliary Power Units), Length (Below 20 meters, 20–40 meters, Above 40 meters), and Geography (North America, Europe, Asia-Pacific, Middle East and Africa, and South America). The report provides the value (in USD million) for the above segments.
For Detailed Market Segmentation - Get a Free Sample PDF
Market Drivers:
Growing environmental awareness and stricter global maritime emission regulations are driving yacht manufacturers and owners to adopt cleaner propulsion systems. For instance, April 2025, The International Maritime Organization advanced a legally binding framework to cut global ship GHG emissions, targeting net-zero around 2050. Approved during MEPC 83 in April 2025, the framework introduced mandatory emissions limits, a new fuel standard, and a global GHG pricing mechanism. These measures strengthened maritime emission regulations and accelerated adoption of alternative propulsion technologies, including fuel cells, positively influencing the global fuel cell yacht market by encouraging sustainable vessel design and cleaner marine operations.
Fuel cell technology offers zero greenhouse gas emissions, low noise, and high efficiency, making it an ideal alternative to traditional diesel engines. The luxury yacht market, in particular, is witnessing a shift toward eco-friendly solutions as wealthy consumers prioritize sustainability and innovative green technologies in their vessel choices.
Continuous innovation in fuel cell efficiency, hydrogen storage, and onboard integration is significantly enhancing the performance and safety of fuel cell-powered yachts. Advancements such as lightweight composite hydrogen tanks, hybrid systems combining fuel cells and batteries, and modular fuel cell stacks are reducing operating costs and improving range.
Additionally, increased R&D investment and collaboration among yacht builders, fuel cell developers, and energy companies are accelerating commercialization, driving steady market growth. For instance, in September 2025, Lloyd’s Register signed a contract with Oceanco to provide classification and certification for the world’s largest yacht support vessel, announced at the Monaco Yacht Show. Building on a 38-year partnership, the vessel exceeded 100 meters, featured extended range, heavy-duty logistics, and energy-efficient systems designed for alternative fuels. This project advanced the adoption of sustainable propulsion technologies and reinforced innovation, positively impacting the global fuel cell yacht market by setting new benchmarks for large-scale, eco-friendly marine vessels.
Market Restraints:
The integration of fuel cell systems into yachts involves significant capital investment due to the high cost of hydrogen fuel cells, advanced materials, and specialized onboard storage systems. Additionally, maintenance and engineering expertise for fuel-cell-powered vessels are still limited, making ownership more expensive compared to conventional or hybrid diesel-electric yachts. This cost barrier restricts adoption, especially among mid-range yacht manufacturers and private owners.
Fuel cell yachts are transforming the maritime and luxury boating sector with significant socioeconomic impacts. By using hydrogen fuel cells instead of conventional fossil fuels, these yachts drastically reduce emissions, contributing to cleaner oceans and improved public health. The technology drives innovation in green engineering, creating skilled jobs in research, design, and manufacturing. While initial costs are high, long-term fuel savings and sustainability appeal to affluent consumers, encouraging investment in eco-friendly tourism and luxury markets. Additionally, fuel cell yachts promote awareness of renewable energy, potentially influencing broader marine regulations and inspiring the development of greener transportation solutions globally.
Segmental Analysis
The private yacht segment dominates the global market, fueled by the rising preference among affluent consumers for sustainable, noise-free, and emission-free marine experiences. Wealthy yacht owners are increasingly prioritizing environmental consciousness and advanced propulsion technologies as part of luxury ownership. Fuel cell-powered private yachts offer silent operation, minimal vibrations, and enhanced cruising range, making them attractive for eco-conscious buyers. Additionally, growing availability of hydrogen-hybrid yacht models and technological partnerships between fuel cell developers and yacht builders are further strengthening this segment’s growth.
Proton Exchange Membrane (PEM) Fuel Cells hold the largest share of the market due to their compact size, quick start-up capability, and suitability for marine environments. They efficiently convert hydrogen and oxygen into electricity, producing only water as a byproduct. Their lightweight design and ability to operate at relatively low temperatures make them ideal for small to medium-sized yachts. Continuous improvements in PEM fuel cell durability and cost reduction are accelerating their adoption. Furthermore, manufacturers are increasingly favoring PEM technology for its seamless integration into hybrid power systems alongside lithium-ion batteries.
The propulsion systems segment accounts for a major portion of the market as yacht manufacturers increasingly adopt fuel cells for main propulsion to replace or complement diesel engines. Fuel cell propulsion offers zero-emission cruising, silent operation, and reduced maintenance compared to traditional engines. This trend is driven by the growing focus on decarbonization and compliance with International Maritime Organization (IMO) emission norms. Additionally, hybrid propulsion setups—combining fuel cells and batteries—are becoming popular for optimizing power output and range, making this application the backbone of fuel-cell yacht advancements.
The Asia-Pacific region is expected to witness the highest growth in the global fuel cell yacht market over the forecast period, driven by increasing environmental awareness, rising disposable incomes, and growing demand for luxury and eco-friendly maritime experiences.
Countries such as China, Japan, South Korea, and Australia are investing heavily in sustainable marine technologies, including hydrogen and methanol fuel cells, to reduce emissions and comply with stricter environmental regulations. For instance, in October 2024, Sanlorenzo launched the LIFE MYSTIC project, in partnership with Nanni Industries and Ranieri Tonissi, to develop the world’s first green methanol bi-fuel superyacht by 2027, co-funded by the EU with over EUR 4.8 million investment. The initiative showcased sustainable marine innovation, highlighted alternative fuel management in Italian marinas, and stimulated interest in eco-friendly propulsion, positively influencing the Asia-Pacific fuel cell yacht market by encouraging adoption, investment, and technological development in the region.
Expanding yacht tourism, government incentives for clean energy adoption, and collaborations between local shipbuilders and international technology providers are further accelerating market penetration. This rapid growth positions Asia-Pacific as a key hub for innovation, production, and consumption of fuel cell-powered yachts globally.
| Report Matrics | Details |
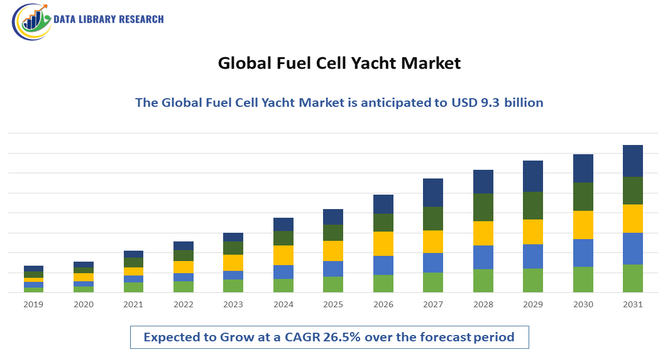
| Market Size Value | USD 9.3 billion |
| Growth Rate | CAGR of 26.5 % |
| Forecast | 2026-2033 |
| Historical data | 2021-2024 |
| Base Year | 2025 |
| Report Coverage | Forecasted revenue, company rating, competitive environment, growth drivers, and trends |
| Segment Coverage | Type, Application, End-User, Geography |
| Regional Scope | North America, Europe, Asia Pacific, Middle East |
| Customized scope | Free customization of reports (With 3 months Analysis Support ) |
| To Learn More About This Report | Request a Free Sample Copy |
The competitive landscape is diverse and collaborative, with fuel-cell stack manufacturers, hydrogen suppliers, marine propulsion specialists, and traditional yacht builders all competing and partnering to bring zero-emission yachts to market. Key dynamics include technology licensing, pilot projects with shipyards, joint ventures for hydrogen refuelling infrastructure, and a race to commercialize hybrid fuel-cell + battery systems that meet marine safety and classification standards. Market players range from established marine OEMs and luxury shipbuilders to innovative fuel-cell startups and electric propulsion firms, creating a fast-evolving ecosystem driven by strategic partnerships and regulatory momentum.
Key Players:
Recent Development
Q1. What are the main growth-driving factors for this market?
The primary driver is the global mandate for decarbonization in the maritime industry, pushing yacht owners and builders toward zero-emission solutions. Fuel cells offer quiet, vibration-free operation and produce only water as a byproduct, enhancing the luxury experience. Additionally, government incentives and ongoing technological advancements in hydrogen storage and fuel cell efficiency are making these systems more viable for marine use.
Q2. What are the main restraining factors for this market?
The biggest constraint is the high initial capital cost associated with fuel cell systems and hydrogen storage compared to traditional diesel engines. Furthermore, there is a significant challenge in the limited hydrogen fueling infrastructure at marinas and ports worldwide, which affects the cruising range and convenience for yacht owners. Regulatory hurdles for safely installing hydrogen systems also slow adoption.
Q3. Which segment is expected to witness high growth?
The Superyacht segment (vessels above 45 meters) is expected to witness the highest initial growth. This is because high-net-worth individuals who own superyachts have a greater budget and willingness to adopt expensive, cutting-edge, and environmentally friendly technologies. As costs fall, the market is expected to expand towards the smaller luxury and medium-sized yacht categories.
Q4. Who are the top major players for this market?
The key players are major yacht builders and specialized marine technology companies, often collaborating on projects. Leading players include yacht manufacturers like Lürssen Yachts, Feadship, and Sanlorenzo, who are integrating hydrogen technology into their new builds. Technology providers, such as those focusing on marine fuel cell systems, also hold a significant influence in driving innovation forward.
Q5. Which country is the largest player?
Europe currently dominates the global yacht market, and thus leads the adoption of fuel cell technology in this sector. Countries like Germany, Italy, and the Netherlands are home to the world's most prominent luxury yacht builders, who are actively pioneering the integration of advanced green propulsion systems due to strong regional environmental regulations and established maritime infrastructure.
Data Library Research are conducted by industry experts who offer insight on industry structure, market segmentations technology assessment and competitive landscape (CL), and penetration, as well as on emerging trends. Their analysis is based on primary interviews (~ 80%) and secondary research (~ 20%) as well as years of professional expertise in their respective industries. Adding to this, by analysing historical trends and current market positions, our analysts predict where the market will be headed for the next five years. Furthermore, the varying trends of segment & categories geographically presented are also studied and the estimated based on the primary & secondary research.
In this particular report from the supply side Data Library Research has conducted primary surveys (interviews) with the key level executives (VP, CEO’s, Marketing Director, Business Development Manager and SOFT) of the companies that active & prominent as well as the midsized organization
FIGURE 1: DLR RESEARH PROCESS
Extensive primary research was conducted to gain a deeper insight of the market and industry performance. The analysis is based on both primary and secondary research as well as years of professional expertise in the respective industries.
In addition to analysing current and historical trends, our analysts predict where the market is headed over the next five years.
It varies by segment for these categories geographically presented in the list of market tables. Speaking about this particular report we have conducted primary surveys (interviews) with the key level executives (VP, CEO’s, Marketing Director, Business Development Manager and many more) of the major players active in the market.
Secondary ResearchSecondary research was mainly used to collect and identify information useful for the extensive, technical, market-oriented, and Friend’s study of the Global Extra Neutral Alcohol. It was also used to obtain key information about major players, market classification and segmentation according to the industry trends, geographical markets, and developments related to the market and technology perspectives. For this study, analysts have gathered information from various credible sources, such as annual reports, sec filings, journals, white papers, SOFT presentations, and company web sites.
Market Size EstimationBoth, top-down and bottom-up approaches were used to estimate and validate the size of the Global market and to estimate the size of various other dependent submarkets in the overall Extra Neutral Alcohol. The key players in the market were identified through secondary research and their market contributions in the respective geographies were determined through primary and secondary research.
Forecast Model