Grid-scale Lead-acid Battery Market Overview and Analysis
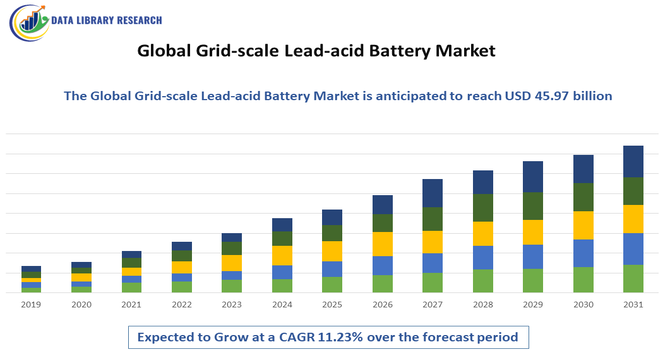
The Global Grid-Scale Lead-Acid Battery Market size was estimated at USD 11.69 billion in 2025 and is projected to reach USD 45.97 billion by 2032, growing with a CAGR of 11.23% from 2025-2032.
Get Complete Analysis Of The Report - Download Updated Free Sample PDF
The Global Grid-Scale Lead-Acid Battery Market involves large-capacity energy storage systems designed to support electrical grids, stabilize power supply, and store renewable energy. These batteries provide cost-effective, reliable, and durable solutions for peak load management, backup power, and frequency regulation. Growing investments in renewable energy integration, coupled with the demand for efficient energy storage in utilities and industrial applications, are driving adoption of grid-scale lead-acid battery technologies worldwide.
Grid-scale Lead-acid Battery Market Latest Trends
The grid-scale lead-acid battery market is witnessing steady growth driven by the rising integration of renewable energy sources, particularly solar and wind, into power grids. Utilities increasingly rely on these batteries for peak load management, frequency regulation, and backup power. Technological advancements, such as enhanced energy density, longer cycle life, and improved efficiency, are boosting adoption. Cost-effectiveness compared to alternative chemistries, like lithium-ion, further strengthens demand.
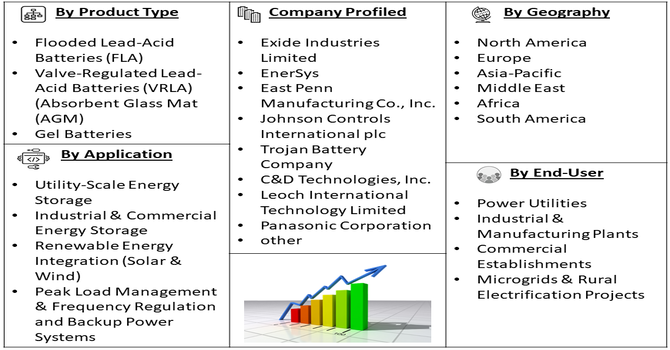
Segmentation: the Global Grid-Scale Lead-Acid Battery Market is segmented by Type (Flooded Lead-Acid Batteries (FLA) and Valve-Regulated Lead-Acid Batteries (VRLA) (Absorbent Glass Mat (AGM) and Gel Batteries), Application (Utility-Scale Energy Storage, Industrial & Commercial Energy Storage, Renewable Energy Integration (Solar & Wind), Peak Load Management & Frequency Regulation and Backup Power Systems), End-User (Power Utilities, Industrial & Manufacturing Plants, Commercial Establishments and Microgrids & Rural Electrification Projects), and Geography (North America, Europe, Asia-Pacific, Middle East and Africa, and South America). The report provides the value (in USD million) for the above segments.
For Detailed Market Segmentation - Get a Free Sample PDF
Market Drivers:
- Renewable Energy Integration
The growing adoption of renewable energy sources, such as solar and wind, is driving demand for grid-scale lead-acid batteries. These batteries provide cost-effective energy storage solutions that stabilize power grids, manage peak loads, and ensure continuous electricity supply despite intermittent generation.
In June 2025, Idemitsu Kosan secured subsidies of up to JPY 600 million to advance solid-state electrolyte production technologies for next-generation batteries. While advancing alternative chemistries, such investments sustained parallel demand for mature lead-acid technologies as utilities balanced innovation with reliable, cost-efficient grid-scale storage solutions. Lead-acid batteries’ proven performance, ease of recycling, and affordability make them an attractive choice for large-scale deployment, particularly in developing regions and for industrial-scale renewable energy projects worldwide.
- Cost-Effectiveness and Reliability
Lead-acid batteries offer a reliable and economically viable solution for large-scale energy storage, making them a preferred choice for utilities and industrial applications. Their low upfront cost compared to alternative chemistries like lithium-ion, coupled with long operational lifespans and mature recycling infrastructure, reduces total cost of ownership. This affordability enables widespread adoption in developing countries and emerging markets where grid stability is crucial. Additionally, the technology’s proven reliability under harsh conditions, ease of maintenance, and compatibility with existing infrastructure enhance investor confidence, supporting continued growth of grid-scale lead-acid battery installations globally.
Market Restraints:
- Limited Energy Density and Technological Constraints
Despite their advantages, lead-acid batteries face limitations in energy density and efficiency compared to newer storage technologies. Their heavier weight and larger footprint require more space for deployment, increasing installation and infrastructure costs for large-scale projects. Slow charge/discharge rates and lower cycle life relative to lithium-ion batteries can reduce operational flexibility, particularly for applications demanding high-frequency cycling or long-duration storage. Moreover, evolving grid requirements and technological advancements in alternative energy storage solutions may shift preference away from lead-acid systems. These factors collectively restrain market growth in regions prioritizing high-performance, compact, and energy-dense storage solutions.
Socioeconomic Impact on Grid-scale Lead-acid Battery Market
Grid-scale lead-acid batteries contribute significantly to socioeconomic development by enabling stable and reliable electricity supply, particularly in regions with intermittent power generation. They support renewable energy integration, reducing reliance on fossil fuels and lowering greenhouse gas emissions, which benefits public health and environmental sustainability. These systems also enhance energy security, improve industrial productivity, and reduce economic losses from power outages. The deployment of local manufacturing and installation projects creates jobs and stimulates regional economies. By facilitating affordable and dependable energy storage, lead-acid battery systems promote equitable access to electricity, fostering overall social and economic growth.
Segmental Analysis:
- Flooded Lead-Acid Batteries (FLA) segment is expected to witness highest growth over the forecast period
The Flooded Lead-Acid (FLA) battery segment is expected to witness the highest growth due to its cost-effectiveness, robustness, and proven reliability in large-scale energy storage applications. FLA batteries are widely used in utility, industrial, and renewable energy projects because of their long service life and ease of maintenance. Their ability to handle deep discharge cycles and high current loads makes them ideal for large-capacity deployments. Additionally, established recycling infrastructure enhances sustainability and reduces operational costs. Growing investments in energy storage systems globally, especially in developing regions, are further driving adoption of FLA technology over other lead-acid variants.
- Utility-Scale Energy Storage segment is expected to witness highest growth over the forecast period
The utility-scale energy storage segment is projected to lead growth as power grids worldwide increasingly integrate renewable energy sources and require stable, reliable storage solutions. Grid operators leverage lead-acid batteries for peak load management, frequency regulation, and backup power during outages. Cost-effective and durable, these systems allow utilities to optimize energy distribution, reduce dependency on fossil fuels, and meet environmental targets. Expanding investments in renewable energy infrastructure and government incentives for grid modernization are further propelling adoption. The proven performance and scalability of lead-acid batteries make them a preferred choice for large-scale utility projects globally.
- Industrial & Manufacturing Plants segment is expected to witness the highest growth over the forecast period
Industrial and manufacturing plants are expected to drive high demand for grid-scale lead-acid batteries due to their critical need for uninterrupted power and energy optimization. Lead-acid battery systems support industrial operations by ensuring reliable backup power, stabilizing electricity supply, and managing peak loads efficiently. Their affordability, durability, and ease of integration with existing infrastructure make them an attractive solution for cost-conscious manufacturers. As industries increasingly adopt renewable energy and smart energy management practices, the demand for robust, scalable, and maintenance-friendly lead-acid storage systems continues to rise, positioning the industrial sector as a key growth driver for the market.
- Asia-Pacific region is expected to witness the highest growth over the forecast period
The Asia-Pacific region is expected to witness the highest growth in the grid-scale lead-acid battery market due to rapid industrialization, expanding renewable energy capacity, and growing electricity demand. Countries such as China, India, and Japan are investing heavily in energy storage infrastructure to stabilize power grids and support solar and wind integration. For instance, in January 2024, LG Energy Solution Vertech announced plans to build 10 grid-scale battery storage facilities across the U.S. The initiative aimed to significantly boost energy storage capacity, supporting national renewable energy targets while reducing carbon emissions by approximately 16 million pounds annually. The projects were set to deploy lithium-ion batteries integrated with advanced performance analytics software. CEO Jaehong Park highlighted that these developments addressed the rising demand for energy storage solutions, driven by growing investments in renewable energy infrastructure and the need for a more resilient and sustainable power grid.
Favorable government policies, subsidies, and incentives for energy storage adoption are accelerating deployment. Additionally, cost-sensitive markets in the region prefer lead-acid batteries for large-scale applications due to their affordability, reliability, and established recycling practices.
Rising industrial, commercial, and utility energy storage projects further strengthen regional market growth. For instance, in June 2023, LGEN Sol successfully commissioned a 100 MW grid-scale battery storage facility in India. The project was designed to enhance energy security and facilitate the integration of renewable energy into the national power grid. By storing surplus electricity during peak generation periods and releasing it during high-demand times, the facility aimed to stabilize grid operations and optimize energy usage. This milestone marked a critical step in India’s renewable energy transition, demonstrating the strategic importance of large-scale battery storage in supporting reliable, sustainable, and efficient electricity supply across rapidly expanding energy markets.
Thus, all these factors are driving this region's growth.
| Report Matrics |
Details |
| Market Size Value |
USD 45.97 billion |
| Growth Rate |
CAGR of 11.23 % |
| Forecast |
2026-2033 |
| Historical data |
2021-2024 |
| Base Year |
2025 |
| Report Coverage |
Forecasted revenue, company rating, competitive environment, growth drivers, and trends |
| Segment Coverage |
Type, Application, End-User, Geography |
| Regional Scope |
North America, Europe, Asia Pacific, Middle East |
| Customized scope |
Free customization of reports (With 3 months' analysis support) |
| To Learn More About This Report |
Request a Free Sample Copy |
Grid-scale Lead-acid Battery Market Competitive Landscape
The competitive landscape of the global grid-scale lead-acid battery market is fragmented, with both established battery manufacturers and new entrants actively expanding capabilities. Key players focus on product innovation, strategic partnerships, mergers, and acquisitions to strengthen market share. Companies differentiate through improved battery efficiency, longer service life, and enhanced safety features. Major participants invest in regional production facilities to cater to increasing demand from utilities and industrial customers. Competitive pricing and customer support services also influence market positioning. Thus, the market is characterized by technological evolution, strategic collaborations, and efforts to capture growth opportunities in renewable energy integration and large-scale energy storage projects.
The major players for this market are:
- Exide Industries Limited
- EnerSys
- East Penn Manufacturing Co., Inc.
- Johnson Controls International plc
- Trojan Battery Company
- C&D Technologies, Inc.
- Leoch International Technology Limited
- Panasonic Corporation
- GS Yuasa Corporation
- Hitachi Chemical Co., Ltd.
- Hoppecke Batterien GmbH & Co. KG
- Saft Groupe S.A.
- Enersys Power Sources
- BYD Company Limited (Lead-acid segment)
- Narada Power Source Co., Ltd.
- Alpha Technologies
- Sonnenschein AGM Batteries (Exide/Enersys)
- FZSoNick Batteries
- Amara Raja Batteries Limited
- HBL Power Systems Ltd.
Recent Development:
- In July 2025, Mitsubishi HC Capital Energy, Mitsubishi Estate, Samsung C&T, and Osaka Gas initiated construction of a 25 MW/50 MWh energy storage facility in Hokkaido, with commercial operations planned for 2027. This large-scale deployment highlighted accelerating global investment in grid storage, indirectly supporting demand for cost-effective lead-acid batteries in complementary and hybrid grid applications worldwide.
- In June 2025, Japan Energy Comprehensive System and Star Seeds announced plans to develop 100 MW of grid-scale battery storage sites scheduled for delivery by 2027. Expansion of grid-scale storage capacity reinforced overall market growth, indirectly benefiting lead-acid batteries due to their affordability and suitability for large-scale, long-duration energy storage applications.
Frequently Asked Questions (FAQ) :
Q1. What are the main growth-driving factors for this market?
The primary drivers include the need for cost-effective, reliable energy storage to support renewable energy integration and stabilize power grids. Lead-acid batteries offer a proven, mature, and budget-friendly solution for short-duration storage and frequency regulation, particularly in emerging and regulated markets.
Q2. What are the main restraining factors for this market?
Major restraints are the limited cycle life and lower energy density of lead-acid compared to advanced lithium-ion chemistries. Environmental concerns over lead toxicity and the volume required for large-scale installations also hinder long-term growth and challenge its competitiveness in projects prioritizing high performance and minimal footprint.
Q3. Who are the top major players for this market?
Top players are established battery manufacturers with large-scale production capabilities. Key names include Exide Technologies, EnerSys, and Narada Power Source. These companies focus on developing advanced lead-acid variants, like Valve-Regulated Lead-Acid (VRLA) and Advanced Lead-Carbon batteries, optimized for grid applications.
Q4. Which country is the largest player?
China dominates the global grid-scale lead-acid battery market. Its position is fueled by massive domestic manufacturing capacity, strong utility demand for grid modernization and renewable integration, and extensive use of lead-acid technology in backup power and various industrial energy storage applications.
List of Figures
Figure 1: Global Grid-scale Lead-acid Battery Market Revenue Breakdown (USD Billion, %) by Region, 2022 & 2029
Figure 2: Global Grid-scale Lead-acid Battery Market Value Share (%), By Segment 1, 2022 & 2029
Figure 3: Global Grid-scale Lead-acid Battery Market Forecast (USD Billion), by Sub-Segment 1, 2018-2029
Figure 4: Global Grid-scale Lead-acid Battery Market Forecast (USD Billion), by Sub-Segment 2, 2018-2029
Figure 5: Global Grid-scale Lead-acid Battery Market Value Share (%), By Segment 2, 2022 & 2029
Figure 6: Global Grid-scale Lead-acid Battery Market Forecast (USD Billion), by Sub-Segment 1, 2018-2029
Figure 7: Global Grid-scale Lead-acid Battery Market Forecast (USD Billion), by Sub-Segment 2, 2018-2029
Figure 8: Global Grid-scale Lead-acid Battery Market Forecast (USD Billion), by Sub-Segment 3, 2018-2029
Figure 9: Global Grid-scale Lead-acid Battery Market Forecast (USD Billion), by Others, 2018-2029
Figure 10: Global Grid-scale Lead-acid Battery Market Value Share (%), By Segment 3, 2022 & 2029
Figure 11: Global Grid-scale Lead-acid Battery Market Forecast (USD Billion), by Sub-Segment 1, 2018-2029
Figure 12: Global Grid-scale Lead-acid Battery Market Forecast (USD Billion), by Sub-Segment 2, 2018-2029
Figure 13: Global Grid-scale Lead-acid Battery Market Forecast (USD Billion), by Sub-Segment 3, 2018-2029
Figure 14: Global Grid-scale Lead-acid Battery Market Forecast (USD Billion), by Others, 2018-2029
Figure 15: Global Grid-scale Lead-acid Battery Market Value (USD Billion), by Region, 2022 & 2029
Figure 16: North America Grid-scale Lead-acid Battery Market Value Share (%), By Segment 1, 2022 & 2029
Figure 17: North America Grid-scale Lead-acid Battery Market Forecast (USD Billion), by Sub-Segment 1, 2018-2029
Figure 18: North America Grid-scale Lead-acid Battery Market Forecast (USD Billion), by Sub-Segment 2, 2018-2029
Figure 19: North America Grid-scale Lead-acid Battery Market Value Share (%), By Segment 2, 2022 & 2029
Figure 20: North America Grid-scale Lead-acid Battery Market Forecast (USD Billion), by Sub-Segment 1, 2018-2029
Figure 21: North America Grid-scale Lead-acid Battery Market Forecast (USD Billion), by Sub-Segment 2, 2018-2029
Figure 22: North America Grid-scale Lead-acid Battery Market Forecast (USD Billion), by Sub-Segment 3, 2018-2029
Figure 23: North America Grid-scale Lead-acid Battery Market Forecast (USD Billion), by Others, 2018-2029
Figure 24: North America Grid-scale Lead-acid Battery Market Value Share (%), By Segment 3, 2022 & 2029
Figure 25: North America Grid-scale Lead-acid Battery Market Forecast (USD Billion), by Sub-Segment 1, 2018-2029
Figure 26: North America Grid-scale Lead-acid Battery Market Forecast (USD Billion), by Sub-Segment 2, 2018-2029
Figure 27: North America Grid-scale Lead-acid Battery Market Forecast (USD Billion), by Sub-Segment 3, 2018-2029
Figure 28: North America Grid-scale Lead-acid Battery Market Forecast (USD Billion), by Others, 2018-2029
Figure 29: North America Grid-scale Lead-acid Battery Market Forecast (USD Billion), by U.S., 2018-2029
Figure 30: North America Grid-scale Lead-acid Battery Market Forecast (USD Billion), by Canada, 2018-2029
Figure 31: Latin America Grid-scale Lead-acid Battery Market Value Share (%), By Segment 1, 2022 & 2029
Figure 32: Latin America Grid-scale Lead-acid Battery Market Forecast (USD Billion), by Sub-Segment 1, 2018-2029
Figure 33: Latin America Grid-scale Lead-acid Battery Market Forecast (USD Billion), by Sub-Segment 2, 2018-2029
Figure 34: Latin America Grid-scale Lead-acid Battery Market Value Share (%), By Segment 2, 2022 & 2029
Figure 35: Latin America Grid-scale Lead-acid Battery Market Forecast (USD Billion), by Sub-Segment 1, 2018-2029
Figure 36: Latin America Grid-scale Lead-acid Battery Market Forecast (USD Billion), by Sub-Segment 2, 2018-2029
Figure 37: Latin America Grid-scale Lead-acid Battery Market Forecast (USD Billion), by Sub-Segment 3, 2018-2029
Figure 38: Latin America Grid-scale Lead-acid Battery Market Forecast (USD Billion), by Others, 2018-2029
Figure 39: Latin America Grid-scale Lead-acid Battery Market Value Share (%), By Segment 3, 2022 & 2029
Figure 40: Latin America Grid-scale Lead-acid Battery Market Forecast (USD Billion), by Sub-Segment 1, 2018-2029
Figure 41: Latin America Grid-scale Lead-acid Battery Market Forecast (USD Billion), by Sub-Segment 2, 2018-2029
Figure 42: Latin America Grid-scale Lead-acid Battery Market Forecast (USD Billion), by Sub-Segment 3, 2018-2029
Figure 43: Latin America Grid-scale Lead-acid Battery Market Forecast (USD Billion), by Others, 2018-2029
Figure 44: Latin America Grid-scale Lead-acid Battery Market Forecast (USD Billion), by Brazil, 2018-2029
Figure 45: Latin America Grid-scale Lead-acid Battery Market Forecast (USD Billion), by Mexico, 2018-2029
Figure 46: Latin America Grid-scale Lead-acid Battery Market Forecast (USD Billion), by Rest of Latin America, 2018-2029
Figure 47: Europe Grid-scale Lead-acid Battery Market Value Share (%), By Segment 1, 2022 & 2029
Figure 48: Europe Grid-scale Lead-acid Battery Market Forecast (USD Billion), by Sub-Segment 1, 2018-2029
Figure 49: Europe Grid-scale Lead-acid Battery Market Forecast (USD Billion), by Sub-Segment 2, 2018-2029
Figure 50: Europe Grid-scale Lead-acid Battery Market Value Share (%), By Segment 2, 2022 & 2029
Figure 51: Europe Grid-scale Lead-acid Battery Market Forecast (USD Billion), by Sub-Segment 1, 2018-2029
Figure 52: Europe Grid-scale Lead-acid Battery Market Forecast (USD Billion), by Sub-Segment 2, 2018-2029
Figure 53: Europe Grid-scale Lead-acid Battery Market Forecast (USD Billion), by Sub-Segment 3, 2018-2029
Figure 54: Europe Grid-scale Lead-acid Battery Market Forecast (USD Billion), by Others, 2018-2029
Figure 55: Europe Grid-scale Lead-acid Battery Market Value Share (%), By Segment 3, 2022 & 2029
Figure 56: Europe Grid-scale Lead-acid Battery Market Forecast (USD Billion), by Sub-Segment 1, 2018-2029
Figure 57: Europe Grid-scale Lead-acid Battery Market Forecast (USD Billion), by Sub-Segment 2, 2018-2029
Figure 58: Europe Grid-scale Lead-acid Battery Market Forecast (USD Billion), by Sub-Segment 3, 2018-2029
Figure 59: Europe Grid-scale Lead-acid Battery Market Forecast (USD Billion), by Others, 2018-2029
Figure 60: Europe Grid-scale Lead-acid Battery Market Forecast (USD Billion), by U.K., 2018-2029
Figure 61: Europe Grid-scale Lead-acid Battery Market Forecast (USD Billion), by Germany, 2018-2029
Figure 62: Europe Grid-scale Lead-acid Battery Market Forecast (USD Billion), by France, 2018-2029
Figure 63: Europe Grid-scale Lead-acid Battery Market Forecast (USD Billion), by Italy, 2018-2029
Figure 64: Europe Grid-scale Lead-acid Battery Market Forecast (USD Billion), by Spain, 2018-2029
Figure 65: Europe Grid-scale Lead-acid Battery Market Forecast (USD Billion), by Russia, 2018-2029
Figure 66: Europe Grid-scale Lead-acid Battery Market Forecast (USD Billion), by Rest of Europe, 2018-2029
Figure 67: Asia Pacific Grid-scale Lead-acid Battery Market Value Share (%), By Segment 1, 2022 & 2029
Figure 68: Asia Pacific Grid-scale Lead-acid Battery Market Forecast (USD Billion), by Sub-Segment 1, 2018-2029
Figure 69: Asia Pacific Grid-scale Lead-acid Battery Market Forecast (USD Billion), by Sub-Segment 2, 2018-2029
Figure 70: Asia Pacific Grid-scale Lead-acid Battery Market Value Share (%), By Segment 2, 2022 & 2029
Figure 71: Asia Pacific Grid-scale Lead-acid Battery Market Forecast (USD Billion), by Sub-Segment 1, 2018-2029
Figure 72: Asia Pacific Grid-scale Lead-acid Battery Market Forecast (USD Billion), by Sub-Segment 2, 2018-2029
Figure 73: Asia Pacific Grid-scale Lead-acid Battery Market Forecast (USD Billion), by Sub-Segment 3, 2018-2029
Figure 74: Asia Pacific Grid-scale Lead-acid Battery Market Forecast (USD Billion), by Others, 2018-2029
Figure 75: Asia Pacific Grid-scale Lead-acid Battery Market Value Share (%), By Segment 3, 2022 & 2029
Figure 76: Asia Pacific Grid-scale Lead-acid Battery Market Forecast (USD Billion), by Sub-Segment 1, 2018-2029
Figure 77: Asia Pacific Grid-scale Lead-acid Battery Market Forecast (USD Billion), by Sub-Segment 2, 2018-2029
Figure 78: Asia Pacific Grid-scale Lead-acid Battery Market Forecast (USD Billion), by Sub-Segment 3, 2018-2029
Figure 79: Asia Pacific Grid-scale Lead-acid Battery Market Forecast (USD Billion), by Others, 2018-2029
Figure 80: Asia Pacific Grid-scale Lead-acid Battery Market Forecast (USD Billion), by China, 2018-2029
Figure 81: Asia Pacific Grid-scale Lead-acid Battery Market Forecast (USD Billion), by India, 2018-2029
Figure 82: Asia Pacific Grid-scale Lead-acid Battery Market Forecast (USD Billion), by Japan, 2018-2029
Figure 83: Asia Pacific Grid-scale Lead-acid Battery Market Forecast (USD Billion), by Australia, 2018-2029
Figure 84: Asia Pacific Grid-scale Lead-acid Battery Market Forecast (USD Billion), by Southeast Asia, 2018-2029
Figure 85: Asia Pacific Grid-scale Lead-acid Battery Market Forecast (USD Billion), by Rest of Asia Pacific, 2018-2029
Figure 86: Middle East & Africa Grid-scale Lead-acid Battery Market Value Share (%), By Segment 1, 2022 & 2029
Figure 87: Middle East & Africa Grid-scale Lead-acid Battery Market Forecast (USD Billion), by Sub-Segment 1, 2018-2029
Figure 88: Middle East & Africa Grid-scale Lead-acid Battery Market Forecast (USD Billion), by Sub-Segment 2, 2018-2029
Figure 89: Middle East & Africa Grid-scale Lead-acid Battery Market Value Share (%), By Segment 2, 2022 & 2029
Figure 90: Middle East & Africa Grid-scale Lead-acid Battery Market Forecast (USD Billion), by Sub-Segment 1, 2018-2029
Figure 91: Middle East & Africa Grid-scale Lead-acid Battery Market Forecast (USD Billion), by Sub-Segment 2, 2018-2029
Figure 92: Middle East & Africa Grid-scale Lead-acid Battery Market Forecast (USD Billion), by Sub-Segment 3, 2018-2029
Figure 93: Middle East & Africa Grid-scale Lead-acid Battery Market Forecast (USD Billion), by Others, 2018-2029
Figure 94: Middle East & Africa Grid-scale Lead-acid Battery Market Value Share (%), By Segment 3, 2022 & 2029
Figure 95: Middle East & Africa Grid-scale Lead-acid Battery Market Forecast (USD Billion), by Sub-Segment 1, 2018-2029
Figure 96: Middle East & Africa Grid-scale Lead-acid Battery Market Forecast (USD Billion), by Sub-Segment 2, 2018-2029
Figure 97: Middle East & Africa Grid-scale Lead-acid Battery Market Forecast (USD Billion), by Sub-Segment 3, 2018-2029
Figure 98: Middle East & Africa Grid-scale Lead-acid Battery Market Forecast (USD Billion), by Others, 2018-2029
Figure 99: Middle East & Africa Grid-scale Lead-acid Battery Market Forecast (USD Billion), by GCC, 2018-2029
Figure 100: Middle East & Africa Grid-scale Lead-acid Battery Market Forecast (USD Billion), by South Africa, 2018-2029
Figure 101: Middle East & Africa Grid-scale Lead-acid Battery Market Forecast (USD Billion), by Rest of Middle East & Africa, 2018-2029
List of Tables
Table 1: Global Grid-scale Lead-acid Battery Market Revenue (USD Billion) Forecast, by Segment 1, 2018-2029
Table 2: Global Grid-scale Lead-acid Battery Market Revenue (USD Billion) Forecast, by Segment 2, 2018-2029
Table 3: Global Grid-scale Lead-acid Battery Market Revenue (USD Billion) Forecast, by Segment 3, 2018-2029
Table 4: Global Grid-scale Lead-acid Battery Market Revenue (USD Billion) Forecast, by Region, 2018-2029
Table 5: North America Grid-scale Lead-acid Battery Market Revenue (USD Billion) Forecast, by Segment 1, 2018-2029
Table 6: North America Grid-scale Lead-acid Battery Market Revenue (USD Billion) Forecast, by Segment 2, 2018-2029
Table 7: North America Grid-scale Lead-acid Battery Market Revenue (USD Billion) Forecast, by Segment 3, 2018-2029
Table 8: North America Grid-scale Lead-acid Battery Market Revenue (USD Billion) Forecast, by Country, 2018-2029
Table 9: Europe Grid-scale Lead-acid Battery Market Revenue (USD Billion) Forecast, by Segment 1, 2018-2029
Table 10: Europe Grid-scale Lead-acid Battery Market Revenue (USD Billion) Forecast, by Segment 2, 2018-2029
Table 11: Europe Grid-scale Lead-acid Battery Market Revenue (USD Billion) Forecast, by Segment 3, 2018-2029
Table 12: Europe Grid-scale Lead-acid Battery Market Revenue (USD Billion) Forecast, by Country, 2018-2029
Table 13: Latin America Grid-scale Lead-acid Battery Market Revenue (USD Billion) Forecast, by Segment 1, 2018-2029
Table 14: Latin America Grid-scale Lead-acid Battery Market Revenue (USD Billion) Forecast, by Segment 2, 2018-2029
Table 15: Latin America Grid-scale Lead-acid Battery Market Revenue (USD Billion) Forecast, by Segment 3, 2018-2029
Table 16: Latin America Grid-scale Lead-acid Battery Market Revenue (USD Billion) Forecast, by Country, 2018-2029
Table 17: Asia Pacific Grid-scale Lead-acid Battery Market Revenue (USD Billion) Forecast, by Segment 1, 2018-2029
Table 18: Asia Pacific Grid-scale Lead-acid Battery Market Revenue (USD Billion) Forecast, by Segment 2, 2018-2029
Table 19: Asia Pacific Grid-scale Lead-acid Battery Market Revenue (USD Billion) Forecast, by Segment 3, 2018-2029
Table 20: Asia Pacific Grid-scale Lead-acid Battery Market Revenue (USD Billion) Forecast, by Country, 2018-2029
Table 21: Middle East & Africa Grid-scale Lead-acid Battery Market Revenue (USD Billion) Forecast, by Segment 1, 2018-2029
Table 22: Middle East & Africa Grid-scale Lead-acid Battery Market Revenue (USD Billion) Forecast, by Segment 2, 2018-2029
Table 23: Middle East & Africa Grid-scale Lead-acid Battery Market Revenue (USD Billion) Forecast, by Segment 3, 2018-2029
Table 24: Middle East & Africa Grid-scale Lead-acid Battery Market Revenue (USD Billion) Forecast, by Country, 2018-2029
Research Process
Data Library Research are conducted by industry experts who offer insight on
industry structure, market segmentations technology assessment and competitive landscape (CL), and penetration, as well as on emerging trends. Their analysis is based on primary interviews (~ 80%) and secondary research (~ 20%) as well as years of professional expertise in their respective industries. Adding to this, by analysing historical trends and current market positions, our analysts predict where the market will be headed for the next five years. Furthermore, the varying trends of segment & categories geographically presented are also studied and the estimated based on the primary & secondary research.
In this particular report from the supply side Data Library Research has conducted primary surveys (interviews) with the key level executives (VP, CEO’s, Marketing Director, Business Development Manager
and SOFT) of the companies that active & prominent as well as the midsized organization
FIGURE 1: DLR RESEARH PROCESS
![research-methodology1]()
Primary Research
Extensive primary research was conducted to gain a deeper insight of the market and industry performance. The analysis is based on both primary and secondary research as well as years of professional expertise in the respective industries.
In addition to analysing current and historical trends, our analysts predict where the market is headed over the next five years.
It varies by segment for these categories geographically presented in the list of market tables. Speaking about this particular report we have conducted primary surveys (interviews) with the key level executives (VP, CEO’s, Marketing Director, Business Development Manager and many more) of the major players active in the market.
Secondary Research
Secondary research was mainly used to collect and identify information useful for the extensive, technical, market-oriented, and Friend’s study of the Global Extra Neutral Alcohol. It was also used to obtain key information about major players, market classification and segmentation according to the industry trends, geographical markets, and developments related to the market and technology perspectives. For this study, analysts have gathered information from various credible sources, such as annual reports, sec filings, journals, white papers, SOFT presentations, and company web sites.
Market Size Estimation
Both, top-down and bottom-up approaches were used to estimate and validate the size of the Global market and to estimate the size of various other dependent submarkets in the overall Extra Neutral Alcohol. The key players in the market were identified through secondary research and their market contributions in the respective geographies were determined through primary and secondary research.
Forecast Model
![research-methodology2]()