Home Digital Blood Pressure Monitor Market Overview and Analysis:
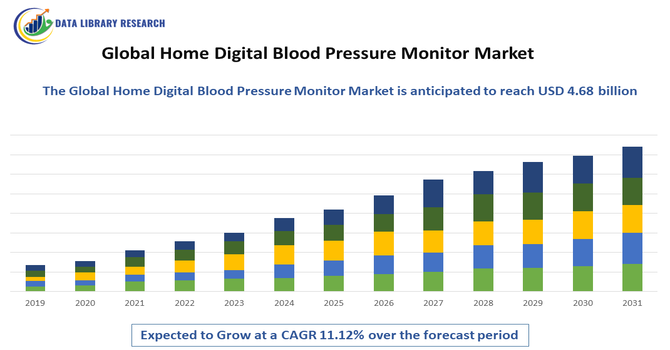
- The Global Home Digital Blood Pressure Monitor Market size is calculated at USD 3.27 billion in 2025 and is forecasted to reach around USD 4.68 billion by 2032, growing with a CAGR of 11.12% from 2025 to 2032.
Get Complete Analysis Of The Report - Download Updated Free Sample PDF
The global home digital blood pressure monitor market has been growing steadily in recent years, driven by the rising prevalence of hypertension and cardiovascular diseases worldwide, coupled with increasing awareness of preventive health care and self monitoring practices. As of 2024, home blood pressure monitoring devices already represent a substantial portion of the overall blood pressure monitor market, and demand continues to rise as patients and healthcare providers increasingly prefer convenient, user friendly, and accurate devices that allow regular monitoring outside of clinical settings.
Home Digital Blood Pressure Monitor Market Latest Trends:
The global home digital blood pressure monitor market is increasingly shaped by smart enabled, connected devices, with many new monitors featuring Bluetooth or Wi Fi connectivity to sync readings to smartphones or cloud platforms enabling real time tracking of trends and facilitating remote patient monitoring. There is a growing shift toward wearable and wrist based BP monitors, as users look for compact, convenient alternatives to traditional cuff based devices; these wearables appeal especially to younger, tech savvy and mobility oriented consumers.
Furthermore, there is a broader consumer and healthcare trend toward preventive care and self management of cardiovascular health, driven by rising awareness of hypertension risks and growing prevalence — this awareness is encouraging more people to adopt home BP monitors as part of routine health tracking.
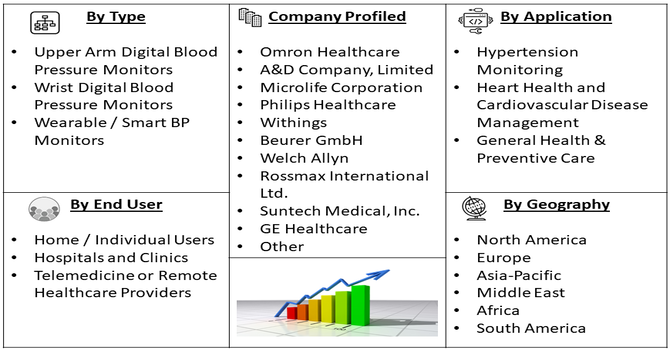
Segmentation: Global Home Digital Blood Pressure Monitor Market is segmented By Product Type (Upper Arm Digital Blood Pressure Monitors, Wrist Digital Blood Pressure Monitors, Wearable / Smart BP Monitors), Technology (Oscillometric Method, Aneroid / Mercury Method, Hybrid or Multi-parameter Monitors), End User (Home / Individual Users, Hospitals and Clinics, Telemedicine / Remote Healthcare Providers), Distribution Channel (Online Retailers / E-commerce, Pharmacy and Drug Stores, Specialty Medical Device Stores), Application (Hypertension Monitoring, Heart Health and Cardiovascular Disease Management, General Health & Preventive Care), and Geography (North America, Europe, Asia-Pacific, Middle East and Africa, and South America). The report provides the value (in USD million) for the above segments.
For Detailed Market Segmentation - Get a Free Sample PDF
Market Drivers:
- Rising Prevalence of Hypertension and Cardiovascular Diseases
The primary driver of the home digital blood pressure monitor market is the increasing incidence of hypertension and cardiovascular diseases worldwide. For instance, in 2022, an article published by Scientific Reports stated that between 1990 and 2019, the number of people with hypertension (blood pressure of ≥ 140 mmHg systolic or ≥ 90 mmHg diastolic or on medication) doubled from 650 million to 1.3 billion. This trend is particularly strong in aging populations and regions with high cardiovascular risk factor is fueling the demand for reliable, easy-to-use digital BP monitors.
- Growing Adoption of Connected and Smart Healthcare Devices
Another key driver is the rising integration of digital blood pressure monitors with smart technologies such as Bluetooth, Wi-Fi, and mobile applications. These smart devices enable automatic data logging, trend analysis, and remote sharing of readings with healthcare professionals, enhancing patient engagement and facilitating telemedicine services. The trend toward connected healthcare is being accelerated by the increasing adoption of wearable devices, mobile health apps, and cloud-based patient monitoring systems. This connectivity not only improves convenience and accuracy for users but also allows clinicians to monitor patients remotely, enabling timely intervention and reducing hospital visits. As consumers increasingly prefer technology-enabled self-care solutions, demand for smart, connected home digital BP monitors continues to grow.
Market Restraints:
The high device costs, particularly for advanced, smart, or wearable models with Bluetooth connectivity and cloud integration, can limit adoption in price-sensitive regions and among low-income consumers. Accuracy concerns also pose a challenge, as improper usage, incorrect cuff placement, or user error can result in unreliable readings, potentially undermining consumer confidence in home monitoring. Regulatory variations across countries, including differing standards for medical device approval and data privacy compliance, further complicate market expansion. Additionally, a lack of awareness or training on proper home monitoring practices, particularly among elderly populations, can reduce the effective utilization of digital BP monitors, thereby restraining market growth.
Socio Economic Impact on Home Digital Blood Pressure Monitor Market
The global home digital blood pressure monitor market was strongly influenced by socioeconomic factors. Rising health awareness, increasing hypertension, and higher disposable incomes drove demand, while government health initiatives and telemedicine expansion boosted adoption. Urban lifestyles further increased need, though affordability limited use in low-income areas.
Additionally, technological advancements and greater availability of user-friendly devices made home monitoring more accessible, encouraging regular health tracking. Public campaigns and digital health education increased trust in these devices, further supporting adoption. Conversely, regions with limited healthcare infrastructure or lower digital literacy experienced slower uptake, highlighting how economic and social conditions directly impacted the global home digital blood pressure monitor market.
Segmental Analysis:
- Upper Arm Digital Blood Pressure Monitors segment is expected to witness the highest growth over the forecast period
Upper arm digital blood pressure monitors are the most widely used and preferred home monitoring devices due to their high accuracy and reliability compared to wrist or wearable devices. These monitors use inflatable cuffs placed around the upper arm to measure blood pressure, making them suitable for both elderly users and patients with chronic hypertension. They are favored in home healthcare settings and recommended by physicians for regular monitoring, contributing significantly to the segment’s growth.
- Oscillometric Method segment is expected to witness the highest growth over the forecast period
The oscillometric method is the predominant technology used in home digital BP monitors. It detects blood flow vibrations in the arteries and converts them into digital readings of systolic and diastolic pressure. This technology is favored because it is automated, easy to use, and requires minimal user intervention, making it ideal for self-monitoring at home. Its accuracy, combined with user-friendly operation, drives higher adoption rates among individual users.
- Home / Individual Users segment is expected to witness the highest growth over the forecast period
Home or individual users represent the largest end-user segment as more people prioritize preventive healthcare and self-monitoring of blood pressure. The increasing prevalence of hypertension and cardiovascular diseases, along with growing health awareness, encourages individuals to adopt digital BP monitors for daily tracking. This trend is supported by guidance from healthcare providers and integration with mobile health apps for remote monitoring and data sharing.
- Online Retailers / E-commerce segment is expected to witness the highest growth over the forecast period
Online retail and e-commerce platforms are increasingly becoming the preferred distribution channel due to convenience, competitive pricing, and access to a wide range of devices. Customers can compare product features, read reviews, and receive doorstep delivery, which is particularly appealing for elderly users and tech-savvy consumers. The growth of e-commerce has also enabled manufacturers to reach previously untapped regions and demographics.
- Hypertension Monitoring segment is expected to witness the highest growth over the forecast period
Hypertension monitoring is the primary application of home digital BP monitors. Regular home monitoring allows early detection of abnormal readings, helps patients manage blood pressure levels effectively, and supports physician-guided treatment plans. This application is crucial for preventing complications such as heart attack, stroke, and kidney damage, making it a central driver of market growth.
- North America segment is expected to witness the highest growth over the forecast period
North America dominates the market due to high healthcare awareness, advanced medical infrastructure, and widespread adoption of home healthcare technologies. For instance, in 2025., Aktiia obtained FDA 510(k) clearance for its over-the-counter, cuffless blood pressure monitor, the G0 Blood Pressure Monitoring System (Hilo), enabling consumers to measure blood pressure conveniently without traditional cuffs. These product launches and FDA approvals boosted innovation and consumer confidence in the U.S. market, driving adoption of advanced, user-friendly home digital blood pressure monitors. They also intensified competition, encouraging manufacturers to offer more wearable, AI-enabled, and cuffless devices, accelerating overall market growth in the U.S.
The region benefits from a strong aging population, high prevalence of hypertension, and growing demand for connected and smart healthcare devices. For instance, in July 2025, an article published by NCBI reported that, hypertension is one of the most prevalent conditions in the U.S., that affected approximately 75 million adults, or 1 in 3 adults in the country. Despite the high prevalence, only 54% of patients diagnosed with hypertension have adequate blood pressure control.
Moreover, the supportive regulations in the U.S. ensured product safety and quality, building consumer trust in home digital blood pressure monitors. Coupled with a robust e-commerce infrastructure, these factors enabled easy online access, wider distribution, and convenient purchasing, significantly driving adoption and contributing to steady growth of the U.S. home BP monitor market.
| Report Matrics |
Details |
| Market Size Value |
USD 4.68 billion |
| Growth Rate |
CAGR of 11.12 % |
| Forecast |
2026-2033 |
| Historical data |
2021-2024 |
| Base Year |
2025 |
| Report Coverage |
Forecasted revenue, company rating, competitive environment, growth drivers, and trends |
| Segment Coverage |
Type, Application, End-User, Geography |
| Regional Scope |
North America, Europe, Asia Pacific, Middle East |
| Customized scope |
Free customization of reports (With 3 months Analysis Support ) |
| To Learn More About This Report |
Request a Free Sample Copy |
Home Digital Blood Pressure Monitor Market Competitive Landscape:
The competitive landscape in the global home digital blood pressure monitor market is shaped by a mix of long standing medical device firms, consumer health electronics companies, and newer entrants focused on smart, connected, or wearable BP technologies. Leading players differentiate on the basis of accuracy, ease of use, smart connectivity (Bluetooth/Wi Fi or app integration), global distribution networks, and product variety (upper arm, wrist, wearable/portable). As hypertension awareness, telemedicine uptake, and demand for home based health monitoring rise, competition is intensifying — with companies investing in R&D, pushing innovations such as AFib detection, cloud sync, and multi user memory features, while also expanding presence in emerging markets.
Key Players:
- Omron Healthcare
- A&D Company, Limited
- Microlife Corporation
- Philips Healthcare
- Withings
- Beurer GmbH
- Welch Allyn
- Rossmax International Ltd.
- Suntech Medical, Inc.
- GE Healthcare
- American Diagnostic Corporation
- Spacelabs Healthcare
- Nihon Kohden Corporation
- Contec Medical Systems Co., Ltd.
- BPL Medical Technologies
- Citizen Systems Japan Co., Ltd.
- iHealth Labs Inc.
- Braun GmbH
- Smiths Medical
- Yuwell Jiangsu Yuyue Medical Equipment & Supply Co., Ltd.
Recent Development
- In September 2025, Sky Labs launched CART BP, a ring-style personal blood pressure monitor designed for daily use, offering users a compact, convenient, and wearable solution for continuous blood pressure monitoring at home.
- In May 2025, OMRON Healthcare introduced home blood pressure monitors with AI-powered atrial fibrillation detection. Using the IntelliSense AFib algorithm, the devices automatically screened for AFib, enabling early identification of stroke and heart failure risks.
Frequently Asked Questions (FAQ) :
Q1. What are the main growth-driving factors for this market?
The global home digital blood pressure monitor market grew due to rising awareness of hypertension and cardiovascular health, increasing prevalence of lifestyle-related diseases, and a growing focus on preventive healthcare. Easy access to affordable devices, government initiatives promoting home monitoring, and the rise of telemedicine and digital health technologies also encouraged adoption.
Q2. What are the main restraining factors for this market?
Market growth was limited by high device costs in certain regions, especially for advanced models with extra features. Lack of awareness or trust in device accuracy, low digital literacy, and limited healthcare infrastructure in rural or low-income areas also slowed adoption. Additionally, inconsistent regulatory standards and concerns about data privacy in connected devices created hesitancy, restricting widespread use of home digital blood pressure monitors globally.
Q3. Which segment is expected to witness high growth?
The upper-arm digital blood pressure monitor segment was expected to witness the highest growth due to its accuracy, reliability, and user-friendly design. This segment was popular among elderly users and patients managing hypertension at home. Rising demand for connected, Bluetooth-enabled monitors that integrate with health apps also fueled growth.
Q4. Who are the top major players for this market?
Leading companies in the global home digital blood pressure monitor market included Omron Healthcare, Microlife Corporation, A&D Medical, Koninklijke Philips N.V., Withings, Welch Allyn, Rossmax International Ltd., and GE Healthcare. These companies dominated due to strong brand recognition, wide distribution networks, and continuous innovation in device accuracy, connectivity, and user-friendly design. Their ongoing investment in research and development helped maintain market leadership.
Q5. Which country is the largest player?
The United States was the largest player in the global home digital blood pressure monitor market. Its dominance resulted from advanced healthcare infrastructure, a strong preventive-care culture, high health awareness, and widespread consumer demand for home monitoring devices. The country also benefited from technological innovation, easy access to digital health solutions, and supportive government initiatives promoting home healthcare adoption.
List of Figures
Figure 1: Global Home Digital Blood Pressure Monitor Market Revenue Breakdown (USD Billion, %) by Region, 2022 & 2029
Figure 2: Global Home Digital Blood Pressure Monitor Market Value Share (%), By Segment 1, 2022 & 2029
Figure 3: Global Home Digital Blood Pressure Monitor Market Forecast (USD Billion), by Sub-Segment 1, 2018-2029
Figure 4: Global Home Digital Blood Pressure Monitor Market Forecast (USD Billion), by Sub-Segment 2, 2018-2029
Figure 5: Global Home Digital Blood Pressure Monitor Market Value Share (%), By Segment 2, 2022 & 2029
Figure 6: Global Home Digital Blood Pressure Monitor Market Forecast (USD Billion), by Sub-Segment 1, 2018-2029
Figure 7: Global Home Digital Blood Pressure Monitor Market Forecast (USD Billion), by Sub-Segment 2, 2018-2029
Figure 8: Global Home Digital Blood Pressure Monitor Market Forecast (USD Billion), by Sub-Segment 3, 2018-2029
Figure 9: Global Home Digital Blood Pressure Monitor Market Forecast (USD Billion), by Others, 2018-2029
Figure 10: Global Home Digital Blood Pressure Monitor Market Value Share (%), By Segment 3, 2022 & 2029
Figure 11: Global Home Digital Blood Pressure Monitor Market Forecast (USD Billion), by Sub-Segment 1, 2018-2029
Figure 12: Global Home Digital Blood Pressure Monitor Market Forecast (USD Billion), by Sub-Segment 2, 2018-2029
Figure 13: Global Home Digital Blood Pressure Monitor Market Forecast (USD Billion), by Sub-Segment 3, 2018-2029
Figure 14: Global Home Digital Blood Pressure Monitor Market Forecast (USD Billion), by Others, 2018-2029
Figure 15: Global Home Digital Blood Pressure Monitor Market Value (USD Billion), by Region, 2022 & 2029
Figure 16: North America Home Digital Blood Pressure Monitor Market Value Share (%), By Segment 1, 2022 & 2029
Figure 17: North America Home Digital Blood Pressure Monitor Market Forecast (USD Billion), by Sub-Segment 1, 2018-2029
Figure 18: North America Home Digital Blood Pressure Monitor Market Forecast (USD Billion), by Sub-Segment 2, 2018-2029
Figure 19: North America Home Digital Blood Pressure Monitor Market Value Share (%), By Segment 2, 2022 & 2029
Figure 20: North America Home Digital Blood Pressure Monitor Market Forecast (USD Billion), by Sub-Segment 1, 2018-2029
Figure 21: North America Home Digital Blood Pressure Monitor Market Forecast (USD Billion), by Sub-Segment 2, 2018-2029
Figure 22: North America Home Digital Blood Pressure Monitor Market Forecast (USD Billion), by Sub-Segment 3, 2018-2029
Figure 23: North America Home Digital Blood Pressure Monitor Market Forecast (USD Billion), by Others, 2018-2029
Figure 24: North America Home Digital Blood Pressure Monitor Market Value Share (%), By Segment 3, 2022 & 2029
Figure 25: North America Home Digital Blood Pressure Monitor Market Forecast (USD Billion), by Sub-Segment 1, 2018-2029
Figure 26: North America Home Digital Blood Pressure Monitor Market Forecast (USD Billion), by Sub-Segment 2, 2018-2029
Figure 27: North America Home Digital Blood Pressure Monitor Market Forecast (USD Billion), by Sub-Segment 3, 2018-2029
Figure 28: North America Home Digital Blood Pressure Monitor Market Forecast (USD Billion), by Others, 2018-2029
Figure 29: North America Home Digital Blood Pressure Monitor Market Forecast (USD Billion), by U.S., 2018-2029
Figure 30: North America Home Digital Blood Pressure Monitor Market Forecast (USD Billion), by Canada, 2018-2029
Figure 31: Latin America Home Digital Blood Pressure Monitor Market Value Share (%), By Segment 1, 2022 & 2029
Figure 32: Latin America Home Digital Blood Pressure Monitor Market Forecast (USD Billion), by Sub-Segment 1, 2018-2029
Figure 33: Latin America Home Digital Blood Pressure Monitor Market Forecast (USD Billion), by Sub-Segment 2, 2018-2029
Figure 34: Latin America Home Digital Blood Pressure Monitor Market Value Share (%), By Segment 2, 2022 & 2029
Figure 35: Latin America Home Digital Blood Pressure Monitor Market Forecast (USD Billion), by Sub-Segment 1, 2018-2029
Figure 36: Latin America Home Digital Blood Pressure Monitor Market Forecast (USD Billion), by Sub-Segment 2, 2018-2029
Figure 37: Latin America Home Digital Blood Pressure Monitor Market Forecast (USD Billion), by Sub-Segment 3, 2018-2029
Figure 38: Latin America Home Digital Blood Pressure Monitor Market Forecast (USD Billion), by Others, 2018-2029
Figure 39: Latin America Home Digital Blood Pressure Monitor Market Value Share (%), By Segment 3, 2022 & 2029
Figure 40: Latin America Home Digital Blood Pressure Monitor Market Forecast (USD Billion), by Sub-Segment 1, 2018-2029
Figure 41: Latin America Home Digital Blood Pressure Monitor Market Forecast (USD Billion), by Sub-Segment 2, 2018-2029
Figure 42: Latin America Home Digital Blood Pressure Monitor Market Forecast (USD Billion), by Sub-Segment 3, 2018-2029
Figure 43: Latin America Home Digital Blood Pressure Monitor Market Forecast (USD Billion), by Others, 2018-2029
Figure 44: Latin America Home Digital Blood Pressure Monitor Market Forecast (USD Billion), by Brazil, 2018-2029
Figure 45: Latin America Home Digital Blood Pressure Monitor Market Forecast (USD Billion), by Mexico, 2018-2029
Figure 46: Latin America Home Digital Blood Pressure Monitor Market Forecast (USD Billion), by Rest of Latin America, 2018-2029
Figure 47: Europe Home Digital Blood Pressure Monitor Market Value Share (%), By Segment 1, 2022 & 2029
Figure 48: Europe Home Digital Blood Pressure Monitor Market Forecast (USD Billion), by Sub-Segment 1, 2018-2029
Figure 49: Europe Home Digital Blood Pressure Monitor Market Forecast (USD Billion), by Sub-Segment 2, 2018-2029
Figure 50: Europe Home Digital Blood Pressure Monitor Market Value Share (%), By Segment 2, 2022 & 2029
Figure 51: Europe Home Digital Blood Pressure Monitor Market Forecast (USD Billion), by Sub-Segment 1, 2018-2029
Figure 52: Europe Home Digital Blood Pressure Monitor Market Forecast (USD Billion), by Sub-Segment 2, 2018-2029
Figure 53: Europe Home Digital Blood Pressure Monitor Market Forecast (USD Billion), by Sub-Segment 3, 2018-2029
Figure 54: Europe Home Digital Blood Pressure Monitor Market Forecast (USD Billion), by Others, 2018-2029
Figure 55: Europe Home Digital Blood Pressure Monitor Market Value Share (%), By Segment 3, 2022 & 2029
Figure 56: Europe Home Digital Blood Pressure Monitor Market Forecast (USD Billion), by Sub-Segment 1, 2018-2029
Figure 57: Europe Home Digital Blood Pressure Monitor Market Forecast (USD Billion), by Sub-Segment 2, 2018-2029
Figure 58: Europe Home Digital Blood Pressure Monitor Market Forecast (USD Billion), by Sub-Segment 3, 2018-2029
Figure 59: Europe Home Digital Blood Pressure Monitor Market Forecast (USD Billion), by Others, 2018-2029
Figure 60: Europe Home Digital Blood Pressure Monitor Market Forecast (USD Billion), by U.K., 2018-2029
Figure 61: Europe Home Digital Blood Pressure Monitor Market Forecast (USD Billion), by Germany, 2018-2029
Figure 62: Europe Home Digital Blood Pressure Monitor Market Forecast (USD Billion), by France, 2018-2029
Figure 63: Europe Home Digital Blood Pressure Monitor Market Forecast (USD Billion), by Italy, 2018-2029
Figure 64: Europe Home Digital Blood Pressure Monitor Market Forecast (USD Billion), by Spain, 2018-2029
Figure 65: Europe Home Digital Blood Pressure Monitor Market Forecast (USD Billion), by Russia, 2018-2029
Figure 66: Europe Home Digital Blood Pressure Monitor Market Forecast (USD Billion), by Rest of Europe, 2018-2029
Figure 67: Asia Pacific Home Digital Blood Pressure Monitor Market Value Share (%), By Segment 1, 2022 & 2029
Figure 68: Asia Pacific Home Digital Blood Pressure Monitor Market Forecast (USD Billion), by Sub-Segment 1, 2018-2029
Figure 69: Asia Pacific Home Digital Blood Pressure Monitor Market Forecast (USD Billion), by Sub-Segment 2, 2018-2029
Figure 70: Asia Pacific Home Digital Blood Pressure Monitor Market Value Share (%), By Segment 2, 2022 & 2029
Figure 71: Asia Pacific Home Digital Blood Pressure Monitor Market Forecast (USD Billion), by Sub-Segment 1, 2018-2029
Figure 72: Asia Pacific Home Digital Blood Pressure Monitor Market Forecast (USD Billion), by Sub-Segment 2, 2018-2029
Figure 73: Asia Pacific Home Digital Blood Pressure Monitor Market Forecast (USD Billion), by Sub-Segment 3, 2018-2029
Figure 74: Asia Pacific Home Digital Blood Pressure Monitor Market Forecast (USD Billion), by Others, 2018-2029
Figure 75: Asia Pacific Home Digital Blood Pressure Monitor Market Value Share (%), By Segment 3, 2022 & 2029
Figure 76: Asia Pacific Home Digital Blood Pressure Monitor Market Forecast (USD Billion), by Sub-Segment 1, 2018-2029
Figure 77: Asia Pacific Home Digital Blood Pressure Monitor Market Forecast (USD Billion), by Sub-Segment 2, 2018-2029
Figure 78: Asia Pacific Home Digital Blood Pressure Monitor Market Forecast (USD Billion), by Sub-Segment 3, 2018-2029
Figure 79: Asia Pacific Home Digital Blood Pressure Monitor Market Forecast (USD Billion), by Others, 2018-2029
Figure 80: Asia Pacific Home Digital Blood Pressure Monitor Market Forecast (USD Billion), by China, 2018-2029
Figure 81: Asia Pacific Home Digital Blood Pressure Monitor Market Forecast (USD Billion), by India, 2018-2029
Figure 82: Asia Pacific Home Digital Blood Pressure Monitor Market Forecast (USD Billion), by Japan, 2018-2029
Figure 83: Asia Pacific Home Digital Blood Pressure Monitor Market Forecast (USD Billion), by Australia, 2018-2029
Figure 84: Asia Pacific Home Digital Blood Pressure Monitor Market Forecast (USD Billion), by Southeast Asia, 2018-2029
Figure 85: Asia Pacific Home Digital Blood Pressure Monitor Market Forecast (USD Billion), by Rest of Asia Pacific, 2018-2029
Figure 86: Middle East & Africa Home Digital Blood Pressure Monitor Market Value Share (%), By Segment 1, 2022 & 2029
Figure 87: Middle East & Africa Home Digital Blood Pressure Monitor Market Forecast (USD Billion), by Sub-Segment 1, 2018-2029
Figure 88: Middle East & Africa Home Digital Blood Pressure Monitor Market Forecast (USD Billion), by Sub-Segment 2, 2018-2029
Figure 89: Middle East & Africa Home Digital Blood Pressure Monitor Market Value Share (%), By Segment 2, 2022 & 2029
Figure 90: Middle East & Africa Home Digital Blood Pressure Monitor Market Forecast (USD Billion), by Sub-Segment 1, 2018-2029
Figure 91: Middle East & Africa Home Digital Blood Pressure Monitor Market Forecast (USD Billion), by Sub-Segment 2, 2018-2029
Figure 92: Middle East & Africa Home Digital Blood Pressure Monitor Market Forecast (USD Billion), by Sub-Segment 3, 2018-2029
Figure 93: Middle East & Africa Home Digital Blood Pressure Monitor Market Forecast (USD Billion), by Others, 2018-2029
Figure 94: Middle East & Africa Home Digital Blood Pressure Monitor Market Value Share (%), By Segment 3, 2022 & 2029
Figure 95: Middle East & Africa Home Digital Blood Pressure Monitor Market Forecast (USD Billion), by Sub-Segment 1, 2018-2029
Figure 96: Middle East & Africa Home Digital Blood Pressure Monitor Market Forecast (USD Billion), by Sub-Segment 2, 2018-2029
Figure 97: Middle East & Africa Home Digital Blood Pressure Monitor Market Forecast (USD Billion), by Sub-Segment 3, 2018-2029
Figure 98: Middle East & Africa Home Digital Blood Pressure Monitor Market Forecast (USD Billion), by Others, 2018-2029
Figure 99: Middle East & Africa Home Digital Blood Pressure Monitor Market Forecast (USD Billion), by GCC, 2018-2029
Figure 100: Middle East & Africa Home Digital Blood Pressure Monitor Market Forecast (USD Billion), by South Africa, 2018-2029
Figure 101: Middle East & Africa Home Digital Blood Pressure Monitor Market Forecast (USD Billion), by Rest of Middle East & Africa, 2018-2029
List of Tables
Table 1: Global Home Digital Blood Pressure Monitor Market Revenue (USD Billion) Forecast, by Segment 1, 2018-2029
Table 2: Global Home Digital Blood Pressure Monitor Market Revenue (USD Billion) Forecast, by Segment 2, 2018-2029
Table 3: Global Home Digital Blood Pressure Monitor Market Revenue (USD Billion) Forecast, by Segment 3, 2018-2029
Table 4: Global Home Digital Blood Pressure Monitor Market Revenue (USD Billion) Forecast, by Region, 2018-2029
Table 5: North America Home Digital Blood Pressure Monitor Market Revenue (USD Billion) Forecast, by Segment 1, 2018-2029
Table 6: North America Home Digital Blood Pressure Monitor Market Revenue (USD Billion) Forecast, by Segment 2, 2018-2029
Table 7: North America Home Digital Blood Pressure Monitor Market Revenue (USD Billion) Forecast, by Segment 3, 2018-2029
Table 8: North America Home Digital Blood Pressure Monitor Market Revenue (USD Billion) Forecast, by Country, 2018-2029
Table 9: Europe Home Digital Blood Pressure Monitor Market Revenue (USD Billion) Forecast, by Segment 1, 2018-2029
Table 10: Europe Home Digital Blood Pressure Monitor Market Revenue (USD Billion) Forecast, by Segment 2, 2018-2029
Table 11: Europe Home Digital Blood Pressure Monitor Market Revenue (USD Billion) Forecast, by Segment 3, 2018-2029
Table 12: Europe Home Digital Blood Pressure Monitor Market Revenue (USD Billion) Forecast, by Country, 2018-2029
Table 13: Latin America Home Digital Blood Pressure Monitor Market Revenue (USD Billion) Forecast, by Segment 1, 2018-2029
Table 14: Latin America Home Digital Blood Pressure Monitor Market Revenue (USD Billion) Forecast, by Segment 2, 2018-2029
Table 15: Latin America Home Digital Blood Pressure Monitor Market Revenue (USD Billion) Forecast, by Segment 3, 2018-2029
Table 16: Latin America Home Digital Blood Pressure Monitor Market Revenue (USD Billion) Forecast, by Country, 2018-2029
Table 17: Asia Pacific Home Digital Blood Pressure Monitor Market Revenue (USD Billion) Forecast, by Segment 1, 2018-2029
Table 18: Asia Pacific Home Digital Blood Pressure Monitor Market Revenue (USD Billion) Forecast, by Segment 2, 2018-2029
Table 19: Asia Pacific Home Digital Blood Pressure Monitor Market Revenue (USD Billion) Forecast, by Segment 3, 2018-2029
Table 20: Asia Pacific Home Digital Blood Pressure Monitor Market Revenue (USD Billion) Forecast, by Country, 2018-2029
Table 21: Middle East & Africa Home Digital Blood Pressure Monitor Market Revenue (USD Billion) Forecast, by Segment 1, 2018-2029
Table 22: Middle East & Africa Home Digital Blood Pressure Monitor Market Revenue (USD Billion) Forecast, by Segment 2, 2018-2029
Table 23: Middle East & Africa Home Digital Blood Pressure Monitor Market Revenue (USD Billion) Forecast, by Segment 3, 2018-2029
Table 24: Middle East & Africa Home Digital Blood Pressure Monitor Market Revenue (USD Billion) Forecast, by Country, 2018-2029
Research Process
Data Library Research are conducted by industry experts who offer insight on
industry structure, market segmentations technology assessment and competitive landscape (CL), and penetration, as well as on emerging trends. Their analysis is based on primary interviews (~ 80%) and secondary research (~ 20%) as well as years of professional expertise in their respective industries. Adding to this, by analysing historical trends and current market positions, our analysts predict where the market will be headed for the next five years. Furthermore, the varying trends of segment & categories geographically presented are also studied and the estimated based on the primary & secondary research.
In this particular report from the supply side Data Library Research has conducted primary surveys (interviews) with the key level executives (VP, CEO’s, Marketing Director, Business Development Manager
and SOFT) of the companies that active & prominent as well as the midsized organization
FIGURE 1: DLR RESEARH PROCESS
![research-methodology1]()
Primary Research
Extensive primary research was conducted to gain a deeper insight of the market and industry performance. The analysis is based on both primary and secondary research as well as years of professional expertise in the respective industries.
In addition to analysing current and historical trends, our analysts predict where the market is headed over the next five years.
It varies by segment for these categories geographically presented in the list of market tables. Speaking about this particular report we have conducted primary surveys (interviews) with the key level executives (VP, CEO’s, Marketing Director, Business Development Manager and many more) of the major players active in the market.
Secondary Research
Secondary research was mainly used to collect and identify information useful for the extensive, technical, market-oriented, and Friend’s study of the Global Extra Neutral Alcohol. It was also used to obtain key information about major players, market classification and segmentation according to the industry trends, geographical markets, and developments related to the market and technology perspectives. For this study, analysts have gathered information from various credible sources, such as annual reports, sec filings, journals, white papers, SOFT presentations, and company web sites.
Market Size Estimation
Both, top-down and bottom-up approaches were used to estimate and validate the size of the Global market and to estimate the size of various other dependent submarkets in the overall Extra Neutral Alcohol. The key players in the market were identified through secondary research and their market contributions in the respective geographies were determined through primary and secondary research.
Forecast Model
![research-methodology2]()