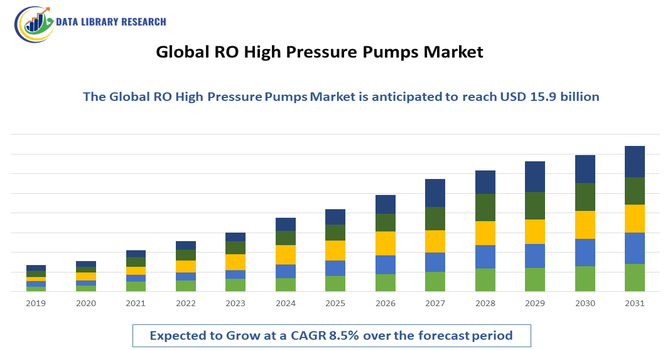
RO High-Pressure Pumps Market Overview and Analysis:
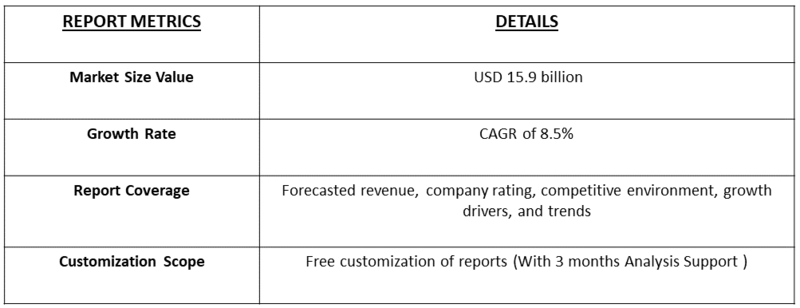
- The broader Reverse Osmosis Pump Market is projected to reach approximately USD 15.9 billion by 2032, from USD 5.45 billion in 2025. The market is forecast to expand significantly, with a CAGR of 8.5% over the forecast period 2025-2032.
Get Complete Analysis Of The Report - Download Updated Free Sample PDF
The growth of the Global RO High-Pressure Pumps Market is primarily driven by the rising demand for clean and potable water, fueled by increasing urbanization, industrialization, and the growing scarcity of freshwater resources worldwide. Rapid expansion of desalination plants, particularly in arid regions and coastal economies, is a major contributor to market growth as these systems rely heavily on high-pressure pumps for reverse osmosis (RO) processes. Additionally, the growing adoption of advanced membrane technologies in industrial water treatment, power generation, and wastewater recycling applications is further accelerating the need for energy-efficient and durable high-pressure pumps.
RO High Pressure Pumps Market Latest Trends:
The global RO high-pressure pumps market is currently being driven by several key migration patterns and innovations: in particular, the increasing prevalence of smart, connected pump systems with IoT-enabled sensors, real-time monitoring and predictive maintenance capabilities is helping operators of desalination and industrial water treatment plants reduce downtime and optimize energy use. At the same time, a strong trend toward energy-efficient and modular pump designs is emerging, as manufacturers introduce variable-frequency drives (VFDs), permanent-magnet motors and improved hydrodynamic components to meet rising environmental regulations and lower operational costs.
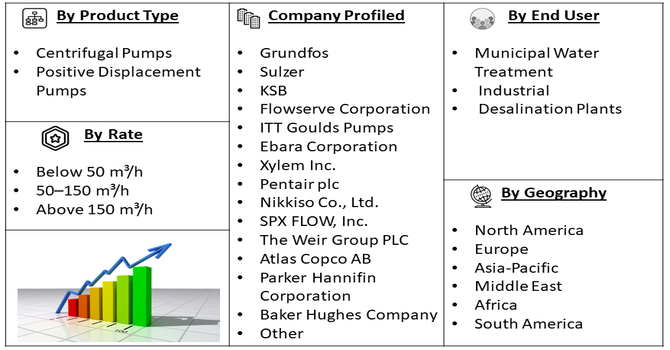
Segmentation: Global RO High Pressure Pumps Market is segmented By Type (Centrifugal Pumps, Positive Displacement Pumps), Flow Rate (Below 50 m³/h, 50–150 m³/h, and Above 150 m³/h), End User (Municipal Water Treatment, Industrial, Desalination Plants), and Geography (North America, Europe, Asia-Pacific, Middle East and Africa, and South America). The report provides the value (in USD million) for the above segments.
For Detailed Market Segmentation - Get a Free Sample PDF
Market Drivers:
- Rising Demand for Desalination and Water Reuse Systems
One of the primary drivers of the Global RO High Pressure Pumps Market is the increasing need for freshwater amid rising global water scarcity. Rapid population growth, industrial expansion, and declining groundwater levels have pushed governments and industries toward desalination and wastewater reuse technologies. Reverse osmosis (RO) systems play a crucial role in producing potable water from seawater and brackish sources, and high-pressure pumps are the core component that enables this process by maintaining the required membrane pressure. Growing investments in large-scale seawater desalination plants across the Middle East, Asia-Pacific, and coastal regions of North America are further boosting market growth.
- Technological Advancements in Pump Efficiency and Energy Savings
Advancements in high-pressure pump design, materials, and control systems are significantly driving market expansion. Modern RO high-pressure pumps feature enhanced energy efficiency, corrosion-resistant materials, and smart monitoring systems that reduce operational costs and extend equipment lifespan.
Navien launched its USA and Canada Roadshow on March 27, 2025, in Anaheim, California, showcasing innovative HVAC products, including air-to-air heat pumps, hydro-furnaces, air handlers, cased coils, and heat pump water heaters. The roadshow visited multiple locations over three months, providing professionals with hands-on experience and guidance. This initiative indirectly boosted the North American RO high-pressure pumps market by raising awareness of advanced water heating and treatment technologies, encouraging integration with energy-efficient and pressure-optimized systems. The integration of variable frequency drives (VFDs) and digital monitoring for predictive maintenance has further improved performance reliability. These innovations not only lower the energy footprint of desalination and water treatment facilities but also make RO systems more economically viable, encouraging broader adoption across municipal and industrial applications.
Market Restraints:
- High Operational and Maintenance Cost
The major restraints in the Global RO High-Pressure Pumps Market is the high operational and maintenance cost associated with these systems. RO high-pressure pumps operate under extreme pressure conditions, requiring substantial energy input and frequent maintenance to ensure consistent performance. This leads to elevated operating costs, particularly in large-scale desalination and industrial water treatment facilities, which can limit adoption in cost-sensitive regions. Additionally, scaling, fouling, and corrosion issues in RO membranes and pump components pose ongoing challenges, often resulting in downtime and expensive replacements. The complex installation process and the need for skilled technical personnel further add to the total system cost.
Socio-Economic Impact on RO High-Pressure Pumps Market
The global RO (Reverse Osmosis) high-pressure pumps market has had a significant socioeconomic impact by improving access to clean and safe water for households, industries, and agriculture. These pumps enabled efficient desalination and water purification, reducing waterborne diseases and supporting public health. The market also created jobs in manufacturing, installation, maintenance, and research, while encouraging technological innovation in energy-efficient and durable pump systems. Industrial and agricultural users benefited from reliable water supply, boosting productivity and economic growth. Additionally, governments and communities gained a sustainable solution for water scarcity challenges. Thus, the market contributed to improved health, economic development, and environmental sustainability, making clean water more accessible and supporting livelihoods worldwide.
Segmental Analysis:
- Centrifugal Pumps segment is expected to witness the highest growth over the forecast period
The centrifugal pump segment dominates the Global RO High Pressure Pumps Market due to its widespread use in desalination and industrial water purification systems. These pumps are preferred for their ability to handle large volumes of water efficiently while maintaining consistent pressure required for RO membrane filtration. Their simple design, reliability, and lower maintenance requirements make them ideal for continuous operation in large-scale plants. Moreover, technological innovations such as multi-stage centrifugal pumps and energy recovery systems have improved efficiency, driving adoption across municipal and industrial applications.
- Desalination Plants segment is expected to witness the highest growth over the forecast period
The desalination plant segment holds the largest share of the market and is projected to grow at a robust rate during the forecast period. Rapid population growth, industrial expansion, and climate change have intensified freshwater scarcity, prompting increased investments in desalination infrastructure. RO high pressure pumps play a vital role in converting seawater into potable water by maintaining the high pressures needed for membrane filtration. The Middle East, North Africa, and parts of Asia-Pacific are key contributors to this segment’s growth due to ongoing large-scale desalination projects.
- Asia-Pacific region is expected to witness the highest growth over the forecast period
The Asia-Pacific region is expected to witness the highest growth in the global RO high-pressure pumps market over the forecast period due to increasing water scarcity, rapid industrialization, and growing population demands.
Countries such as China, India, Japan, and Australia are investing heavily in desalination plants, water treatment facilities, and industrial water reuse projects, driving demand for efficient and durable high-pressure pumps. For instance, in February 2025, Lexcru launched a revolutionary range of RO products at a Grand Product Launch Event in Ahmedabad, unveiling Titanium cabinets, Inbuilt RO + Ionizer, and leak-proof RO fittings. The event, attended by Indian dealers and international guests from over 20 countries, showcased innovations promoting elegance, health, and durability. These advancements drove technological adoption and increased demand for high-efficiency RO high-pressure pumps, boosting the growth of the RO market in the Asia-Pacific region.
Expanding agriculture and food processing sectors also rely on RO systems for clean water supply. Government initiatives to improve water infrastructure, coupled with rising awareness of water conservation, are accelerating adoption. This strong regional growth positions Asia-Pacific as a key driver of innovation, investment, and overall expansion in the global RO high-pressure pumps market.
To Learn More About This Report - Request a Free Sample Copy
RO High-Pressure Pumps Market Competitive Landscape:
The competitive landscape is dominated by established industrial pump manufacturers and specialized OEMs that supply high-pressure, corrosion-resistant pumps for reverse osmosis (RO) desalination, water reuse and industrial water-treatment applications. Key players compete on energy efficiency, materials (anti-corrosion/alloy choices), integration with energy-recovery devices and digital monitoring, aftermarket service networks, and global delivery capability. Strategic partnerships with EPC contractors, desalination plant operators and membrane suppliers—plus investments in R&D for lower-life-cycle-cost designs—are common as companies try to capture large municipal and industrial RO projects.
Key Players:
- Grundfos
- Sulzer
- KSB
- Flowserve Corporation
- ITT Goulds Pumps
- Ebara Corporation
- Xylem Inc.
- Pentair plc
- Nikkiso Co., Ltd.
- SPX FLOW, Inc.
- The Weir Group PLC
- Atlas Copco AB
- Parker Hannifin Corporation
- Baker Hughes Company
- Torishima Pump Mfg. Co., Ltd.
- Shanghai Kaiquan Pump Group Co., Ltd.
- Ruhrpumpen Group
- Kirloskar Brothers Limited
- Ningbo CNP Pump Co., Ltd. (CNP)
- Dover Corporation
Recent Development
- In May 2025, Energy Recovery reported over $7 million in contract awards for its PX Pressure Exchanger energy recovery devices and pumps for multiple seawater RO desalination projects in Spain. The projects were expected to save 280.5 GWh of energy and reduce 135,437 tons of CO2 annually, equivalent to 26,000 cars. These contracts highlighted the critical role of high-efficiency RO high-pressure pumps in energy optimization and sustainable, large-scale desalination operations.
- In March 2025, IDE Water Technologies announced that the Sorek 2 – Be’er Miriam Desalination Plant in Israel began supplying 200 million m³ of water annually. As Israel’s largest and one of the world’s largest desalination plants, it featured the first steam-driven seawater RO system, optimized energy use, carbon capture, and minimal labor requirements. The project advanced demand for high-efficiency RO high-pressure pumps, showcasing their role in large-scale, cost-effective, and energy-optimized water desalination.
Frequently Asked Questions (FAQ) :
Q1. What are the main growth-driving factors for this market?
The key driver is the increasing global scarcity of freshwater, which boosts the demand for water treatment and desalination projects. Reverse osmosis (RO) high-pressure pumps are essential for these processes. Additionally, rapid industrialization and urbanization in emerging economies are putting huge stress on existing water resources. Strict government regulations concerning wastewater treatment quality and industrial process water management further fuel market expansion worldwide.
Q2. What are the main restraining factors for this market?
The market faces restraints mainly due to the high initial capital cost of installing advanced RO systems, including the specialized high-pressure pumps. This factor often limits adoption, especially in developing regions and for smaller projects. Another challenge is the high energy consumption of these systems, which increases operational expenses and raises sustainability concerns, pushing users toward lower-cost alternatives.
Q3. Which segment is expected to witness high growth?
The Desalination application segment is projected to show the highest growth. Driven by severe water shortages in coastal and arid regions, countries are investing heavily in large-scale seawater and brackish water treatment plants. RO high-pressure pumps are the core component in these facilities, ensuring the massive throughput and efficiency required to convert non-potable sources into drinking water for municipalities and industry.
Q4. Who are the top major players for this market?
The market is dominated by global technology leaders known for their reliable, high-efficiency pumping solutions. Key companies include Grundfos, Danfoss A/S, Pentair, and Sulzer Ltd. These players maintain a competitive advantage through strong research and development, allowing them to produce customized, energy-efficient pumps required for various high-pressure RO applications across the industrial, commercial, and municipal sectors.
Q5. Which country is the largest player?
The Asia Pacific region is currently the largest and most influential market. This dominance stems from widespread industrial growth, rapid urbanization, and significant government initiatives focused on water safety and accessibility, particularly in countries like China and India. The region boasts both immense manufacturing capacity for these pumps and a massive consumer base requiring advanced water purification technology.
List of Figures
Figure 1: Global RO High Pressure Pumps Market Revenue Breakdown (USD Billion, %) by Region, 2022 & 2029
Figure 2: Global RO High Pressure Pumps Market Value Share (%), By Segment 1, 2022 & 2029
Figure 3: Global RO High Pressure Pumps Market Forecast (USD Billion), by Sub-Segment 1, 2018-2029
Figure 4: Global RO High Pressure Pumps Market Forecast (USD Billion), by Sub-Segment 2, 2018-2029
Figure 5: Global RO High Pressure Pumps Market Value Share (%), By Segment 2, 2022 & 2029
Figure 6: Global RO High Pressure Pumps Market Forecast (USD Billion), by Sub-Segment 1, 2018-2029
Figure 7: Global RO High Pressure Pumps Market Forecast (USD Billion), by Sub-Segment 2, 2018-2029
Figure 8: Global RO High Pressure Pumps Market Forecast (USD Billion), by Sub-Segment 3, 2018-2029
Figure 9: Global RO High Pressure Pumps Market Forecast (USD Billion), by Others, 2018-2029
Figure 10: Global RO High Pressure Pumps Market Value Share (%), By Segment 3, 2022 & 2029
Figure 11: Global RO High Pressure Pumps Market Forecast (USD Billion), by Sub-Segment 1, 2018-2029
Figure 12: Global RO High Pressure Pumps Market Forecast (USD Billion), by Sub-Segment 2, 2018-2029
Figure 13: Global RO High Pressure Pumps Market Forecast (USD Billion), by Sub-Segment 3, 2018-2029
Figure 14: Global RO High Pressure Pumps Market Forecast (USD Billion), by Others, 2018-2029
Figure 15: Global RO High Pressure Pumps Market Value (USD Billion), by Region, 2022 & 2029
Figure 16: North America RO High Pressure Pumps Market Value Share (%), By Segment 1, 2022 & 2029
Figure 17: North America RO High Pressure Pumps Market Forecast (USD Billion), by Sub-Segment 1, 2018-2029
Figure 18: North America RO High Pressure Pumps Market Forecast (USD Billion), by Sub-Segment 2, 2018-2029
Figure 19: North America RO High Pressure Pumps Market Value Share (%), By Segment 2, 2022 & 2029
Figure 20: North America RO High Pressure Pumps Market Forecast (USD Billion), by Sub-Segment 1, 2018-2029
Figure 21: North America RO High Pressure Pumps Market Forecast (USD Billion), by Sub-Segment 2, 2018-2029
Figure 22: North America RO High Pressure Pumps Market Forecast (USD Billion), by Sub-Segment 3, 2018-2029
Figure 23: North America RO High Pressure Pumps Market Forecast (USD Billion), by Others, 2018-2029
Figure 24: North America RO High Pressure Pumps Market Value Share (%), By Segment 3, 2022 & 2029
Figure 25: North America RO High Pressure Pumps Market Forecast (USD Billion), by Sub-Segment 1, 2018-2029
Figure 26: North America RO High Pressure Pumps Market Forecast (USD Billion), by Sub-Segment 2, 2018-2029
Figure 27: North America RO High Pressure Pumps Market Forecast (USD Billion), by Sub-Segment 3, 2018-2029
Figure 28: North America RO High Pressure Pumps Market Forecast (USD Billion), by Others, 2018-2029
Figure 29: North America RO High Pressure Pumps Market Forecast (USD Billion), by U.S., 2018-2029
Figure 30: North America RO High Pressure Pumps Market Forecast (USD Billion), by Canada, 2018-2029
Figure 31: Latin America RO High Pressure Pumps Market Value Share (%), By Segment 1, 2022 & 2029
Figure 32: Latin America RO High Pressure Pumps Market Forecast (USD Billion), by Sub-Segment 1, 2018-2029
Figure 33: Latin America RO High Pressure Pumps Market Forecast (USD Billion), by Sub-Segment 2, 2018-2029
Figure 34: Latin America RO High Pressure Pumps Market Value Share (%), By Segment 2, 2022 & 2029
Figure 35: Latin America RO High Pressure Pumps Market Forecast (USD Billion), by Sub-Segment 1, 2018-2029
Figure 36: Latin America RO High Pressure Pumps Market Forecast (USD Billion), by Sub-Segment 2, 2018-2029
Figure 37: Latin America RO High Pressure Pumps Market Forecast (USD Billion), by Sub-Segment 3, 2018-2029
Figure 38: Latin America RO High Pressure Pumps Market Forecast (USD Billion), by Others, 2018-2029
Figure 39: Latin America RO High Pressure Pumps Market Value Share (%), By Segment 3, 2022 & 2029
Figure 40: Latin America RO High Pressure Pumps Market Forecast (USD Billion), by Sub-Segment 1, 2018-2029
Figure 41: Latin America RO High Pressure Pumps Market Forecast (USD Billion), by Sub-Segment 2, 2018-2029
Figure 42: Latin America RO High Pressure Pumps Market Forecast (USD Billion), by Sub-Segment 3, 2018-2029
Figure 43: Latin America RO High Pressure Pumps Market Forecast (USD Billion), by Others, 2018-2029
Figure 44: Latin America RO High Pressure Pumps Market Forecast (USD Billion), by Brazil, 2018-2029
Figure 45: Latin America RO High Pressure Pumps Market Forecast (USD Billion), by Mexico, 2018-2029
Figure 46: Latin America RO High Pressure Pumps Market Forecast (USD Billion), by Rest of Latin America, 2018-2029
Figure 47: Europe RO High Pressure Pumps Market Value Share (%), By Segment 1, 2022 & 2029
Figure 48: Europe RO High Pressure Pumps Market Forecast (USD Billion), by Sub-Segment 1, 2018-2029
Figure 49: Europe RO High Pressure Pumps Market Forecast (USD Billion), by Sub-Segment 2, 2018-2029
Figure 50: Europe RO High Pressure Pumps Market Value Share (%), By Segment 2, 2022 & 2029
Figure 51: Europe RO High Pressure Pumps Market Forecast (USD Billion), by Sub-Segment 1, 2018-2029
Figure 52: Europe RO High Pressure Pumps Market Forecast (USD Billion), by Sub-Segment 2, 2018-2029
Figure 53: Europe RO High Pressure Pumps Market Forecast (USD Billion), by Sub-Segment 3, 2018-2029
Figure 54: Europe RO High Pressure Pumps Market Forecast (USD Billion), by Others, 2018-2029
Figure 55: Europe RO High Pressure Pumps Market Value Share (%), By Segment 3, 2022 & 2029
Figure 56: Europe RO High Pressure Pumps Market Forecast (USD Billion), by Sub-Segment 1, 2018-2029
Figure 57: Europe RO High Pressure Pumps Market Forecast (USD Billion), by Sub-Segment 2, 2018-2029
Figure 58: Europe RO High Pressure Pumps Market Forecast (USD Billion), by Sub-Segment 3, 2018-2029
Figure 59: Europe RO High Pressure Pumps Market Forecast (USD Billion), by Others, 2018-2029
Figure 60: Europe RO High Pressure Pumps Market Forecast (USD Billion), by U.K., 2018-2029
Figure 61: Europe RO High Pressure Pumps Market Forecast (USD Billion), by Germany, 2018-2029
Figure 62: Europe RO High Pressure Pumps Market Forecast (USD Billion), by France, 2018-2029
Figure 63: Europe RO High Pressure Pumps Market Forecast (USD Billion), by Italy, 2018-2029
Figure 64: Europe RO High Pressure Pumps Market Forecast (USD Billion), by Spain, 2018-2029
Figure 65: Europe RO High Pressure Pumps Market Forecast (USD Billion), by Russia, 2018-2029
Figure 66: Europe RO High Pressure Pumps Market Forecast (USD Billion), by Rest of Europe, 2018-2029
Figure 67: Asia Pacific RO High Pressure Pumps Market Value Share (%), By Segment 1, 2022 & 2029
Figure 68: Asia Pacific RO High Pressure Pumps Market Forecast (USD Billion), by Sub-Segment 1, 2018-2029
Figure 69: Asia Pacific RO High Pressure Pumps Market Forecast (USD Billion), by Sub-Segment 2, 2018-2029
Figure 70: Asia Pacific RO High Pressure Pumps Market Value Share (%), By Segment 2, 2022 & 2029
Figure 71: Asia Pacific RO High Pressure Pumps Market Forecast (USD Billion), by Sub-Segment 1, 2018-2029
Figure 72: Asia Pacific RO High Pressure Pumps Market Forecast (USD Billion), by Sub-Segment 2, 2018-2029
Figure 73: Asia Pacific RO High Pressure Pumps Market Forecast (USD Billion), by Sub-Segment 3, 2018-2029
Figure 74: Asia Pacific RO High Pressure Pumps Market Forecast (USD Billion), by Others, 2018-2029
Figure 75: Asia Pacific RO High Pressure Pumps Market Value Share (%), By Segment 3, 2022 & 2029
Figure 76: Asia Pacific RO High Pressure Pumps Market Forecast (USD Billion), by Sub-Segment 1, 2018-2029
Figure 77: Asia Pacific RO High Pressure Pumps Market Forecast (USD Billion), by Sub-Segment 2, 2018-2029
Figure 78: Asia Pacific RO High Pressure Pumps Market Forecast (USD Billion), by Sub-Segment 3, 2018-2029
Figure 79: Asia Pacific RO High Pressure Pumps Market Forecast (USD Billion), by Others, 2018-2029
Figure 80: Asia Pacific RO High Pressure Pumps Market Forecast (USD Billion), by China, 2018-2029
Figure 81: Asia Pacific RO High Pressure Pumps Market Forecast (USD Billion), by India, 2018-2029
Figure 82: Asia Pacific RO High Pressure Pumps Market Forecast (USD Billion), by Japan, 2018-2029
Figure 83: Asia Pacific RO High Pressure Pumps Market Forecast (USD Billion), by Australia, 2018-2029
Figure 84: Asia Pacific RO High Pressure Pumps Market Forecast (USD Billion), by Southeast Asia, 2018-2029
Figure 85: Asia Pacific RO High Pressure Pumps Market Forecast (USD Billion), by Rest of Asia Pacific, 2018-2029
Figure 86: Middle East & Africa RO High Pressure Pumps Market Value Share (%), By Segment 1, 2022 & 2029
Figure 87: Middle East & Africa RO High Pressure Pumps Market Forecast (USD Billion), by Sub-Segment 1, 2018-2029
Figure 88: Middle East & Africa RO High Pressure Pumps Market Forecast (USD Billion), by Sub-Segment 2, 2018-2029
Figure 89: Middle East & Africa RO High Pressure Pumps Market Value Share (%), By Segment 2, 2022 & 2029
Figure 90: Middle East & Africa RO High Pressure Pumps Market Forecast (USD Billion), by Sub-Segment 1, 2018-2029
Figure 91: Middle East & Africa RO High Pressure Pumps Market Forecast (USD Billion), by Sub-Segment 2, 2018-2029
Figure 92: Middle East & Africa RO High Pressure Pumps Market Forecast (USD Billion), by Sub-Segment 3, 2018-2029
Figure 93: Middle East & Africa RO High Pressure Pumps Market Forecast (USD Billion), by Others, 2018-2029
Figure 94: Middle East & Africa RO High Pressure Pumps Market Value Share (%), By Segment 3, 2022 & 2029
Figure 95: Middle East & Africa RO High Pressure Pumps Market Forecast (USD Billion), by Sub-Segment 1, 2018-2029
Figure 96: Middle East & Africa RO High Pressure Pumps Market Forecast (USD Billion), by Sub-Segment 2, 2018-2029
Figure 97: Middle East & Africa RO High Pressure Pumps Market Forecast (USD Billion), by Sub-Segment 3, 2018-2029
Figure 98: Middle East & Africa RO High Pressure Pumps Market Forecast (USD Billion), by Others, 2018-2029
Figure 99: Middle East & Africa RO High Pressure Pumps Market Forecast (USD Billion), by GCC, 2018-2029
Figure 100: Middle East & Africa RO High Pressure Pumps Market Forecast (USD Billion), by South Africa, 2018-2029
Figure 101: Middle East & Africa RO High Pressure Pumps Market Forecast (USD Billion), by Rest of Middle East & Africa, 2018-2029
List of Tables
Table 1: Global RO High Pressure Pumps Market Revenue (USD Billion) Forecast, by Segment 1, 2018-2029
Table 2: Global RO High Pressure Pumps Market Revenue (USD Billion) Forecast, by Segment 2, 2018-2029
Table 3: Global RO High Pressure Pumps Market Revenue (USD Billion) Forecast, by Segment 3, 2018-2029
Table 4: Global RO High Pressure Pumps Market Revenue (USD Billion) Forecast, by Region, 2018-2029
Table 5: North America RO High Pressure Pumps Market Revenue (USD Billion) Forecast, by Segment 1, 2018-2029
Table 6: North America RO High Pressure Pumps Market Revenue (USD Billion) Forecast, by Segment 2, 2018-2029
Table 7: North America RO High Pressure Pumps Market Revenue (USD Billion) Forecast, by Segment 3, 2018-2029
Table 8: North America RO High Pressure Pumps Market Revenue (USD Billion) Forecast, by Country, 2018-2029
Table 9: Europe RO High Pressure Pumps Market Revenue (USD Billion) Forecast, by Segment 1, 2018-2029
Table 10: Europe RO High Pressure Pumps Market Revenue (USD Billion) Forecast, by Segment 2, 2018-2029
Table 11: Europe RO High Pressure Pumps Market Revenue (USD Billion) Forecast, by Segment 3, 2018-2029
Table 12: Europe RO High Pressure Pumps Market Revenue (USD Billion) Forecast, by Country, 2018-2029
Table 13: Latin America RO High Pressure Pumps Market Revenue (USD Billion) Forecast, by Segment 1, 2018-2029
Table 14: Latin America RO High Pressure Pumps Market Revenue (USD Billion) Forecast, by Segment 2, 2018-2029
Table 15: Latin America RO High Pressure Pumps Market Revenue (USD Billion) Forecast, by Segment 3, 2018-2029
Table 16: Latin America RO High Pressure Pumps Market Revenue (USD Billion) Forecast, by Country, 2018-2029
Table 17: Asia Pacific RO High Pressure Pumps Market Revenue (USD Billion) Forecast, by Segment 1, 2018-2029
Table 18: Asia Pacific RO High Pressure Pumps Market Revenue (USD Billion) Forecast, by Segment 2, 2018-2029
Table 19: Asia Pacific RO High Pressure Pumps Market Revenue (USD Billion) Forecast, by Segment 3, 2018-2029
Table 20: Asia Pacific RO High Pressure Pumps Market Revenue (USD Billion) Forecast, by Country, 2018-2029
Table 21: Middle East & Africa RO High Pressure Pumps Market Revenue (USD Billion) Forecast, by Segment 1, 2018-2029
Table 22: Middle East & Africa RO High Pressure Pumps Market Revenue (USD Billion) Forecast, by Segment 2, 2018-2029
Table 23: Middle East & Africa RO High Pressure Pumps Market Revenue (USD Billion) Forecast, by Segment 3, 2018-2029
Table 24: Middle East & Africa RO High Pressure Pumps Market Revenue (USD Billion) Forecast, by Country, 2018-2029
Research Process
Data Library Research are conducted by industry experts who offer insight on
industry structure, market segmentations technology assessment and competitive landscape (CL), and penetration, as well as on emerging trends. Their analysis is based on primary interviews (~ 80%) and secondary research (~ 20%) as well as years of professional expertise in their respective industries. Adding to this, by analysing historical trends and current market positions, our analysts predict where the market will be headed for the next five years. Furthermore, the varying trends of segment & categories geographically presented are also studied and the estimated based on the primary & secondary research.
In this particular report from the supply side Data Library Research has conducted primary surveys (interviews) with the key level executives (VP, CEO’s, Marketing Director, Business Development Manager
and SOFT) of the companies that active & prominent as well as the midsized organization
FIGURE 1: DLR RESEARH PROCESS
![research-methodology1]()
Primary Research
Extensive primary research was conducted to gain a deeper insight of the market and industry performance. The analysis is based on both primary and secondary research as well as years of professional expertise in the respective industries.
In addition to analysing current and historical trends, our analysts predict where the market is headed over the next five years.
It varies by segment for these categories geographically presented in the list of market tables. Speaking about this particular report we have conducted primary surveys (interviews) with the key level executives (VP, CEO’s, Marketing Director, Business Development Manager and many more) of the major players active in the market.
Secondary Research
Secondary research was mainly used to collect and identify information useful for the extensive, technical, market-oriented, and Friend’s study of the Global Extra Neutral Alcohol. It was also used to obtain key information about major players, market classification and segmentation according to the industry trends, geographical markets, and developments related to the market and technology perspectives. For this study, analysts have gathered information from various credible sources, such as annual reports, sec filings, journals, white papers, SOFT presentations, and company web sites.
Market Size Estimation
Both, top-down and bottom-up approaches were used to estimate and validate the size of the Global market and to estimate the size of various other dependent submarkets in the overall Extra Neutral Alcohol. The key players in the market were identified through secondary research and their market contributions in the respective geographies were determined through primary and secondary research.
Forecast Model
![research-methodology2]()