Positive Displacement Pumps Market Overview and Analysis

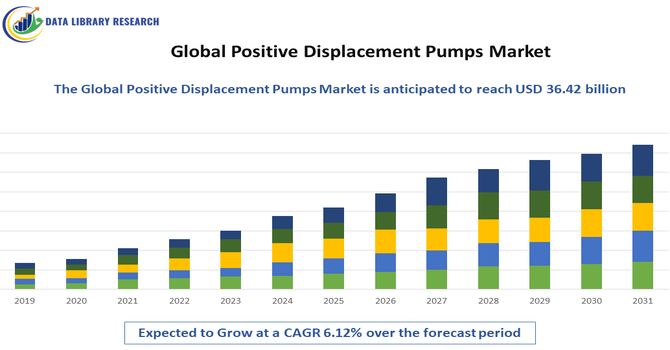
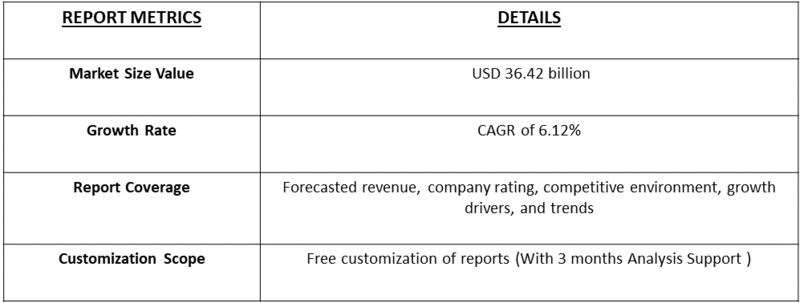
The Positive Displacement Pumps Market is expected to reach USD 27.28 billion in 2026 and grow at a CAGR of 6.12% to reach USD 36.42 billion in 2033.

Positive Displacement Pumps Market

Get Complete Analysis Of The Report - Download Updated Free Sample PDF

The Global Positive Displacement Pumps Market encompasses the production, distribution, and use of pumps designed to move fluids by trapping a fixed amount and forcing it through an outlet. Unlike centrifugal pumps, positive displacement pumps deliver consistent flow regardless of pressure changes, making them ideal for high-viscosity, abrasive, or shear-sensitive liquids. Key types include gear, piston, diaphragm, rotary lobe, and peristaltic pumps, used across industries such as oil and gas, chemical processing, food and beverage, pharmaceuticals, and water treatment. Market growth is driven by industrial automation, stringent environmental regulations, and increasing demand for efficient fluid handling solutions.

Positive Displacement Pumps Market Latest Trends

The Global Positive Displacement Pumps market is experiencing steady growth driven by demand for precise fluid handling across industries like oil & gas, chemical processing, water/wastewater treatment, and food & beverage. Key trends include the development of energy-efficient and smart pump systems with IoT-enabled monitoring and predictive maintenance, improving uptime and reducing lifecycle costs. Rotary and reciprocating designs remain dominant, while emerging technologies such as peristaltic and magnetic-drive pumps gain traction for specialized applications.

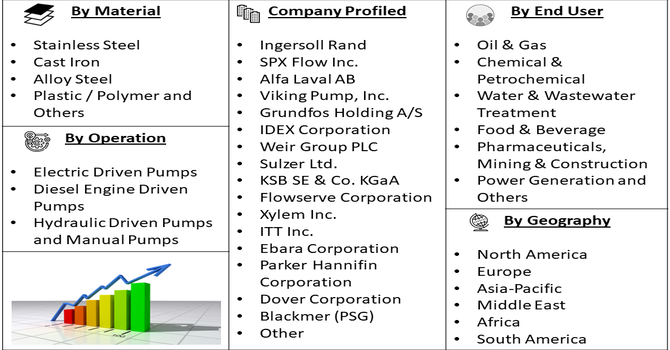
Segmentation: The Global Positive Displacement Pumps market is segmented by Pump Type (Rotary Positive Displacement Pumps (Gear Pumps, Lobe Pumps, Screw Pumps, and Peristaltic Pumps), and Reciprocating Positive Displacement Pumps (Piston Pumps, Plunger Pumps, and Diaphragm Pumps), Discharge Pressure (Low Pressure (Up to 10 bar), Medium Pressure (10–50 bar) and High Pressure (Above 50 bar)), Operation (Electric Driven Pumps, Diesel Engine Driven Pumps, Hydraulic Driven Pumps and Manual Pumps), Material (Stainless Steel, Cast Iron, Alloy Steel, Plastic / Polymer and Others), End-User Industry (Oil & Gas, Chemical & Petrochemical, Water & Wastewater Treatment, Food & Beverage, Pharmaceuticals, Mining & Construction, Power Generation and Others), and Geography (North America, Europe, Asia-Pacific, Middle East and Africa, and South America). The report provides the value (in USD million) for the above segments.

Positive Displacement Pumps Market segment

For Detailed Market Segmentation - Get a Free Sample PDF
 

Market Drivers:

  • Growing industrial automation and process optimization

Growing industrial automation and process optimization is driving demand for positive displacement pumps globally. As manufacturing sectors expand, companies increasingly prioritize precise flow control, consistent delivery, and improved energy efficiency. Positive displacement pumps offer stable output regardless of pressure changes, making them ideal for high-viscosity fluids, chemicals, and dosing applications. Integration with smart sensors and predictive maintenance systems further enhances operational reliability and reduces downtime. As industries such as oil & gas, chemical processing, food & beverage, and pharmaceuticals modernize facilities, the need for advanced fluid-handling solutions continues to rise, supporting market growth.

  • Rising infrastructure investments in water supply and wastewater treatment

Rising infrastructure investments in water supply and wastewater treatment are significantly boosting the positive displacement pumps market. Many regions are upgrading aging water networks and expanding treatment facilities to meet stricter environmental regulations and growing urban populations. Positive displacement pumps are well-suited for handling sludge, viscous fluids, and chemical dosing, ensuring consistent performance under varying conditions.

Government initiatives and public-private partnerships aimed at improving water quality and sustainability have accelerated demand for reliable pumping systems. For instance, EPA’s USD 450 million funding for the New England Heat Pump Accelerator Coalition accelerated global demand for positive displacement pumps by boosting heat pump adoption and related HVAC manufacturing. Increased electric heat pump deployment required more reliable fluid-handling systems, supporting higher sales of positive displacement pumps in residential and commercial heating applications worldwide.

Market Restraints

  • High initial costs and maintenance complexity

High initial costs and maintenance complexity of positive displacement pumps can restrain market growth, particularly for small and medium enterprises. Compared with centrifugal pumps, these systems often require more precise design and specialized components to handle varying fluid viscosities and pressures. Installation, calibration, and ongoing servicing may demand skilled technicians, increasing operational expenses. In addition, the risk of wear and tear when handling abrasive or corrosive fluids can shorten equipment life, further raising lifecycle costs. Budget constraints, especially in developing regions, may lead industries to choose lower-cost alternatives, slowing adoption despite performance advantages.

Socioeconomic Impact on Positive Displacement Pumps Market

The positive displacement pumps market significantly influences global socioeconomic development by supporting essential industrial and municipal infrastructure. Reliable pumps enhance efficiency in oil & gas extraction, chemical manufacturing, and water treatment, facilitating job creation, industrial growth, and public health improvements. Investments in advanced pump technologies contribute to energy savings and reduced environmental impact, aligning with sustainable development goals. Market expansion stimulates manufacturing activity and trade, particularly in emerging economies where industrialization and urbanization fuel equipment demand.

Segmental Analysis:

  • Lobe Pumps segment is expected to witness highest growth over the forecast period

The lobe pumps segment is expected to see the highest growth due to its versatility, gentle fluid handling, and ability to handle viscous and shear-sensitive liquids without damage. Widely used in food & beverage, pharmaceuticals, and wastewater treatment, lobe pumps deliver consistent flow and easy cleanability, meeting stringent hygiene standards. Their modular design allows customization for varied applications, driving adoption across industries focusing on quality and operational efficiency. Continued demand for efficient processing equipment, combined with innovations that reduce energy use and maintenance costs, further supports lobe pumps’ accelerated market growth over the forecast period.

  • Medium Pressure (10–50 bar) segment is expected to witness highest growth over the forecast period

The medium pressure (10–50 bar) segment is projected to grow fastest as it aligns with broad industrial requirements for balanced performance and energy efficiency. This pressure range suits many applications in chemical processing, water treatment, oil & gas, and manufacturing where high pressure is unnecessary but reliable, consistent flow is critical. Medium-pressure pumps offer flexibility, improved safety margins, and lower operational costs compared with high-pressure systems. As industries expand capacity and invest in modern infrastructure, demand for medium-pressure positive displacement pumps is rising due to their adaptability to diverse fluid properties, stable performance, and lower lifecycle expenses.

  • Hydraulic Driven Pumps segment is expected to witness highest growth over the forecast period

The hydraulic driven pumps segment is anticipated to achieve the highest growth owing to its strong suitability for heavy-duty and remote applications. Hydraulic pumps deliver high torque and controlled power, making them ideal for construction, mining, oil & gas, and industrial sectors that require robust performance under variable loads. Their ability to function in areas without reliable electrical infrastructure further fuels adoption. Continuous development in hydraulic systems that improve efficiency, reduce leakage, and offer better integration with mobile equipment enhances their competitiveness. This segment’s momentum reflects increasing demand for durable, high-force pumping solutions where precision and reliability are essential.

  • Alloy Steel segment is expected to witness highest growth over the forecast period

The alloy steel segment is expected to grow fastest due to its exceptional strength, corrosion resistance, and durability under challenging conditions. Alloy steel pumps are increasingly preferred in chemical, petrochemical, oil & gas, and wastewater applications where abrasive fluids and extreme environments demand tougher materials. Superior mechanical properties reduce maintenance frequency and extend service life, lowering total cost of ownership. As industries prioritize long-lasting, high-performance equipment that can withstand thermal, mechanical, and corrosive stress, alloy steel emerges as the material of choice. Ongoing innovations in metallurgy and fabrication further elevate alloy steel’s appeal in demanding pump applications.

  • Water & Wastewater Treatment segment is expected to witness highest growth over the forecast period

The water & wastewater treatment segment is poised for highest growth due to global emphasis on clean water access and environmental sustainability. Aging infrastructure, stricter discharge regulations, and expanding urban populations drive increased investment in advanced pumping solutions for effective fluid management. Positive displacement pumps offer precise flow control and high reliability, essential for handling sludge, chemicals, and varied fluid viscosities typical in treatment facilities. Government initiatives and public–private partnerships to upgrade water systems also boost market demand. As municipalities modernize operations and focus on energy efficiency, this segment’s expansion reflects the critical role of robust pumping technology in ensuring safe, sustainable water services.

  • Asia-Pacific Region is expected to witness highest growth over the forecast period

The Asia-Pacific region is expected to witness the highest growth in the positive displacement pumps market over the forecast period, driven by rapid industrialization, urbanization, and infrastructure development. Expanding oil & gas, chemical, and wastewater treatment sectors in China, India, and Southeast Asia are increasing demand for efficient and reliable fluid-handling solutions.

Additionally, rising investments in power generation and food & beverage processing are boosting pump adoption. For instance, in October 2024, EBARA’s 16 billion yen investment in Japan’s first full-scale liquid hydrogen pump test center is expected to strengthen the Asia-Pacific positive displacement pumps market by driving innovation in cryogenic and high-pressure pump technology. Real-world testing will accelerate development and validation of reliable, efficient pumps for hydrogen production, storage, and fueling infrastructure. This facility will support regional R&D, foster industry collaboration, and boost demand across energy, chemical, and industrial sectors, enhancing Asia-Pacific’s leadership in advanced fluid-handling solutions.

Government initiatives focused on water management and environmental compliance further support market expansion. The presence of manufacturing hubs and growing industrial automation also contribute to accelerated growth in the region. For instance, in 2024, Ingersoll Rand broadened its hydraulics capabilities by acquiring APSCO, Blutek, and UT Pumps, in a deal valued at USD 135 million. Thus, all such factors are fuelling this market’s growth in this region.

Positive Displacement Pumps Market table

To Learn More About This Report - Request a Free Sample Copy
 

Positive Displacement Pumps Market Competitive Landscape

The competitive landscape of the Global Positive Displacement Pumps market is moderately concentrated, featuring established industrial equipment manufacturers competing on technology, product range, and after-sales support. Leading companies such as Ingersoll Rand, SPX Flow, Alfa Laval, Flowserve, Grundfos, and IDEX focus on innovation, digital integration, and expanded service networks to differentiate offerings and capture market share. Competition centers on developing energy-efficient, low-maintenance pumps with enhanced reliability, while strategic partnerships, mergers, and geographic expansion strengthen global footprints. Market players also leverage customization for specific end-use sectors and invest in smart pump technologies to meet evolving customer demands and regulatory standards, creating both competitive challenges and growth opportunities.

The major players for above market are:

  • Ingersoll Rand
  • SPX Flow Inc.
  • Alfa Laval AB
  • Viking Pump, Inc.
  • Grundfos Holding A/S
  • IDEX Corporation
  • Weir Group PLC
  • Sulzer Ltd.
  • KSB SE & Co. KGaA
  • Flowserve Corporation
  • Xylem Inc.
  • ITT Inc.
  • Ebara Corporation
  • Parker Hannifin Corporation
  • Dover Corporation
  • Blackmer (PSG)
  • Netzsch Pumpen & Systeme GmbH
  • SEEPEX GmbH
  • Moyno, Inc.
  • Schlumberger Limited

Recent Development

  • In June 2025, Chart Industries and Flowserve agreed to merge through an all-stock deal, valuing the combined company at around USD 19 billion. The merger is expected to generate annual cost synergies of USD 300 million. 2. In June 2025, Honeywell completed the acquisition of Sundyne for USD 2.16 billion, adding engineered pumps and compressors to its portfolio to strengthen its position in renewable fuels markets.


Frequently Asked Questions (FAQ) :

Q1. What are the main growth-driving factors for this market?

Rapid industrialization and the expansion of the water and wastewater treatment sectors are primary drivers. These pumps are essential for handling high-viscosity fluids in the oil and gas, food and beverage, and pharmaceutical industries. Increasing demand for energy-efficient pumping solutions and stringent environmental regulations regarding fluid handling further propel market growth.

Q2. What are the main restraining factors for this market??

High initial investment costs and significant maintenance requirements act as major deterrents for small-scale enterprises. Positive displacement pumps are technically complex, leading to higher repair expenses compared to centrifugal alternatives. Additionally, fluctuations in raw material prices and the slowing of traditional oil and gas activities in certain regions may hinder market expansion.

Q3. Which segment is expected to witness high growth?

The hydraulic driven pumps segment is expected to grow fastest due to its strong suitability for heavy-duty and remote applications. With high torque, reliable performance under variable loads, and compatibility with mobile equipment, hydraulic pumps are increasingly adopted in construction, mining, and oil & gas, driving market growth over the forecast period.

Q4. Who are the top major players for this market?

Key industry participants include Flowserve Corporation, Grundfos Holding A/S, Sulzer Ltd., and Xylem Inc. Other significant players include Dover Corporation (PSG), ITT Inc., and IDEX Corporation. These companies maintain their market position through continuous R&D, strategic acquisitions, and the development of IoT-integrated smart pumping systems for industrial monitoring.

Q5. Which country is the largest player?

China is the largest player in the global market, driven by its massive manufacturing base and extensive investments in infrastructure. The country’s dominant position is supported by its booming chemical processing industry and large-scale water management projects. Furthermore, local government initiatives promoting industrial automation continue to solidify China’s lead in production and consumption.

Positive Displacement Pumps MARKET STUDY GLOBAL MARKET ANALYSIS, INSIGHTS AND FORECAST, 2022-2029

    1. Introduction

    • 1.1. Research Scope
    • 1.2. Market Segmentation
    • 1.3. Research Methodology
    • 1.4. Definitions and Assumptions

    2. Executive Summary

      3. Market Dynamics

      • 3.1. Market Drivers
      • 3.2. Market Restraints
      • 3.3. Market Opportunities

      4. Key Insights

      • 4.1. Key Emerging Trends – For Major Countries
      • 4.2. Latest Technological Advancement
      • 4.3. Regulatory Landscape
      • 4.4. Industry SWOT Analysis
      • 4.5. Porters Five Forces Analysis

      5. Global Positive Displacement Pumps Market Analysis (USD Billion), Insights and Forecast, 2018-2029

      • 5.1. Key Findings / Summary
      • 5.2. Market Analysis, Insights and Forecast – By Segment 1
        • 5.2.1. Sub-Segment 1
        • 5.2.2. Sub-Segment 2
      • 5.3. Market Analysis, Insights and Forecast – By Segment 2
        • 5.3.1. Sub-Segment 1
        • 5.3.2. Sub-Segment 2
        • 5.3.3. Sub-Segment 3
        • 5.3.4. Others
      • 5.4. Market Analysis, Insights and Forecast – By Segment 3
        • 5.4.1. Sub-Segment 1
        • 5.4.2. Sub-Segment 2
        • 5.4.3. Sub-Segment 3
        • 5.4.4. Others
      • 5.5. Market Analysis, Insights and Forecast – By Region
        • 5.5.1. North America
        • 5.5.2. Latin America
        • 5.5.3. Europe
        • 5.5.4. Asia Pacific
        • 5.5.5. Middle East and Africa

      6. North America Positive Displacement Pumps Market Analysis (USD Billion), Insights and Forecast, 2018-2029

      • 6.1. Key Findings / Summary
      • 6.2. Market Analysis, Insights and Forecast – By Segment 1
        • 6.2.1. Sub-Segment 1
        • 6.2.2. Sub-Segment 2
      • 6.3. Market Analysis, Insights and Forecast – By Segment 2
        • 6.3.1. Sub-Segment 1
        • 6.3.2. Sub-Segment 2
        • 6.3.3. Sub-Segment 3
        • 6.3.4. Others
      • 6.4. Market Analysis, Insights and Forecast – By Segment 3
        • 6.4.1. Sub-Segment 1
        • 6.4.2. Sub-Segment 2
        • 6.4.3. Sub-Segment 3
        • 6.4.4. Others
      • 6.5. Market Analysis, Insights and Forecast – By Country
        • 6.5.1. U.S.
        • 6.5.2. Canada

      7. Latin America Positive Displacement Pumps Market Analysis (USD Billion), Insights and Forecast, 2018-2029

      • 7.1. Key Findings / Summary
      • 7.2. Market Analysis, Insights and Forecast – By Segment 1
        • 7.2.1. Sub-Segment 1
        • 7.2.2. Sub-Segment 2
      • 7.3. Market Analysis, Insights and Forecast – By Segment 2
        • 7.3.1. Sub-Segment 1
        • 7.3.2. Sub-Segment 2
        • 7.3.3. Sub-Segment 3
        • 7.3.4. Others
      • 7.4. Market Analysis, Insights and Forecast – By Segment 3
        • 7.4.1. Sub-Segment 1
        • 7.4.2. Sub-Segment 2
        • 7.4.3. Sub-Segment 3
        • 7.4.4. Others
      • 7.5. Insights and Forecast – By Country
        • 7.5.1. Brazil
        • 7.5.2. Mexico
        • 7.5.3. Rest of Latin America

      8. Europe Positive Displacement Pumps Market Analysis (USD Billion), Insights and Forecast, 2018-2029

      • 8.1. Key Findings / Summary
      • 8.2. Market Analysis, Insights and Forecast – By Segment 1
        • 8.2.1. Sub-Segment 1
        • 8.2.2. Sub-Segment 2
      • 8.3. Market Analysis, Insights and Forecast – By Segment 2
        • 8.3.1. Sub-Segment 1
        • 8.3.2. Sub-Segment 2
        • 8.3.3. Sub-Segment 3
        • 8.3.4. Others
      • 8.4. Market Analysis, Insights and Forecast – By Segment 3
        • 8.4.1. Sub-Segment 1
        • 8.4.2. Sub-Segment 2
        • 8.4.3. Sub-Segment 3
        • 8.4.4. Others
      • 8.5. Market Analysis, Insights and Forecast – By Country
        • 8.5.1. UK
        • 8.5.2. Germany
        • 8.5.3. France
        • 8.5.4. Italy
        • 8.5.5. Spain
        • 8.5.6. Russia
        • 8.5.7. Rest of Europe

      9. Asia Pacific Positive Displacement Pumps Market Analysis (USD Billion), Insights and Forecast, 2018-2029

      • 9.1. Key Findings / Summary
      • 9.2. Market Analysis, Insights and Forecast – By Segment 1
        • 9.2.1. Sub-Segment 1
        • 9.2.2. Sub-Segment 2
      • 9.3. Market Analysis, Insights and Forecast – By Segment 2
        • 9.3.1. Sub-Segment 1
        • 9.3.2. Sub-Segment 2
        • 9.3.3. Sub-Segment 3
        • 9.3.4. Others
      • 9.4. Market Analysis, Insights and Forecast – By Segment 3
        • 9.4.1. Sub-Segment 1
        • 9.4.2. Sub-Segment 2
        • 9.4.3. Sub-Segment 3
        • 9.4.4. Others
      • 9.5. Market Analysis, Insights and Forecast – By Country
        • 9.5.1. China
        • 9.5.2. India
        • 9.5.3. Japan
        • 9.5.4. Australia
        • 9.5.5. South East Asia
        • 9.5.6. Rest of Asia Pacific

      10. Middle East & Africa Positive Displacement Pumps Market Analysis (USD Billion), Insights and Forecast, 2018-2029

      • 10.1. Key Findings / Summary
      • 10.2. Market Analysis, Insights and Forecast – By Segment 1
        • 10.2.1. Sub-Segment 1
        • 10.2.2. Sub-Segment 2
      • 10.3. Market Analysis, Insights and Forecast – By Segment 2
        • 10.3.1. Sub-Segment 1
        • 10.3.2. Sub-Segment 2
        • 10.3.3. Sub-Segment 3
        • 10.3.4. Others
      • 10.4. Market Analysis, Insights and Forecast – By Segment 3
        • 10.4.1. Sub-Segment 1
        • 10.4.2. Sub-Segment 2
        • 10.4.3. Sub-Segment 3
        • 10.4.4. Others
      • 10.5. Market Analysis, Insights and Forecast – By Country
        • 10.5.1. GCC
        • 10.5.2. South Africa
        • 10.5.3. Rest of Middle East & Africa

      11. Competitive Analysis

      • 11.1. Company Market Share Analysis, 2018
      • 11.2. Key Industry Developments
      • 11.3. Company Profile
        • 11.3.1. Company 1
          • 11.3.1.1. Business Overview
          • 11.3.1.2. Segment 1 & Service Offering
          • 11.3.1.3. Overall Revenue
          • 11.3.1.4. Geographic Presence
          • 11.3.1.5. Recent Development
        *Similar details will be provided for the following companies
        • 11.3.2. Company 2
        • 11.3.3. Company 3
        • 11.3.4. Company 4
        • 11.3.5. Company 5
        • 11.3.6. Company 6
        • 11.3.7. Company 7
        • 11.3.8. Company 8
        • 11.3.9. Company 9
        • 11.3.10. Company 10
        • 11.3.11. Company 11
        • 11.3.12. Company 12
      List of Figures

      Figure 1: Global Positive Displacement Pumps Market Revenue Breakdown (USD Billion, %) by Region, 2022 & 2029
      Figure 2: Global Positive Displacement Pumps Market Value Share (%), By Segment 1, 2022 & 2029
      Figure 3: Global Positive Displacement Pumps Market Forecast (USD Billion), by Sub-Segment 1, 2018-2029
      Figure 4: Global Positive Displacement Pumps Market Forecast (USD Billion), by Sub-Segment 2, 2018-2029
      Figure 5: Global Positive Displacement Pumps Market Value Share (%), By Segment 2, 2022 & 2029
      Figure 6: Global Positive Displacement Pumps Market Forecast (USD Billion), by Sub-Segment 1, 2018-2029
      Figure 7: Global Positive Displacement Pumps Market Forecast (USD Billion), by Sub-Segment 2, 2018-2029
      Figure 8: Global Positive Displacement Pumps Market Forecast (USD Billion), by Sub-Segment 3, 2018-2029
      Figure 9: Global Positive Displacement Pumps Market Forecast (USD Billion), by Others, 2018-2029
      Figure 10: Global Positive Displacement Pumps Market Value Share (%), By Segment 3, 2022 & 2029
      Figure 11: Global Positive Displacement Pumps Market Forecast (USD Billion), by Sub-Segment 1, 2018-2029
      Figure 12: Global Positive Displacement Pumps Market Forecast (USD Billion), by Sub-Segment 2, 2018-2029
      Figure 13: Global Positive Displacement Pumps Market Forecast (USD Billion), by Sub-Segment 3, 2018-2029
      Figure 14: Global Positive Displacement Pumps Market Forecast (USD Billion), by Others, 2018-2029
      Figure 15: Global Positive Displacement Pumps Market Value (USD Billion), by Region, 2022 & 2029
      Figure 16: North America Positive Displacement Pumps Market Value Share (%), By Segment 1, 2022 & 2029
      Figure 17: North America Positive Displacement Pumps Market Forecast (USD Billion), by Sub-Segment 1, 2018-2029
      Figure 18: North America Positive Displacement Pumps Market Forecast (USD Billion), by Sub-Segment 2, 2018-2029
      Figure 19: North America Positive Displacement Pumps Market Value Share (%), By Segment 2, 2022 & 2029
      Figure 20: North America Positive Displacement Pumps Market Forecast (USD Billion), by Sub-Segment 1, 2018-2029
      Figure 21: North America Positive Displacement Pumps Market Forecast (USD Billion), by Sub-Segment 2, 2018-2029
      Figure 22: North America Positive Displacement Pumps Market Forecast (USD Billion), by Sub-Segment 3, 2018-2029
      Figure 23: North America Positive Displacement Pumps Market Forecast (USD Billion), by Others, 2018-2029
      Figure 24: North America Positive Displacement Pumps Market Value Share (%), By Segment 3, 2022 & 2029
      Figure 25: North America Positive Displacement Pumps Market Forecast (USD Billion), by Sub-Segment 1, 2018-2029
      Figure 26: North America Positive Displacement Pumps Market Forecast (USD Billion), by Sub-Segment 2, 2018-2029
      Figure 27: North America Positive Displacement Pumps Market Forecast (USD Billion), by Sub-Segment 3, 2018-2029
      Figure 28: North America Positive Displacement Pumps Market Forecast (USD Billion), by Others, 2018-2029
      Figure 29: North America Positive Displacement Pumps Market Forecast (USD Billion), by U.S., 2018-2029
      Figure 30: North America Positive Displacement Pumps Market Forecast (USD Billion), by Canada, 2018-2029
      Figure 31: Latin America Positive Displacement Pumps Market Value Share (%), By Segment 1, 2022 & 2029
      Figure 32: Latin America Positive Displacement Pumps Market Forecast (USD Billion), by Sub-Segment 1, 2018-2029
      Figure 33: Latin America Positive Displacement Pumps Market Forecast (USD Billion), by Sub-Segment 2, 2018-2029
      Figure 34: Latin America Positive Displacement Pumps Market Value Share (%), By Segment 2, 2022 & 2029
      Figure 35: Latin America Positive Displacement Pumps Market Forecast (USD Billion), by Sub-Segment 1, 2018-2029
      Figure 36: Latin America Positive Displacement Pumps Market Forecast (USD Billion), by Sub-Segment 2, 2018-2029
      Figure 37: Latin America Positive Displacement Pumps Market Forecast (USD Billion), by Sub-Segment 3, 2018-2029
      Figure 38: Latin America Positive Displacement Pumps Market Forecast (USD Billion), by Others, 2018-2029
      Figure 39: Latin America Positive Displacement Pumps Market Value Share (%), By Segment 3, 2022 & 2029
      Figure 40: Latin America Positive Displacement Pumps Market Forecast (USD Billion), by Sub-Segment 1, 2018-2029
      Figure 41: Latin America Positive Displacement Pumps Market Forecast (USD Billion), by Sub-Segment 2, 2018-2029
      Figure 42: Latin America Positive Displacement Pumps Market Forecast (USD Billion), by Sub-Segment 3, 2018-2029
      Figure 43: Latin America Positive Displacement Pumps Market Forecast (USD Billion), by Others, 2018-2029
      Figure 44: Latin America Positive Displacement Pumps Market Forecast (USD Billion), by Brazil, 2018-2029
      Figure 45: Latin America Positive Displacement Pumps Market Forecast (USD Billion), by Mexico, 2018-2029
      Figure 46: Latin America Positive Displacement Pumps Market Forecast (USD Billion), by Rest of Latin America, 2018-2029
      Figure 47: Europe Positive Displacement Pumps Market Value Share (%), By Segment 1, 2022 & 2029
      Figure 48: Europe Positive Displacement Pumps Market Forecast (USD Billion), by Sub-Segment 1, 2018-2029
      Figure 49: Europe Positive Displacement Pumps Market Forecast (USD Billion), by Sub-Segment 2, 2018-2029
      Figure 50: Europe Positive Displacement Pumps Market Value Share (%), By Segment 2, 2022 & 2029
      Figure 51: Europe Positive Displacement Pumps Market Forecast (USD Billion), by Sub-Segment 1, 2018-2029
      Figure 52: Europe Positive Displacement Pumps Market Forecast (USD Billion), by Sub-Segment 2, 2018-2029
      Figure 53: Europe Positive Displacement Pumps Market Forecast (USD Billion), by Sub-Segment 3, 2018-2029
      Figure 54: Europe Positive Displacement Pumps Market Forecast (USD Billion), by Others, 2018-2029
      Figure 55: Europe Positive Displacement Pumps Market Value Share (%), By Segment 3, 2022 & 2029
      Figure 56: Europe Positive Displacement Pumps Market Forecast (USD Billion), by Sub-Segment 1, 2018-2029
      Figure 57: Europe Positive Displacement Pumps Market Forecast (USD Billion), by Sub-Segment 2, 2018-2029
      Figure 58: Europe Positive Displacement Pumps Market Forecast (USD Billion), by Sub-Segment 3, 2018-2029
      Figure 59: Europe Positive Displacement Pumps Market Forecast (USD Billion), by Others, 2018-2029
      Figure 60: Europe Positive Displacement Pumps Market Forecast (USD Billion), by U.K., 2018-2029
      Figure 61: Europe Positive Displacement Pumps Market Forecast (USD Billion), by Germany, 2018-2029
      Figure 62: Europe Positive Displacement Pumps Market Forecast (USD Billion), by France, 2018-2029
      Figure 63: Europe Positive Displacement Pumps Market Forecast (USD Billion), by Italy, 2018-2029
      Figure 64: Europe Positive Displacement Pumps Market Forecast (USD Billion), by Spain, 2018-2029
      Figure 65: Europe Positive Displacement Pumps Market Forecast (USD Billion), by Russia, 2018-2029
      Figure 66: Europe Positive Displacement Pumps Market Forecast (USD Billion), by Rest of Europe, 2018-2029
      Figure 67: Asia Pacific Positive Displacement Pumps Market Value Share (%), By Segment 1, 2022 & 2029
      Figure 68: Asia Pacific Positive Displacement Pumps Market Forecast (USD Billion), by Sub-Segment 1, 2018-2029
      Figure 69: Asia Pacific Positive Displacement Pumps Market Forecast (USD Billion), by Sub-Segment 2, 2018-2029
      Figure 70: Asia Pacific Positive Displacement Pumps Market Value Share (%), By Segment 2, 2022 & 2029
      Figure 71: Asia Pacific Positive Displacement Pumps Market Forecast (USD Billion), by Sub-Segment 1, 2018-2029
      Figure 72: Asia Pacific Positive Displacement Pumps Market Forecast (USD Billion), by Sub-Segment 2, 2018-2029
      Figure 73: Asia Pacific Positive Displacement Pumps Market Forecast (USD Billion), by Sub-Segment 3, 2018-2029
      Figure 74: Asia Pacific Positive Displacement Pumps Market Forecast (USD Billion), by Others, 2018-2029
      Figure 75: Asia Pacific Positive Displacement Pumps Market Value Share (%), By Segment 3, 2022 & 2029
      Figure 76: Asia Pacific Positive Displacement Pumps Market Forecast (USD Billion), by Sub-Segment 1, 2018-2029
      Figure 77: Asia Pacific Positive Displacement Pumps Market Forecast (USD Billion), by Sub-Segment 2, 2018-2029
      Figure 78: Asia Pacific Positive Displacement Pumps Market Forecast (USD Billion), by Sub-Segment 3, 2018-2029
      Figure 79: Asia Pacific Positive Displacement Pumps Market Forecast (USD Billion), by Others, 2018-2029
      Figure 80: Asia Pacific Positive Displacement Pumps Market Forecast (USD Billion), by China, 2018-2029
      Figure 81: Asia Pacific Positive Displacement Pumps Market Forecast (USD Billion), by India, 2018-2029
      Figure 82: Asia Pacific Positive Displacement Pumps Market Forecast (USD Billion), by Japan, 2018-2029
      Figure 83: Asia Pacific Positive Displacement Pumps Market Forecast (USD Billion), by Australia, 2018-2029
      Figure 84: Asia Pacific Positive Displacement Pumps Market Forecast (USD Billion), by Southeast Asia, 2018-2029
      Figure 85: Asia Pacific Positive Displacement Pumps Market Forecast (USD Billion), by Rest of Asia Pacific, 2018-2029
      Figure 86: Middle East & Africa Positive Displacement Pumps Market Value Share (%), By Segment 1, 2022 & 2029
      Figure 87: Middle East & Africa Positive Displacement Pumps Market Forecast (USD Billion), by Sub-Segment 1, 2018-2029
      Figure 88: Middle East & Africa Positive Displacement Pumps Market Forecast (USD Billion), by Sub-Segment 2, 2018-2029
      Figure 89: Middle East & Africa Positive Displacement Pumps Market Value Share (%), By Segment 2, 2022 & 2029
      Figure 90: Middle East & Africa Positive Displacement Pumps Market Forecast (USD Billion), by Sub-Segment 1, 2018-2029
      Figure 91: Middle East & Africa Positive Displacement Pumps Market Forecast (USD Billion), by Sub-Segment 2, 2018-2029
      Figure 92: Middle East & Africa Positive Displacement Pumps Market Forecast (USD Billion), by Sub-Segment 3, 2018-2029
      Figure 93: Middle East & Africa Positive Displacement Pumps Market Forecast (USD Billion), by Others, 2018-2029
      Figure 94: Middle East & Africa Positive Displacement Pumps Market Value Share (%), By Segment 3, 2022 & 2029
      Figure 95: Middle East & Africa Positive Displacement Pumps Market Forecast (USD Billion), by Sub-Segment 1, 2018-2029
      Figure 96: Middle East & Africa Positive Displacement Pumps Market Forecast (USD Billion), by Sub-Segment 2, 2018-2029
      Figure 97: Middle East & Africa Positive Displacement Pumps Market Forecast (USD Billion), by Sub-Segment 3, 2018-2029
      Figure 98: Middle East & Africa Positive Displacement Pumps Market Forecast (USD Billion), by Others, 2018-2029
      Figure 99: Middle East & Africa Positive Displacement Pumps Market Forecast (USD Billion), by GCC, 2018-2029
      Figure 100: Middle East & Africa Positive Displacement Pumps Market Forecast (USD Billion), by South Africa, 2018-2029
      Figure 101: Middle East & Africa Positive Displacement Pumps Market Forecast (USD Billion), by Rest of Middle East & Africa, 2018-2029 
      List of Tables
      Table 1: Global Positive Displacement Pumps Market Revenue (USD Billion) Forecast, by Segment 1, 2018-2029
      Table 2: Global Positive Displacement Pumps Market Revenue (USD Billion) Forecast, by Segment 2, 2018-2029
      Table 3: Global Positive Displacement Pumps Market Revenue (USD Billion) Forecast, by Segment 3, 2018-2029
      Table 4: Global Positive Displacement Pumps Market Revenue (USD Billion) Forecast, by Region, 2018-2029
      Table 5: North America Positive Displacement Pumps Market Revenue (USD Billion) Forecast, by Segment 1, 2018-2029
      Table 6: North America Positive Displacement Pumps Market Revenue (USD Billion) Forecast, by Segment 2, 2018-2029
      Table 7: North America Positive Displacement Pumps Market Revenue (USD Billion) Forecast, by Segment 3, 2018-2029
      Table 8: North America Positive Displacement Pumps Market Revenue (USD Billion) Forecast, by Country, 2018-2029
      Table 9: Europe Positive Displacement Pumps Market Revenue (USD Billion) Forecast, by Segment 1, 2018-2029
      Table 10: Europe Positive Displacement Pumps Market Revenue (USD Billion) Forecast, by Segment 2, 2018-2029
      Table 11: Europe Positive Displacement Pumps Market Revenue (USD Billion) Forecast, by Segment 3, 2018-2029
      Table 12: Europe Positive Displacement Pumps Market Revenue (USD Billion) Forecast, by Country, 2018-2029
      Table 13: Latin America Positive Displacement Pumps Market Revenue (USD Billion) Forecast, by Segment 1, 2018-2029
      Table 14: Latin America Positive Displacement Pumps Market Revenue (USD Billion) Forecast, by Segment 2, 2018-2029
      Table 15: Latin America Positive Displacement Pumps Market Revenue (USD Billion) Forecast, by Segment 3, 2018-2029
      Table 16: Latin America Positive Displacement Pumps Market Revenue (USD Billion) Forecast, by Country, 2018-2029
      Table 17: Asia Pacific Positive Displacement Pumps Market Revenue (USD Billion) Forecast, by Segment 1, 2018-2029
      Table 18: Asia Pacific Positive Displacement Pumps Market Revenue (USD Billion) Forecast, by Segment 2, 2018-2029
      Table 19: Asia Pacific Positive Displacement Pumps Market Revenue (USD Billion) Forecast, by Segment 3, 2018-2029
      Table 20: Asia Pacific Positive Displacement Pumps Market Revenue (USD Billion) Forecast, by Country, 2018-2029
      Table 21: Middle East & Africa Positive Displacement Pumps Market Revenue (USD Billion) Forecast, by Segment 1, 2018-2029
      Table 22: Middle East & Africa Positive Displacement Pumps Market Revenue (USD Billion) Forecast, by Segment 2, 2018-2029
      Table 23: Middle East & Africa Positive Displacement Pumps Market Revenue (USD Billion) Forecast, by Segment 3, 2018-2029
      Table 24: Middle East & Africa Positive Displacement Pumps Market Revenue (USD Billion) Forecast, by Country, 2018-2029
      Research Process

      Data Library Research are conducted by industry experts who offer insight on industry structure, market segmentations technology assessment and competitive landscape (CL), and penetration, as well as on emerging trends. Their analysis is based on primary interviews (~ 80%) and secondary research (~ 20%) as well as years of professional expertise in their respective industries. Adding to this, by analysing historical trends and current market positions, our analysts predict where the market will be headed for the next five years. Furthermore, the varying trends of segment & categories geographically presented are also studied and the estimated based on the primary & secondary research.

      In this particular report from the supply side Data Library Research has conducted primary surveys (interviews) with the key level executives (VP, CEO’s, Marketing Director, Business Development Manager and SOFT) of the companies that active & prominent as well as the midsized organization

      FIGURE 1: DLR RESEARH PROCESS

      research-methodology1

      Primary Research

      Extensive primary research was conducted to gain a deeper insight of the market and industry performance. The analysis is based on both primary and secondary research as well as years of professional expertise in the respective industries.

      In addition to analysing current and historical trends, our analysts predict where the market is headed over the next five years.

      It varies by segment for these categories geographically presented in the list of market tables. Speaking about this particular report we have conducted primary surveys (interviews) with the key level executives (VP, CEO’s, Marketing Director, Business Development Manager and many more) of the major players active in the market.

      Secondary Research

      Secondary research was mainly used to collect and identify information useful for the extensive, technical, market-oriented, and Friend’s study of the Global Extra Neutral Alcohol. It was also used to obtain key information about major players, market classification and segmentation according to the industry trends, geographical markets, and developments related to the market and technology perspectives. For this study, analysts have gathered information from various credible sources, such as annual reports, sec filings, journals, white papers, SOFT presentations, and company web sites.

      Market Size Estimation

      Both, top-down and bottom-up approaches were used to estimate and validate the size of the Global market and to estimate the size of various other dependent submarkets in the overall Extra Neutral Alcohol. The key players in the market were identified through secondary research and their market contributions in the respective geographies were determined through primary and secondary research.

      Forecast Model

      research-methodology2