Hydroelectric Cells Market Overview and Analysis:
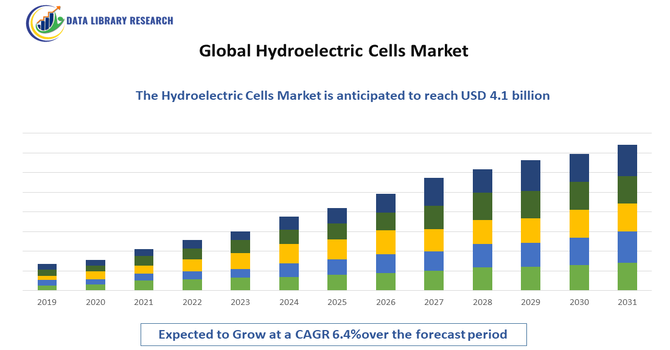
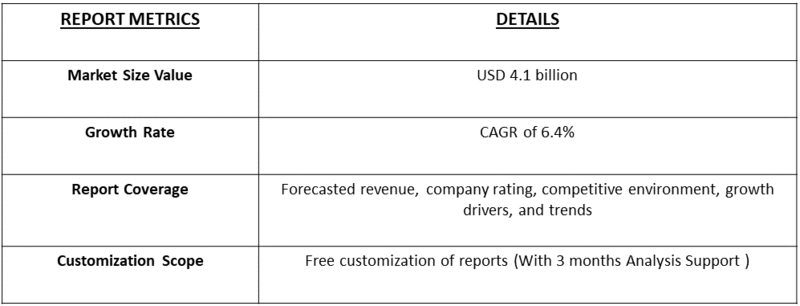
- The market is projected to reach around USD 4.1 billion by 2032, from USD 1.09 billion in the year 2025. The market is anticipated to grow at a healthy CAGR of approximately 6.4% over the forecast period, 2025-2032.
Get Complete Analysis Of The Report - Download Updated Free Sample PDF
The Global Hydroelectric Cells Market is witnessing significant growth driven by the increasing global focus on sustainable and clean energy generation technologies. Unlike conventional fuel-based or battery-powered systems, hydroelectric cells generate electricity directly from water through electrochemical reactions without requiring external power sources or harmful chemicals, making them an eco-friendly alternative. The growing demand for renewable and green energy solutions, coupled with rising environmental awareness and the push for carbon neutrality, is propelling market expansion.
Hydroelectric Cells Market Latest Trends
The Global Hydroelectric Cells Market is witnessing several emerging trends driven by rapid technological innovation and growing sustainability goals. One of the most notable trends is the increasing use of advanced nanomaterials, such as zinc, magnesium, and titanium dioxide-based electrodes, which significantly enhance the electrochemical performance and energy conversion efficiency of hydroelectric cells. Researchers and manufacturers are also focusing on miniaturization and portable designs, making hydroelectric cells suitable for small-scale electronics, sensors, and Internet of Things (IoT) devices. Another key trend is the integration of hydroelectric cells into hybrid renewable systems, combining them with solar or wind energy to ensure continuous and stable power generation.
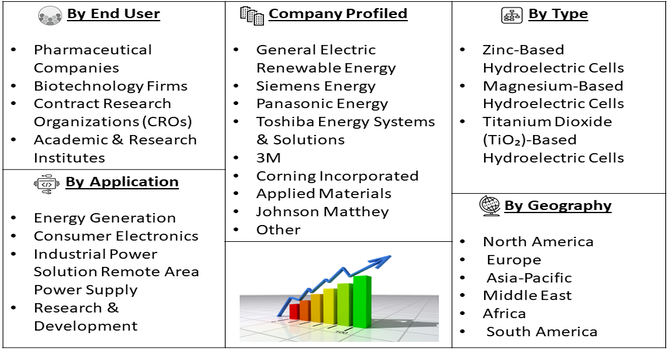
Segmentation: Global Hydroelectric Cells Market is segmented By Material Type (The market is divided into Zinc-Based Hydroelectric Cells, Magnesium-Based Hydroelectric Cells, Titanium Dioxide (TiO₂)-Based Hydroelectric Cells), Application (Energy Generation, Consumer Electronics, Industrial Power Solutions, Remote Area Power Supply, and Research & Development), End User (Residential, Commercial, Industrial, and Defense & Research Institutions), and Geography (North America, Europe, Asia-Pacific, Middle East and Africa, and South America). The report provides the value (in USD million) for the above segments.
For Detailed Market Segmentation - Get a Free Sample PDF
Market Drivers:
- Rising Demand for Clean and Sustainable Energy Sources
The growing global focus on reducing carbon emissions and transitioning toward renewable energy sources is a major driver for the Global Hydroelectric Cells Market. Hydroelectric cells offer an eco-friendly method of generating electricity without external electrolytes or harmful by-products, aligning with global sustainability goals and government initiatives promoting green energy technologies. For instance, in 2025, Indian Ministry of Power reported that India’s total installed electricity capacity had surpassed 500 GW, reaching 500.89 GW, marking a historic milestone in the nation’s energy journey. This achievement reflected years of strong policy support, strategic investments, and coordinated efforts across the power sector. The milestone underscored India’s shift toward clean, reliable, and sustainable energy, driving interest in hydroelectric cells and boosting global demand for technologies that support renewable energy generation and the transition to low-carbon power sources.
- Technological Advancements in Nanomaterial-Based Energy Conversion
Continuous research and development in nanotechnology have significantly enhanced the efficiency and performance of hydroelectric cells. Innovations in materials such as titanium dioxide (TiO₂) and zinc oxide (ZnO) have improved energy conversion rates, durability, and scalability, driving their adoption across renewable energy applications and portable electronic devices. For instance, in 2024, an article published by New Journal of Chemistry, reported that nanostructured materials like graphene, carbon nanotubes, and metal oxides advanced energy applications such as supercapacitors and lithium-ion batteries due to high surface area and tunable properties. Innovations like nanowire/graphene aerogel hybrids improved electrode performance, boosting charge–discharge rates and capacity. These developments enhanced energy storage efficiency and supported scalable, high-performance solutions for sustainable energy technologies.
Market Restraints:
- Limited Commercialization and Lack of Large-Scale Production
One of the key restraints is the limited commercialization and lack of large-scale production capabilities, as hydroelectric cell technology remains largely in the research and prototype phase, with minimal industrial deployment. Additionally, the high initial cost of material synthesis and fabrication using advanced nanomaterials restricts affordability and scalability, particularly in developing regions. Moreover, low awareness and limited technical expertise regarding hydroelectric cell mechanisms among energy manufacturers and consumers further impede market penetration. Lastly, competition from established renewable energy technologies such as solar and wind power, which already have mature infrastructure and policy support, continues to challenge the market’s growth prospects.
Socio Economic Impact on Hydroelectric Cells Market
The Global Hydroelectric Cells Market has notable socioeconomic impacts, driving both economic growth and sustainable energy adoption. By enabling efficient electricity generation from water resources, hydroelectric cells support energy access in urban and rural areas, reducing reliance on fossil fuels and lowering greenhouse gas emissions. This transition creates skilled jobs in manufacturing, installation, and maintenance while fostering local industries and infrastructure development. Affordable, clean energy enhances industrial productivity and household energy security, improving quality of life. Furthermore, government investments in hydroelectric technology stimulate regional economies, making the market a key driver for environmental sustainability, economic development, and social well-being worldwide.
Segmental Analysis:
- Titanium Dioxide (TiO₂)-Based Hydroelectric Cells segment is expected to witness highest growth over the forecast period
The Titanium Dioxide (TiO₂)-Based Hydroelectric Cells segment is expected to hold a significant share during the forecast period, owing to their superior photocatalytic properties, long-term stability, and cost-effectiveness. TiO₂-based cells have demonstrated high efficiency in converting water molecules into electrical energy under ambient conditions, making them ideal for clean and sustainable energy generation. Ongoing research and innovation in nanostructured TiO₂ materials are further boosting the performance and scalability of these cells for commercial use.
- Energy Generation segment is expected to witness highest growth over the forecast period
The Energy Generation segment dominates the market, as hydroelectric cells are increasingly being explored for their potential to provide continuous, low-maintenance, and environmentally friendly power generation. Their ability to operate without external electrolytes or complex infrastructure makes them suitable for distributed and small-scale power generation projects, particularly in regions with water resource availability.
- Industrial segment is expected to witness highest growth over the forecast period
The Industrial segment is projected to grow at the fastest rate, driven by the rising adoption of sustainable and renewable energy solutions to power industrial operations. Industries are increasingly integrating hydroelectric cells into their energy portfolios to reduce carbon emissions and achieve operational efficiency through decentralized energy generation systems.
Growth in the Industrial segment was further supported by expanding manufacturing activities and the push for sustainable, energy-efficient materials. Magnesium’s versatility in reducing weight while maintaining strength made it a preferred choice for machinery, transportation, and structural applications. Combined with government initiatives promoting domestic production of critical minerals, the industrial demand for magnesium surged, reinforcing the segment’s dominance in the market during the forecast period.
- North America region is expected to witness highest growth over the forecast period
The North America region is expected to witness the highest growth over the forecast period, driven by increasing investments in renewable energy technologies, strong research and development activities, and growing government support for sustainable power generation solutions. The region’s focus on reducing carbon emissions and transitioning toward cleaner energy alternatives is accelerating the adoption of hydroelectric cells across diverse sectors, including industrial, commercial, and residential applications. Additionally, the presence of leading technology developers, favorable regulatory frameworks, and rising consumer awareness regarding green energy are further propelling market expansion in North America.
To Learn More About This Report - Request a Free Sample Copy
Hydroelectric Cells Market Competitive Landscape:
The competitive landscape of the Global Hydroelectric Cells market is emerging and fragmented, featuring established energy and advanced-materials firms, specialized nanotechnology suppliers, and nimble startups; competition centers on materials science (electrode composition and nanostructuring), IP and patents, scale-up/manufacturing capabilities, strategic research partnerships, and pilot deployments with industrial and defense customers — while collaborations between academic labs and commercial players are common as the technology moves from lab to early commercialization.
Key Players:
- General Electric Renewable Energy
- Siemens Energy
- Panasonic Energy
- Toshiba Energy Systems & Solutions
- 3M
- Corning Incorporated
- Applied Materials
- Johnson Matthey
- Saint-Gobain
- Fraunhofer-Gesellschaft
- HydroCell Technologies
- AquaVolt Labs
- NanoHydro Solutions
- MagCell Systems
- TiO2 Power Ltd.
- ZnTech Energy
- AquaEnergy Innovations
- MIT SpinTech Ventures
- Nanosys Energy
- BlueHydro Systems
Recent Development
- In January 2025, Researchers at the National Institute of Technology Rourkela (NIT Rourkela) developed a new class of magnesium-based cathode materials for lithium-ion batteries, aiming to make electric vehicle (EV) batteries more affordable and longer-lasting. This innovation addressed the high cost, limited availability, and ethical concerns of cobalt, traditionally used in battery cathodes. Magnesium offered a sustainable alternative, reducing reliance on cobalt while maintaining performance for devices like smartphones, laptops, and EVs.
- In 2025, Magrathea introduced a next-generation magnesium chloride electrolyzer at its pilot facility in Oakland, California, to produce magnesium metal from seawater. The electrolyzer used electricity to split magnesium salts, supporting applications in aluminum alloys, steel, automotive, aerospace, and defense. The launch advanced technical and data frameworks for future large-scale production and strategically positioned Magrathea to supply U.S.-based critical minerals, helping domestic companies navigate shifting trade policies and export controls.
Frequently Asked Questions (FAQ) :
Q1. What are the main growth-driving factors for this market?
The primary driver is the rising demand for sustainable, off-grid power solutions for remote sensors and low-power IoT devices. Hydroelectric cells offer a unique, perpetual energy source by harnessing environmental moisture. Growth is also fueled by intense research into self-powered electronics and wearable technology, where their small size and ability to operate independently of sunlight (unlike solar cells) provide a distinct competitive advantage in specialized applications.
Q2. What are the main restraining factors for this market?
A significant constraint is the very low power output of current hydroelectric cell technology, limiting its use to extremely low-consumption devices. The market also struggles with material and manufacturing challenges in scaling production of the complex nanofiber membranes required. Furthermore, the performance variability depending on humidity levels and ambient temperature makes them unreliable in diverse or rapidly changing geographical climates.
Q3. Which segment is expected to witness high growth?
The Industrial segment was expected to witness the highest growth over the forecast period due to increasing demand for magnesium and its alloys in automotive, aerospace, defense, and construction industries. Rising use of lightweight, high-strength materials to improve efficiency and reduce emissions drove adoption. Additionally, technological advancements in production and processing supported rapid industrial applications, fueling sustained market expansion.
Q4. Who are the top major players for this market?
As an emerging market, it is dominated by academic institutions and specialized material science startups rather than large corporations. Key players are often research teams and companies focused on nanomaterial synthesis, such as those spun out from major universities. Competition centers entirely on developing materials with higher power density and longer operational lifespan, with the major tech giants closely watching for promising commercialization opportunities to acquire.
Q5. Which country is the largest player?
The United States is currently the largest player, primarily due to its immense investment in fundamental materials science and nanotechnology R&D through federal grants and top university labs. The country has the highest volume of published patents and research papers in this specialized field. However, South Korea and China are rapidly increasing investment, aiming to quickly translate lab breakthroughs into scalable, commercial manufacturing processes for integration into their domestic electronics industries.
List of Figures
Figure 1: Global Hydroelectric Cells Market Revenue Breakdown (USD Billion, %) by Region, 2022 & 2029
Figure 2: Global Hydroelectric Cells Market Value Share (%), By Segment 1, 2022 & 2029
Figure 3: Global Hydroelectric Cells Market Forecast (USD Billion), by Sub-Segment 1, 2018-2029
Figure 4: Global Hydroelectric Cells Market Forecast (USD Billion), by Sub-Segment 2, 2018-2029
Figure 5: Global Hydroelectric Cells Market Value Share (%), By Segment 2, 2022 & 2029
Figure 6: Global Hydroelectric Cells Market Forecast (USD Billion), by Sub-Segment 1, 2018-2029
Figure 7: Global Hydroelectric Cells Market Forecast (USD Billion), by Sub-Segment 2, 2018-2029
Figure 8: Global Hydroelectric Cells Market Forecast (USD Billion), by Sub-Segment 3, 2018-2029
Figure 9: Global Hydroelectric Cells Market Forecast (USD Billion), by Others, 2018-2029
Figure 10: Global Hydroelectric Cells Market Value Share (%), By Segment 3, 2022 & 2029
Figure 11: Global Hydroelectric Cells Market Forecast (USD Billion), by Sub-Segment 1, 2018-2029
Figure 12: Global Hydroelectric Cells Market Forecast (USD Billion), by Sub-Segment 2, 2018-2029
Figure 13: Global Hydroelectric Cells Market Forecast (USD Billion), by Sub-Segment 3, 2018-2029
Figure 14: Global Hydroelectric Cells Market Forecast (USD Billion), by Others, 2018-2029
Figure 15: Global Hydroelectric Cells Market Value (USD Billion), by Region, 2022 & 2029
Figure 16: North America Hydroelectric Cells Market Value Share (%), By Segment 1, 2022 & 2029
Figure 17: North America Hydroelectric Cells Market Forecast (USD Billion), by Sub-Segment 1, 2018-2029
Figure 18: North America Hydroelectric Cells Market Forecast (USD Billion), by Sub-Segment 2, 2018-2029
Figure 19: North America Hydroelectric Cells Market Value Share (%), By Segment 2, 2022 & 2029
Figure 20: North America Hydroelectric Cells Market Forecast (USD Billion), by Sub-Segment 1, 2018-2029
Figure 21: North America Hydroelectric Cells Market Forecast (USD Billion), by Sub-Segment 2, 2018-2029
Figure 22: North America Hydroelectric Cells Market Forecast (USD Billion), by Sub-Segment 3, 2018-2029
Figure 23: North America Hydroelectric Cells Market Forecast (USD Billion), by Others, 2018-2029
Figure 24: North America Hydroelectric Cells Market Value Share (%), By Segment 3, 2022 & 2029
Figure 25: North America Hydroelectric Cells Market Forecast (USD Billion), by Sub-Segment 1, 2018-2029
Figure 26: North America Hydroelectric Cells Market Forecast (USD Billion), by Sub-Segment 2, 2018-2029
Figure 27: North America Hydroelectric Cells Market Forecast (USD Billion), by Sub-Segment 3, 2018-2029
Figure 28: North America Hydroelectric Cells Market Forecast (USD Billion), by Others, 2018-2029
Figure 29: North America Hydroelectric Cells Market Forecast (USD Billion), by U.S., 2018-2029
Figure 30: North America Hydroelectric Cells Market Forecast (USD Billion), by Canada, 2018-2029
Figure 31: Latin America Hydroelectric Cells Market Value Share (%), By Segment 1, 2022 & 2029
Figure 32: Latin America Hydroelectric Cells Market Forecast (USD Billion), by Sub-Segment 1, 2018-2029
Figure 33: Latin America Hydroelectric Cells Market Forecast (USD Billion), by Sub-Segment 2, 2018-2029
Figure 34: Latin America Hydroelectric Cells Market Value Share (%), By Segment 2, 2022 & 2029
Figure 35: Latin America Hydroelectric Cells Market Forecast (USD Billion), by Sub-Segment 1, 2018-2029
Figure 36: Latin America Hydroelectric Cells Market Forecast (USD Billion), by Sub-Segment 2, 2018-2029
Figure 37: Latin America Hydroelectric Cells Market Forecast (USD Billion), by Sub-Segment 3, 2018-2029
Figure 38: Latin America Hydroelectric Cells Market Forecast (USD Billion), by Others, 2018-2029
Figure 39: Latin America Hydroelectric Cells Market Value Share (%), By Segment 3, 2022 & 2029
Figure 40: Latin America Hydroelectric Cells Market Forecast (USD Billion), by Sub-Segment 1, 2018-2029
Figure 41: Latin America Hydroelectric Cells Market Forecast (USD Billion), by Sub-Segment 2, 2018-2029
Figure 42: Latin America Hydroelectric Cells Market Forecast (USD Billion), by Sub-Segment 3, 2018-2029
Figure 43: Latin America Hydroelectric Cells Market Forecast (USD Billion), by Others, 2018-2029
Figure 44: Latin America Hydroelectric Cells Market Forecast (USD Billion), by Brazil, 2018-2029
Figure 45: Latin America Hydroelectric Cells Market Forecast (USD Billion), by Mexico, 2018-2029
Figure 46: Latin America Hydroelectric Cells Market Forecast (USD Billion), by Rest of Latin America, 2018-2029
Figure 47: Europe Hydroelectric Cells Market Value Share (%), By Segment 1, 2022 & 2029
Figure 48: Europe Hydroelectric Cells Market Forecast (USD Billion), by Sub-Segment 1, 2018-2029
Figure 49: Europe Hydroelectric Cells Market Forecast (USD Billion), by Sub-Segment 2, 2018-2029
Figure 50: Europe Hydroelectric Cells Market Value Share (%), By Segment 2, 2022 & 2029
Figure 51: Europe Hydroelectric Cells Market Forecast (USD Billion), by Sub-Segment 1, 2018-2029
Figure 52: Europe Hydroelectric Cells Market Forecast (USD Billion), by Sub-Segment 2, 2018-2029
Figure 53: Europe Hydroelectric Cells Market Forecast (USD Billion), by Sub-Segment 3, 2018-2029
Figure 54: Europe Hydroelectric Cells Market Forecast (USD Billion), by Others, 2018-2029
Figure 55: Europe Hydroelectric Cells Market Value Share (%), By Segment 3, 2022 & 2029
Figure 56: Europe Hydroelectric Cells Market Forecast (USD Billion), by Sub-Segment 1, 2018-2029
Figure 57: Europe Hydroelectric Cells Market Forecast (USD Billion), by Sub-Segment 2, 2018-2029
Figure 58: Europe Hydroelectric Cells Market Forecast (USD Billion), by Sub-Segment 3, 2018-2029
Figure 59: Europe Hydroelectric Cells Market Forecast (USD Billion), by Others, 2018-2029
Figure 60: Europe Hydroelectric Cells Market Forecast (USD Billion), by U.K., 2018-2029
Figure 61: Europe Hydroelectric Cells Market Forecast (USD Billion), by Germany, 2018-2029
Figure 62: Europe Hydroelectric Cells Market Forecast (USD Billion), by France, 2018-2029
Figure 63: Europe Hydroelectric Cells Market Forecast (USD Billion), by Italy, 2018-2029
Figure 64: Europe Hydroelectric Cells Market Forecast (USD Billion), by Spain, 2018-2029
Figure 65: Europe Hydroelectric Cells Market Forecast (USD Billion), by Russia, 2018-2029
Figure 66: Europe Hydroelectric Cells Market Forecast (USD Billion), by Rest of Europe, 2018-2029
Figure 67: Asia Pacific Hydroelectric Cells Market Value Share (%), By Segment 1, 2022 & 2029
Figure 68: Asia Pacific Hydroelectric Cells Market Forecast (USD Billion), by Sub-Segment 1, 2018-2029
Figure 69: Asia Pacific Hydroelectric Cells Market Forecast (USD Billion), by Sub-Segment 2, 2018-2029
Figure 70: Asia Pacific Hydroelectric Cells Market Value Share (%), By Segment 2, 2022 & 2029
Figure 71: Asia Pacific Hydroelectric Cells Market Forecast (USD Billion), by Sub-Segment 1, 2018-2029
Figure 72: Asia Pacific Hydroelectric Cells Market Forecast (USD Billion), by Sub-Segment 2, 2018-2029
Figure 73: Asia Pacific Hydroelectric Cells Market Forecast (USD Billion), by Sub-Segment 3, 2018-2029
Figure 74: Asia Pacific Hydroelectric Cells Market Forecast (USD Billion), by Others, 2018-2029
Figure 75: Asia Pacific Hydroelectric Cells Market Value Share (%), By Segment 3, 2022 & 2029
Figure 76: Asia Pacific Hydroelectric Cells Market Forecast (USD Billion), by Sub-Segment 1, 2018-2029
Figure 77: Asia Pacific Hydroelectric Cells Market Forecast (USD Billion), by Sub-Segment 2, 2018-2029
Figure 78: Asia Pacific Hydroelectric Cells Market Forecast (USD Billion), by Sub-Segment 3, 2018-2029
Figure 79: Asia Pacific Hydroelectric Cells Market Forecast (USD Billion), by Others, 2018-2029
Figure 80: Asia Pacific Hydroelectric Cells Market Forecast (USD Billion), by China, 2018-2029
Figure 81: Asia Pacific Hydroelectric Cells Market Forecast (USD Billion), by India, 2018-2029
Figure 82: Asia Pacific Hydroelectric Cells Market Forecast (USD Billion), by Japan, 2018-2029
Figure 83: Asia Pacific Hydroelectric Cells Market Forecast (USD Billion), by Australia, 2018-2029
Figure 84: Asia Pacific Hydroelectric Cells Market Forecast (USD Billion), by Southeast Asia, 2018-2029
Figure 85: Asia Pacific Hydroelectric Cells Market Forecast (USD Billion), by Rest of Asia Pacific, 2018-2029
Figure 86: Middle East & Africa Hydroelectric Cells Market Value Share (%), By Segment 1, 2022 & 2029
Figure 87: Middle East & Africa Hydroelectric Cells Market Forecast (USD Billion), by Sub-Segment 1, 2018-2029
Figure 88: Middle East & Africa Hydroelectric Cells Market Forecast (USD Billion), by Sub-Segment 2, 2018-2029
Figure 89: Middle East & Africa Hydroelectric Cells Market Value Share (%), By Segment 2, 2022 & 2029
Figure 90: Middle East & Africa Hydroelectric Cells Market Forecast (USD Billion), by Sub-Segment 1, 2018-2029
Figure 91: Middle East & Africa Hydroelectric Cells Market Forecast (USD Billion), by Sub-Segment 2, 2018-2029
Figure 92: Middle East & Africa Hydroelectric Cells Market Forecast (USD Billion), by Sub-Segment 3, 2018-2029
Figure 93: Middle East & Africa Hydroelectric Cells Market Forecast (USD Billion), by Others, 2018-2029
Figure 94: Middle East & Africa Hydroelectric Cells Market Value Share (%), By Segment 3, 2022 & 2029
Figure 95: Middle East & Africa Hydroelectric Cells Market Forecast (USD Billion), by Sub-Segment 1, 2018-2029
Figure 96: Middle East & Africa Hydroelectric Cells Market Forecast (USD Billion), by Sub-Segment 2, 2018-2029
Figure 97: Middle East & Africa Hydroelectric Cells Market Forecast (USD Billion), by Sub-Segment 3, 2018-2029
Figure 98: Middle East & Africa Hydroelectric Cells Market Forecast (USD Billion), by Others, 2018-2029
Figure 99: Middle East & Africa Hydroelectric Cells Market Forecast (USD Billion), by GCC, 2018-2029
Figure 100: Middle East & Africa Hydroelectric Cells Market Forecast (USD Billion), by South Africa, 2018-2029
Figure 101: Middle East & Africa Hydroelectric Cells Market Forecast (USD Billion), by Rest of Middle East & Africa, 2018-2029
List of Tables
Table 1: Global Hydroelectric Cells Market Revenue (USD Billion) Forecast, by Segment 1, 2018-2029
Table 2: Global Hydroelectric Cells Market Revenue (USD Billion) Forecast, by Segment 2, 2018-2029
Table 3: Global Hydroelectric Cells Market Revenue (USD Billion) Forecast, by Segment 3, 2018-2029
Table 4: Global Hydroelectric Cells Market Revenue (USD Billion) Forecast, by Region, 2018-2029
Table 5: North America Hydroelectric Cells Market Revenue (USD Billion) Forecast, by Segment 1, 2018-2029
Table 6: North America Hydroelectric Cells Market Revenue (USD Billion) Forecast, by Segment 2, 2018-2029
Table 7: North America Hydroelectric Cells Market Revenue (USD Billion) Forecast, by Segment 3, 2018-2029
Table 8: North America Hydroelectric Cells Market Revenue (USD Billion) Forecast, by Country, 2018-2029
Table 9: Europe Hydroelectric Cells Market Revenue (USD Billion) Forecast, by Segment 1, 2018-2029
Table 10: Europe Hydroelectric Cells Market Revenue (USD Billion) Forecast, by Segment 2, 2018-2029
Table 11: Europe Hydroelectric Cells Market Revenue (USD Billion) Forecast, by Segment 3, 2018-2029
Table 12: Europe Hydroelectric Cells Market Revenue (USD Billion) Forecast, by Country, 2018-2029
Table 13: Latin America Hydroelectric Cells Market Revenue (USD Billion) Forecast, by Segment 1, 2018-2029
Table 14: Latin America Hydroelectric Cells Market Revenue (USD Billion) Forecast, by Segment 2, 2018-2029
Table 15: Latin America Hydroelectric Cells Market Revenue (USD Billion) Forecast, by Segment 3, 2018-2029
Table 16: Latin America Hydroelectric Cells Market Revenue (USD Billion) Forecast, by Country, 2018-2029
Table 17: Asia Pacific Hydroelectric Cells Market Revenue (USD Billion) Forecast, by Segment 1, 2018-2029
Table 18: Asia Pacific Hydroelectric Cells Market Revenue (USD Billion) Forecast, by Segment 2, 2018-2029
Table 19: Asia Pacific Hydroelectric Cells Market Revenue (USD Billion) Forecast, by Segment 3, 2018-2029
Table 20: Asia Pacific Hydroelectric Cells Market Revenue (USD Billion) Forecast, by Country, 2018-2029
Table 21: Middle East & Africa Hydroelectric Cells Market Revenue (USD Billion) Forecast, by Segment 1, 2018-2029
Table 22: Middle East & Africa Hydroelectric Cells Market Revenue (USD Billion) Forecast, by Segment 2, 2018-2029
Table 23: Middle East & Africa Hydroelectric Cells Market Revenue (USD Billion) Forecast, by Segment 3, 2018-2029
Table 24: Middle East & Africa Hydroelectric Cells Market Revenue (USD Billion) Forecast, by Country, 2018-2029
Research Process
Data Library Research are conducted by industry experts who offer insight on
industry structure, market segmentations technology assessment and competitive landscape (CL), and penetration, as well as on emerging trends. Their analysis is based on primary interviews (~ 80%) and secondary research (~ 20%) as well as years of professional expertise in their respective industries. Adding to this, by analysing historical trends and current market positions, our analysts predict where the market will be headed for the next five years. Furthermore, the varying trends of segment & categories geographically presented are also studied and the estimated based on the primary & secondary research.
In this particular report from the supply side Data Library Research has conducted primary surveys (interviews) with the key level executives (VP, CEO’s, Marketing Director, Business Development Manager
and SOFT) of the companies that active & prominent as well as the midsized organization
FIGURE 1: DLR RESEARH PROCESS
![research-methodology1]()
Primary Research
Extensive primary research was conducted to gain a deeper insight of the market and industry performance. The analysis is based on both primary and secondary research as well as years of professional expertise in the respective industries.
In addition to analysing current and historical trends, our analysts predict where the market is headed over the next five years.
It varies by segment for these categories geographically presented in the list of market tables. Speaking about this particular report we have conducted primary surveys (interviews) with the key level executives (VP, CEO’s, Marketing Director, Business Development Manager and many more) of the major players active in the market.
Secondary Research
Secondary research was mainly used to collect and identify information useful for the extensive, technical, market-oriented, and Friend’s study of the Global Extra Neutral Alcohol. It was also used to obtain key information about major players, market classification and segmentation according to the industry trends, geographical markets, and developments related to the market and technology perspectives. For this study, analysts have gathered information from various credible sources, such as annual reports, sec filings, journals, white papers, SOFT presentations, and company web sites.
Market Size Estimation
Both, top-down and bottom-up approaches were used to estimate and validate the size of the Global market and to estimate the size of various other dependent submarkets in the overall Extra Neutral Alcohol. The key players in the market were identified through secondary research and their market contributions in the respective geographies were determined through primary and secondary research.
Forecast Model
![research-methodology2]()