OTC Antihistamine Market Overview and Analysis:

The overall Antihistamine Market is projected to reach approximately USD 381 million in 2025, to USD 666 billion by 2032. The market is forecast to exhibit steady, healthy expansion, with the CAGR of 8.96% over the forecast period, 2025-2032.

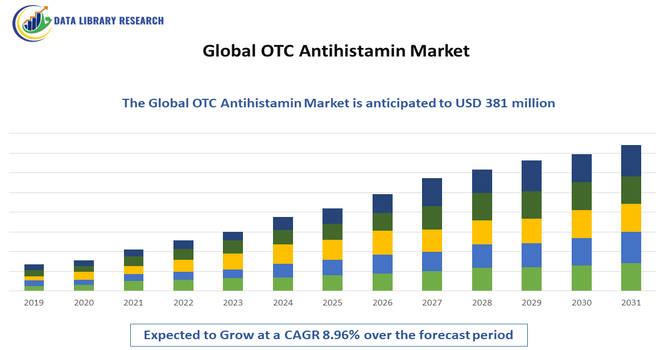
The Global OTC Antihistamine Market is witnessing strong growth driven primarily by the rising prevalence of allergic conditions such as allergic rhinitis, urticaria, asthma-related allergy symptoms, and seasonal pollen allergies. Increasing environmental pollution, climate change–induced allergen shifts, and greater exposure to dust mites and pet allergens are contributing to higher allergy incidence across both developed and developing regions. Consumer preference for self-medication and easy accessibility to over-the-counter medications without prescriptions has further accelerated market demand, especially with the expansion of retail pharmacy chains, e-commerce platforms, and online health product distribution.

OTC Antihistamine Market Latest Trends:

The Global OTC Antihistamine Market is experiencing several emerging trends that are reshaping product development, distribution, and consumer usage patterns. One of the key trends is the growing demand for non-sedating second- and third-generation antihistamines, such as loratadine, cetirizine, and fexofenadine, which offer longer-lasting symptom relief with fewer side effects compared to older formulations. Combination therapies, including antihistamine–decongestant blends and multi-symptom relief products, are gaining traction as consumers seek comprehensive allergy management solutions in a single dose. Another major trend is the rapid expansion of digital retail channels, with e-commerce platforms and telemedicine consultations significantly increasing access to OTC allergy treatments.

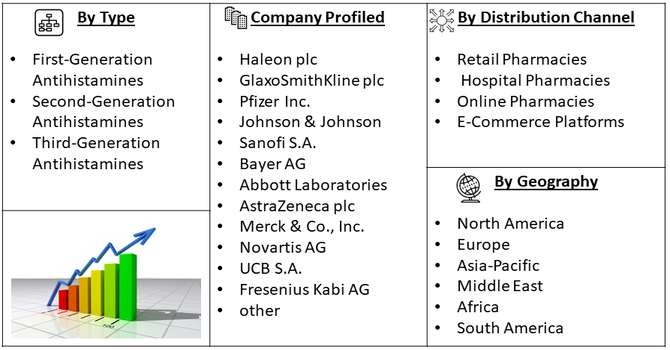
Segmentation: Global OTC Antihistamine Market is segmented By Drug Type (First-Generation Antihistamines, Second-Generation Antihistamines, Third-Generation Antihistamines), Formulation (Tablets and Capsules, Liquids and Syrups, Nasal Sprays, Gummies and Chewables), Distribution Channel (Retail Pharmacies, Hospital Pharmacies, Online Pharmacies and E-Commerce Platforms), and Geography (North America, Europe, Asia-Pacific, Middle East and Africa, and South America). The report provides the value (in USD million) for the above segments.

Market Drivers:

  • Increasing Prevalence of Allergic Disorders

A major driver of the Global OTC Antihistamine Market is the rising prevalence of allergic conditions, including seasonal and perennial allergic rhinitis, allergic conjunctivitis, skin allergies, and urticaria. For instance, in 2025, European Commission, published an article that reported, A recent analysis showing that pollen allergies affect a median of 18.1% of the global population highlights the widespread impact of pollen exposure worldwide. With prevalence ranging from 1% to 63% across countries, this substantial burden is driving growing demand for symptom relief, supporting expansion and increased sales in the global over-the-counter antihistamine market.

Environmental changes such as increasing air pollution, climate change affecting pollen cycles, urbanization, and greater exposure to dust mites, mold, and pet dander have significantly contributed to a growing global allergy burden.

  • Rising Consumer Preference for Self-Medication and Convenient Access

Another key growth driver is the increasing shift toward self-care and self-medication, especially for mild to moderate allergy symptoms that do not require a physician’s consultation. Improved accessibility through retail pharmacy chains, online platforms, direct-to-consumer models, and subscription-based allergy management products has made antihistamines more widely available globally.

As, healthcare systems worldwide continue promoting self-management of non-emergency conditions, demand for convenient OTC antihistamines is expected to accelerate further over the forecast period. For instance, in September 2025, Novartis announced that Rhapsido (remibrutinib) had received U.S. Food and Drug Administration approval as an oral treatment for adults with chronic spontaneous urticaria who remained symptomatic despite H1 antihistamine therapy. Taken twice daily without injections or lab monitoring, Rhapsido became the first FDA-approved Bruton's tyrosine kinase inhibitor for CSU, targeting BTK to inhibit histamine and other proinflammatory mediators.

Market Restraints:

  • Potential Side Effects Associated with Long-Term Use

The primary challenges is the potential side effects associated with long-term use, particularly with first-generation antihistamines, which are known to cause drowsiness, cognitive impairment, and reduced motor performance. These safety concerns have led to regulatory scrutiny and limited usage among certain demographics, including children and the elderly. Additionally, the availability of alternative treatment options such as corticosteroid nasal sprays, immunotherapy, and natural or herbal allergy remedies—creates competitive pressure and may reduce reliance on OTC antihistamines. Regulatory restrictions governing advertising, age-based usage guidelines, and ingredient approvals also slow product innovation and market expansion.

Socio Economic Impact on OTC Antihistamine Market

The Global OTC Antihistamine Market has notable socioeconomic impacts, as these medications provide accessible relief for allergy sufferers without the need for prescriptions. By reducing symptoms such as sneezing, itching, and congestion, antihistamines improve daily productivity, school attendance, and work performance, lowering indirect economic losses. Easy availability also decreases the burden on healthcare facilities and reduces medical costs from frequent doctor visits. The market drives employment across manufacturing, distribution, and retail sectors, while encouraging innovation in new formulations and delivery methods. Overall, widespread use of OTC antihistamines enhances individual well-being and contributes positively to societal health and economic efficiency.

Segmental Analysis:

  • Second-Generation Antihistamines segment is expected to witness highest growth over the forecast period

Second-Generation Antihistamines hold a major share owing to their improved safety profiles, reduced sedation effects, and longer duration of action compared to first-generation products. Medications such as loratadine, cetirizine, and fexofenadine are increasingly preferred by consumers and healthcare providers as they offer effective symptom relief while allowing individuals to maintain daily activities such as work, driving, or school without impaired cognitive function, making them widely used for both seasonal and perennial allergies.

  • Tablets and Capsules segment is expected to witness highest growth over the forecast period

Tablets and Capsules dominate the market due to their convenience, portability, long shelf life, and widespread availability across traditional and digital retail channels. These dosage forms are particularly favored by adult consumers seeking quick, reliable symptom management and are often available in various strengths and extended-release versions to support personalized dosing, which further enhances their adoption.

  • Retail Pharmacies segment is expected to witness highest growth over the forecast period

Retail Pharmacies represent the largest share of the market as they remain the primary access point for OTC medications globally. Consumers rely on retail pharmacy networks due to easy accessibility, pharmacist guidance, and consistent availability of branded and generic antihistamine options. Retail pharmacies also benefit from strong seasonal demand peaks, especially during spring and fall allergy seasons, boosting overall product turnover.

  • North America region is expected to witness highest growth over the forecast period

North America is expected to witness the highest growth over the forecast period, supported by a rising burden of allergic conditions, strong consumer adoption of self-care medication, and widespread availability of OTC antihistamines across retail and digital pharmacy networks.

Increasing environmental triggers such as pollen exposure, pollution, and climate-driven allergen shifts are contributing to higher allergy incidence across the population, while improved healthcare awareness and favorable regulatory frameworks continue to expand market accessibility. For instance, in September 2025, United Allergy Services, reported that the lengthening of the ragweed pollen season in 10 of 11 studied locations across the central U.S. and Canada has significantly increased pollen exposure in North America. Northern cities experienced the largest increases, with Winnipeg extending by 25 days, Fargo by 21 days, and Minneapolis by 18 days. This prolonged exposure is likely to drive higher demand for antihistamines, boosting both North American and global over-the-counter antihistamine markets.

Additionally, the presence of leading pharmaceutical manufacturers, rapid uptake of innovative formulations such as non-drowsy and extended-release antihistamines, and growing online sales channels further strengthen the region’s market outlook, positioning North America as a key growth hub in the global landscape. For instance, in April 2025, PBZ OTC Pyribenzamine Antihistamine Cream launched at Target stores across the U.S. in April as the first new topical antihistamine in decades. Powered by Tripelennamine HCL, it provided fast relief from itching caused by insect bites, poison ivy, and sunburn, and was safe alongside oral allergy medications. Recognized as 2025 Product of the Year, it significantly strengthened North America’s OTC antihistamine market.

OTC Antihistamine Market Competitive Landscape:

The competitive landscape of the global over-the‐counter antihistamine market is broad and features both large global consumer healthcare companies and specialized pharmaceutical firms. These companies compete based on product efficacy, formulation innovation (e.g., non-sedating options, chewables, liquids), distribution breadth (retail, online), brand recognition, regulatory compliance across regions, and marketing strength. Strategic partnerships, line extensions, and generics also play significant roles as companies look to deepen market penetration and cater to different demographic needs.

Key Players:

  • Haleon plc
  • GlaxoSmithKline plc
  • Pfizer Inc.
  • Johnson & Johnson
  • Sanofi S.A.
  • Bayer AG
  • Abbott Laboratories
  • AstraZeneca plc
  • Merck & Co., Inc.
  • Novartis AG
  • Dr. Reddy’s Laboratories Ltd.
  • Sun Pharmaceutical Industries Ltd.
  • Cipla Limited
  • Teva Pharmaceutical Industries Ltd.
  • Mylan N.V. (now part of Viatris)
  • Allergan (now part of AbbVie)
  • UCB S.A.
  • Fresenius Kabi AG
  • Kyowa Kirin Co., Ltd.
  • Alvizia Healthcare Pvt. Ltd.

Recent Development

  • In November 2024, The U.S. Food and Drug Administration announced it had proposed removing oral phenylephrine as an active ingredient in over-the-counter monograph drug products for temporary nasal congestion relief. After reviewing available data, the agency determined oral phenylephrine had not been effective for this use. The proposed order, based on effectiveness rather than safety concerns, allowed companies to continue marketing these products until a final order was issued.


  • In July 2022, Dr. Reddy's Laboratories Ltd. announced it had launched the first-to-market over-the-counter Fexofenadine HCl 180 mg and Pseudoephedrine HCl 240 mg Extended Release Tablets, USP, in the U.S. market. The product, a store-brand equivalent of Allegra-D® 24 HR, had been approved by the U.S. Food and Drug Administration, marking a significant expansion of Dr. Reddy's OTC offerings in the United States.


Frequently Asked Questions (FAQ) :

Q1. What are the main growth-driving factors for this market?

The primary driver was the rising global prevalence of allergic disorders, such as hay fever and allergic rhinitis, exacerbated by increased pollution and climate change. Crucially, the move of many effective antihistamine drugs from prescription-only status to OTC availability increased consumer access and fueled a growing trend toward convenient self-medication for mild symptoms, strongly boosting sales.

Q2. What are the main restraining factors for this market?

The market faced restraints mainly due to patent expirations of key branded drugs, which flooded the market with cheaper generic alternatives and lowered overall profit margins. Additionally, common side effects, especially the drowsiness associated with first-generation antihistamines, discouraged some users. Regulatory challenges for new formulations in different regions also occasionally slowed market entry.

Q3. Which segment is expected to witness high growth?

The Second-Generation Antihistamines segment, which includes newer, non-sedating drugs like loratadine and cetirizine, was expected to see the highest growth. Consumers preferred these drugs because they offered effective allergy relief without causing significant drowsiness, allowing users to maintain daily activities. Within dosage forms, Nasal Sprays were also forecasted for rapid growth due to their fast-acting, localized relief.

Q4. Who are the top major players for this market?

The market was highly competitive and featured major pharmaceutical giants that manufacture both branded and generic OTC products. Top players included Johnson & Johnson, GlaxoSmithKline (GSK), Sanofi, and Bayer AG. These companies focused heavily on marketing, strategic partnerships, and continuous development of new, more convenient dosage forms to maintain their market dominance.

Q5. Which country is the largest player?

North America, dominated by the United States, was the largest regional market for OTC antihistamines. This was attributed to the high incidence of seasonal and perennial allergies in the region, coupled with a robust culture of self-medication and highly developed retail and online pharmacy distribution networks. High awareness and consumer spending power also cemented its leading position.

OTC Antihistamine MARKET STUDY GLOBAL MARKET ANALYSIS, INSIGHTS AND FORECAST, 2022-2029

    1. Introduction

    • 1.1. Research Scope
    • 1.2. Market Segmentation
    • 1.3. Research Methodology
    • 1.4. Definitions and Assumptions

    2. Executive Summary

      3. Market Dynamics

      • 3.1. Market Drivers
      • 3.2. Market Restraints
      • 3.3. Market Opportunities

      4. Key Insights

      • 4.1. Key Emerging Trends – For Major Countries
      • 4.2. Latest Technological Advancement
      • 4.3. Regulatory Landscape
      • 4.4. Industry SWOT Analysis
      • 4.5. Porters Five Forces Analysis

      5. Global OTC Antihistamine Market Analysis (USD Billion), Insights and Forecast, 2018-2029

      • 5.1. Key Findings / Summary
      • 5.2. Market Analysis, Insights and Forecast – By Segment 1
        • 5.2.1. Sub-Segment 1
        • 5.2.2. Sub-Segment 2
      • 5.3. Market Analysis, Insights and Forecast – By Segment 2
        • 5.3.1. Sub-Segment 1
        • 5.3.2. Sub-Segment 2
        • 5.3.3. Sub-Segment 3
        • 5.3.4. Others
      • 5.4. Market Analysis, Insights and Forecast – By Segment 3
        • 5.4.1. Sub-Segment 1
        • 5.4.2. Sub-Segment 2
        • 5.4.3. Sub-Segment 3
        • 5.4.4. Others
      • 5.5. Market Analysis, Insights and Forecast – By Region
        • 5.5.1. North America
        • 5.5.2. Latin America
        • 5.5.3. Europe
        • 5.5.4. Asia Pacific
        • 5.5.5. Middle East and Africa

      6. North America OTC Antihistamine Market Analysis (USD Billion), Insights and Forecast, 2018-2029

      • 6.1. Key Findings / Summary
      • 6.2. Market Analysis, Insights and Forecast – By Segment 1
        • 6.2.1. Sub-Segment 1
        • 6.2.2. Sub-Segment 2
      • 6.3. Market Analysis, Insights and Forecast – By Segment 2
        • 6.3.1. Sub-Segment 1
        • 6.3.2. Sub-Segment 2
        • 6.3.3. Sub-Segment 3
        • 6.3.4. Others
      • 6.4. Market Analysis, Insights and Forecast – By Segment 3
        • 6.4.1. Sub-Segment 1
        • 6.4.2. Sub-Segment 2
        • 6.4.3. Sub-Segment 3
        • 6.4.4. Others
      • 6.5. Market Analysis, Insights and Forecast – By Country
        • 6.5.1. U.S.
        • 6.5.2. Canada

      7. Latin America OTC Antihistamine Market Analysis (USD Billion), Insights and Forecast, 2018-2029

      • 7.1. Key Findings / Summary
      • 7.2. Market Analysis, Insights and Forecast – By Segment 1
        • 7.2.1. Sub-Segment 1
        • 7.2.2. Sub-Segment 2
      • 7.3. Market Analysis, Insights and Forecast – By Segment 2
        • 7.3.1. Sub-Segment 1
        • 7.3.2. Sub-Segment 2
        • 7.3.3. Sub-Segment 3
        • 7.3.4. Others
      • 7.4. Market Analysis, Insights and Forecast – By Segment 3
        • 7.4.1. Sub-Segment 1
        • 7.4.2. Sub-Segment 2
        • 7.4.3. Sub-Segment 3
        • 7.4.4. Others
      • 7.5. Insights and Forecast – By Country
        • 7.5.1. Brazil
        • 7.5.2. Mexico
        • 7.5.3. Rest of Latin America

      8. Europe OTC Antihistamine Market Analysis (USD Billion), Insights and Forecast, 2018-2029

      • 8.1. Key Findings / Summary
      • 8.2. Market Analysis, Insights and Forecast – By Segment 1
        • 8.2.1. Sub-Segment 1
        • 8.2.2. Sub-Segment 2
      • 8.3. Market Analysis, Insights and Forecast – By Segment 2
        • 8.3.1. Sub-Segment 1
        • 8.3.2. Sub-Segment 2
        • 8.3.3. Sub-Segment 3
        • 8.3.4. Others
      • 8.4. Market Analysis, Insights and Forecast – By Segment 3
        • 8.4.1. Sub-Segment 1
        • 8.4.2. Sub-Segment 2
        • 8.4.3. Sub-Segment 3
        • 8.4.4. Others
      • 8.5. Market Analysis, Insights and Forecast – By Country
        • 8.5.1. UK
        • 8.5.2. Germany
        • 8.5.3. France
        • 8.5.4. Italy
        • 8.5.5. Spain
        • 8.5.6. Russia
        • 8.5.7. Rest of Europe

      9. Asia Pacific OTC Antihistamine Market Analysis (USD Billion), Insights and Forecast, 2018-2029

      • 9.1. Key Findings / Summary
      • 9.2. Market Analysis, Insights and Forecast – By Segment 1
        • 9.2.1. Sub-Segment 1
        • 9.2.2. Sub-Segment 2
      • 9.3. Market Analysis, Insights and Forecast – By Segment 2
        • 9.3.1. Sub-Segment 1
        • 9.3.2. Sub-Segment 2
        • 9.3.3. Sub-Segment 3
        • 9.3.4. Others
      • 9.4. Market Analysis, Insights and Forecast – By Segment 3
        • 9.4.1. Sub-Segment 1
        • 9.4.2. Sub-Segment 2
        • 9.4.3. Sub-Segment 3
        • 9.4.4. Others
      • 9.5. Market Analysis, Insights and Forecast – By Country
        • 9.5.1. China
        • 9.5.2. India
        • 9.5.3. Japan
        • 9.5.4. Australia
        • 9.5.5. South East Asia
        • 9.5.6. Rest of Asia Pacific

      10. Middle East & Africa OTC Antihistamine Market Analysis (USD Billion), Insights and Forecast, 2018-2029

      • 10.1. Key Findings / Summary
      • 10.2. Market Analysis, Insights and Forecast – By Segment 1
        • 10.2.1. Sub-Segment 1
        • 10.2.2. Sub-Segment 2
      • 10.3. Market Analysis, Insights and Forecast – By Segment 2
        • 10.3.1. Sub-Segment 1
        • 10.3.2. Sub-Segment 2
        • 10.3.3. Sub-Segment 3
        • 10.3.4. Others
      • 10.4. Market Analysis, Insights and Forecast – By Segment 3
        • 10.4.1. Sub-Segment 1
        • 10.4.2. Sub-Segment 2
        • 10.4.3. Sub-Segment 3
        • 10.4.4. Others
      • 10.5. Market Analysis, Insights and Forecast – By Country
        • 10.5.1. GCC
        • 10.5.2. South Africa
        • 10.5.3. Rest of Middle East & Africa

      11. Competitive Analysis

      • 11.1. Company Market Share Analysis, 2018
      • 11.2. Key Industry Developments
      • 11.3. Company Profile
        • 11.3.1. Company 1
          • 11.3.1.1. Business Overview
          • 11.3.1.2. Segment 1 & Service Offering
          • 11.3.1.3. Overall Revenue
          • 11.3.1.4. Geographic Presence
          • 11.3.1.5. Recent Development
        *Similar details will be provided for the following companies
        • 11.3.2. Company 2
        • 11.3.3. Company 3
        • 11.3.4. Company 4
        • 11.3.5. Company 5
        • 11.3.6. Company 6
        • 11.3.7. Company 7
        • 11.3.8. Company 8
        • 11.3.9. Company 9
        • 11.3.10. Company 10
        • 11.3.11. Company 11
        • 11.3.12. Company 12
      List of Figures

      Figure 1: Global OTC Antihistamine Market Revenue Breakdown (USD Billion, %) by Region, 2022 & 2029
      Figure 2: Global OTC Antihistamine Market Value Share (%), By Segment 1, 2022 & 2029
      Figure 3: Global OTC Antihistamine Market Forecast (USD Billion), by Sub-Segment 1, 2018-2029
      Figure 4: Global OTC Antihistamine Market Forecast (USD Billion), by Sub-Segment 2, 2018-2029
      Figure 5: Global OTC Antihistamine Market Value Share (%), By Segment 2, 2022 & 2029
      Figure 6: Global OTC Antihistamine Market Forecast (USD Billion), by Sub-Segment 1, 2018-2029
      Figure 7: Global OTC Antihistamine Market Forecast (USD Billion), by Sub-Segment 2, 2018-2029
      Figure 8: Global OTC Antihistamine Market Forecast (USD Billion), by Sub-Segment 3, 2018-2029
      Figure 9: Global OTC Antihistamine Market Forecast (USD Billion), by Others, 2018-2029
      Figure 10: Global OTC Antihistamine Market Value Share (%), By Segment 3, 2022 & 2029
      Figure 11: Global OTC Antihistamine Market Forecast (USD Billion), by Sub-Segment 1, 2018-2029
      Figure 12: Global OTC Antihistamine Market Forecast (USD Billion), by Sub-Segment 2, 2018-2029
      Figure 13: Global OTC Antihistamine Market Forecast (USD Billion), by Sub-Segment 3, 2018-2029
      Figure 14: Global OTC Antihistamine Market Forecast (USD Billion), by Others, 2018-2029
      Figure 15: Global OTC Antihistamine Market Value (USD Billion), by Region, 2022 & 2029
      Figure 16: North America OTC Antihistamine Market Value Share (%), By Segment 1, 2022 & 2029
      Figure 17: North America OTC Antihistamine Market Forecast (USD Billion), by Sub-Segment 1, 2018-2029
      Figure 18: North America OTC Antihistamine Market Forecast (USD Billion), by Sub-Segment 2, 2018-2029
      Figure 19: North America OTC Antihistamine Market Value Share (%), By Segment 2, 2022 & 2029
      Figure 20: North America OTC Antihistamine Market Forecast (USD Billion), by Sub-Segment 1, 2018-2029
      Figure 21: North America OTC Antihistamine Market Forecast (USD Billion), by Sub-Segment 2, 2018-2029
      Figure 22: North America OTC Antihistamine Market Forecast (USD Billion), by Sub-Segment 3, 2018-2029
      Figure 23: North America OTC Antihistamine Market Forecast (USD Billion), by Others, 2018-2029
      Figure 24: North America OTC Antihistamine Market Value Share (%), By Segment 3, 2022 & 2029
      Figure 25: North America OTC Antihistamine Market Forecast (USD Billion), by Sub-Segment 1, 2018-2029
      Figure 26: North America OTC Antihistamine Market Forecast (USD Billion), by Sub-Segment 2, 2018-2029
      Figure 27: North America OTC Antihistamine Market Forecast (USD Billion), by Sub-Segment 3, 2018-2029
      Figure 28: North America OTC Antihistamine Market Forecast (USD Billion), by Others, 2018-2029
      Figure 29: North America OTC Antihistamine Market Forecast (USD Billion), by U.S., 2018-2029
      Figure 30: North America OTC Antihistamine Market Forecast (USD Billion), by Canada, 2018-2029
      Figure 31: Latin America OTC Antihistamine Market Value Share (%), By Segment 1, 2022 & 2029
      Figure 32: Latin America OTC Antihistamine Market Forecast (USD Billion), by Sub-Segment 1, 2018-2029
      Figure 33: Latin America OTC Antihistamine Market Forecast (USD Billion), by Sub-Segment 2, 2018-2029
      Figure 34: Latin America OTC Antihistamine Market Value Share (%), By Segment 2, 2022 & 2029
      Figure 35: Latin America OTC Antihistamine Market Forecast (USD Billion), by Sub-Segment 1, 2018-2029
      Figure 36: Latin America OTC Antihistamine Market Forecast (USD Billion), by Sub-Segment 2, 2018-2029
      Figure 37: Latin America OTC Antihistamine Market Forecast (USD Billion), by Sub-Segment 3, 2018-2029
      Figure 38: Latin America OTC Antihistamine Market Forecast (USD Billion), by Others, 2018-2029
      Figure 39: Latin America OTC Antihistamine Market Value Share (%), By Segment 3, 2022 & 2029
      Figure 40: Latin America OTC Antihistamine Market Forecast (USD Billion), by Sub-Segment 1, 2018-2029
      Figure 41: Latin America OTC Antihistamine Market Forecast (USD Billion), by Sub-Segment 2, 2018-2029
      Figure 42: Latin America OTC Antihistamine Market Forecast (USD Billion), by Sub-Segment 3, 2018-2029
      Figure 43: Latin America OTC Antihistamine Market Forecast (USD Billion), by Others, 2018-2029
      Figure 44: Latin America OTC Antihistamine Market Forecast (USD Billion), by Brazil, 2018-2029
      Figure 45: Latin America OTC Antihistamine Market Forecast (USD Billion), by Mexico, 2018-2029
      Figure 46: Latin America OTC Antihistamine Market Forecast (USD Billion), by Rest of Latin America, 2018-2029
      Figure 47: Europe OTC Antihistamine Market Value Share (%), By Segment 1, 2022 & 2029
      Figure 48: Europe OTC Antihistamine Market Forecast (USD Billion), by Sub-Segment 1, 2018-2029
      Figure 49: Europe OTC Antihistamine Market Forecast (USD Billion), by Sub-Segment 2, 2018-2029
      Figure 50: Europe OTC Antihistamine Market Value Share (%), By Segment 2, 2022 & 2029
      Figure 51: Europe OTC Antihistamine Market Forecast (USD Billion), by Sub-Segment 1, 2018-2029
      Figure 52: Europe OTC Antihistamine Market Forecast (USD Billion), by Sub-Segment 2, 2018-2029
      Figure 53: Europe OTC Antihistamine Market Forecast (USD Billion), by Sub-Segment 3, 2018-2029
      Figure 54: Europe OTC Antihistamine Market Forecast (USD Billion), by Others, 2018-2029
      Figure 55: Europe OTC Antihistamine Market Value Share (%), By Segment 3, 2022 & 2029
      Figure 56: Europe OTC Antihistamine Market Forecast (USD Billion), by Sub-Segment 1, 2018-2029
      Figure 57: Europe OTC Antihistamine Market Forecast (USD Billion), by Sub-Segment 2, 2018-2029
      Figure 58: Europe OTC Antihistamine Market Forecast (USD Billion), by Sub-Segment 3, 2018-2029
      Figure 59: Europe OTC Antihistamine Market Forecast (USD Billion), by Others, 2018-2029
      Figure 60: Europe OTC Antihistamine Market Forecast (USD Billion), by U.K., 2018-2029
      Figure 61: Europe OTC Antihistamine Market Forecast (USD Billion), by Germany, 2018-2029
      Figure 62: Europe OTC Antihistamine Market Forecast (USD Billion), by France, 2018-2029
      Figure 63: Europe OTC Antihistamine Market Forecast (USD Billion), by Italy, 2018-2029
      Figure 64: Europe OTC Antihistamine Market Forecast (USD Billion), by Spain, 2018-2029
      Figure 65: Europe OTC Antihistamine Market Forecast (USD Billion), by Russia, 2018-2029
      Figure 66: Europe OTC Antihistamine Market Forecast (USD Billion), by Rest of Europe, 2018-2029
      Figure 67: Asia Pacific OTC Antihistamine Market Value Share (%), By Segment 1, 2022 & 2029
      Figure 68: Asia Pacific OTC Antihistamine Market Forecast (USD Billion), by Sub-Segment 1, 2018-2029
      Figure 69: Asia Pacific OTC Antihistamine Market Forecast (USD Billion), by Sub-Segment 2, 2018-2029
      Figure 70: Asia Pacific OTC Antihistamine Market Value Share (%), By Segment 2, 2022 & 2029
      Figure 71: Asia Pacific OTC Antihistamine Market Forecast (USD Billion), by Sub-Segment 1, 2018-2029
      Figure 72: Asia Pacific OTC Antihistamine Market Forecast (USD Billion), by Sub-Segment 2, 2018-2029
      Figure 73: Asia Pacific OTC Antihistamine Market Forecast (USD Billion), by Sub-Segment 3, 2018-2029
      Figure 74: Asia Pacific OTC Antihistamine Market Forecast (USD Billion), by Others, 2018-2029
      Figure 75: Asia Pacific OTC Antihistamine Market Value Share (%), By Segment 3, 2022 & 2029
      Figure 76: Asia Pacific OTC Antihistamine Market Forecast (USD Billion), by Sub-Segment 1, 2018-2029
      Figure 77: Asia Pacific OTC Antihistamine Market Forecast (USD Billion), by Sub-Segment 2, 2018-2029
      Figure 78: Asia Pacific OTC Antihistamine Market Forecast (USD Billion), by Sub-Segment 3, 2018-2029
      Figure 79: Asia Pacific OTC Antihistamine Market Forecast (USD Billion), by Others, 2018-2029
      Figure 80: Asia Pacific OTC Antihistamine Market Forecast (USD Billion), by China, 2018-2029
      Figure 81: Asia Pacific OTC Antihistamine Market Forecast (USD Billion), by India, 2018-2029
      Figure 82: Asia Pacific OTC Antihistamine Market Forecast (USD Billion), by Japan, 2018-2029
      Figure 83: Asia Pacific OTC Antihistamine Market Forecast (USD Billion), by Australia, 2018-2029
      Figure 84: Asia Pacific OTC Antihistamine Market Forecast (USD Billion), by Southeast Asia, 2018-2029
      Figure 85: Asia Pacific OTC Antihistamine Market Forecast (USD Billion), by Rest of Asia Pacific, 2018-2029
      Figure 86: Middle East & Africa OTC Antihistamine Market Value Share (%), By Segment 1, 2022 & 2029
      Figure 87: Middle East & Africa OTC Antihistamine Market Forecast (USD Billion), by Sub-Segment 1, 2018-2029
      Figure 88: Middle East & Africa OTC Antihistamine Market Forecast (USD Billion), by Sub-Segment 2, 2018-2029
      Figure 89: Middle East & Africa OTC Antihistamine Market Value Share (%), By Segment 2, 2022 & 2029
      Figure 90: Middle East & Africa OTC Antihistamine Market Forecast (USD Billion), by Sub-Segment 1, 2018-2029
      Figure 91: Middle East & Africa OTC Antihistamine Market Forecast (USD Billion), by Sub-Segment 2, 2018-2029
      Figure 92: Middle East & Africa OTC Antihistamine Market Forecast (USD Billion), by Sub-Segment 3, 2018-2029
      Figure 93: Middle East & Africa OTC Antihistamine Market Forecast (USD Billion), by Others, 2018-2029
      Figure 94: Middle East & Africa OTC Antihistamine Market Value Share (%), By Segment 3, 2022 & 2029
      Figure 95: Middle East & Africa OTC Antihistamine Market Forecast (USD Billion), by Sub-Segment 1, 2018-2029
      Figure 96: Middle East & Africa OTC Antihistamine Market Forecast (USD Billion), by Sub-Segment 2, 2018-2029
      Figure 97: Middle East & Africa OTC Antihistamine Market Forecast (USD Billion), by Sub-Segment 3, 2018-2029
      Figure 98: Middle East & Africa OTC Antihistamine Market Forecast (USD Billion), by Others, 2018-2029
      Figure 99: Middle East & Africa OTC Antihistamine Market Forecast (USD Billion), by GCC, 2018-2029
      Figure 100: Middle East & Africa OTC Antihistamine Market Forecast (USD Billion), by South Africa, 2018-2029
      Figure 101: Middle East & Africa OTC Antihistamine Market Forecast (USD Billion), by Rest of Middle East & Africa, 2018-2029 
      List of Tables
      Table 1: Global OTC Antihistamine Market Revenue (USD Billion) Forecast, by Segment 1, 2018-2029
      Table 2: Global OTC Antihistamine Market Revenue (USD Billion) Forecast, by Segment 2, 2018-2029
      Table 3: Global OTC Antihistamine Market Revenue (USD Billion) Forecast, by Segment 3, 2018-2029
      Table 4: Global OTC Antihistamine Market Revenue (USD Billion) Forecast, by Region, 2018-2029
      Table 5: North America OTC Antihistamine Market Revenue (USD Billion) Forecast, by Segment 1, 2018-2029
      Table 6: North America OTC Antihistamine Market Revenue (USD Billion) Forecast, by Segment 2, 2018-2029
      Table 7: North America OTC Antihistamine Market Revenue (USD Billion) Forecast, by Segment 3, 2018-2029
      Table 8: North America OTC Antihistamine Market Revenue (USD Billion) Forecast, by Country, 2018-2029
      Table 9: Europe OTC Antihistamine Market Revenue (USD Billion) Forecast, by Segment 1, 2018-2029
      Table 10: Europe OTC Antihistamine Market Revenue (USD Billion) Forecast, by Segment 2, 2018-2029
      Table 11: Europe OTC Antihistamine Market Revenue (USD Billion) Forecast, by Segment 3, 2018-2029
      Table 12: Europe OTC Antihistamine Market Revenue (USD Billion) Forecast, by Country, 2018-2029
      Table 13: Latin America OTC Antihistamine Market Revenue (USD Billion) Forecast, by Segment 1, 2018-2029
      Table 14: Latin America OTC Antihistamine Market Revenue (USD Billion) Forecast, by Segment 2, 2018-2029
      Table 15: Latin America OTC Antihistamine Market Revenue (USD Billion) Forecast, by Segment 3, 2018-2029
      Table 16: Latin America OTC Antihistamine Market Revenue (USD Billion) Forecast, by Country, 2018-2029
      Table 17: Asia Pacific OTC Antihistamine Market Revenue (USD Billion) Forecast, by Segment 1, 2018-2029
      Table 18: Asia Pacific OTC Antihistamine Market Revenue (USD Billion) Forecast, by Segment 2, 2018-2029
      Table 19: Asia Pacific OTC Antihistamine Market Revenue (USD Billion) Forecast, by Segment 3, 2018-2029
      Table 20: Asia Pacific OTC Antihistamine Market Revenue (USD Billion) Forecast, by Country, 2018-2029
      Table 21: Middle East & Africa OTC Antihistamine Market Revenue (USD Billion) Forecast, by Segment 1, 2018-2029
      Table 22: Middle East & Africa OTC Antihistamine Market Revenue (USD Billion) Forecast, by Segment 2, 2018-2029
      Table 23: Middle East & Africa OTC Antihistamine Market Revenue (USD Billion) Forecast, by Segment 3, 2018-2029
      Table 24: Middle East & Africa OTC Antihistamine Market Revenue (USD Billion) Forecast, by Country, 2018-2029
      Research Process

      Data Library Research are conducted by industry experts who offer insight on industry structure, market segmentations technology assessment and competitive landscape (CL), and penetration, as well as on emerging trends. Their analysis is based on primary interviews (~ 80%) and secondary research (~ 20%) as well as years of professional expertise in their respective industries. Adding to this, by analysing historical trends and current market positions, our analysts predict where the market will be headed for the next five years. Furthermore, the varying trends of segment & categories geographically presented are also studied and the estimated based on the primary & secondary research.

      In this particular report from the supply side Data Library Research has conducted primary surveys (interviews) with the key level executives (VP, CEO’s, Marketing Director, Business Development Manager and SOFT) of the companies that active & prominent as well as the midsized organization

      FIGURE 1: DLR RESEARH PROCESS

      research-methodology1

      Primary Research

      Extensive primary research was conducted to gain a deeper insight of the market and industry performance. The analysis is based on both primary and secondary research as well as years of professional expertise in the respective industries.

      In addition to analysing current and historical trends, our analysts predict where the market is headed over the next five years.

      It varies by segment for these categories geographically presented in the list of market tables. Speaking about this particular report we have conducted primary surveys (interviews) with the key level executives (VP, CEO’s, Marketing Director, Business Development Manager and many more) of the major players active in the market.

      Secondary Research

      Secondary research was mainly used to collect and identify information useful for the extensive, technical, market-oriented, and Friend’s study of the Global Extra Neutral Alcohol. It was also used to obtain key information about major players, market classification and segmentation according to the industry trends, geographical markets, and developments related to the market and technology perspectives. For this study, analysts have gathered information from various credible sources, such as annual reports, sec filings, journals, white papers, SOFT presentations, and company web sites.

      Market Size Estimation

      Both, top-down and bottom-up approaches were used to estimate and validate the size of the Global market and to estimate the size of various other dependent submarkets in the overall Extra Neutral Alcohol. The key players in the market were identified through secondary research and their market contributions in the respective geographies were determined through primary and secondary research.

      Forecast Model

      research-methodology2