Global Phycoerythrin Industry Market Opportunities and Forecast 2023-2030

  •   DLR83
  •   April, 2022
  •   Pages: 120
  •  Global
Phycoerythrin Market Overview

Phycoerythrin is a type of phycobiliprotein derived from algal sources, mostly red algae such as Palmaria palmate and Gracilaria longa. Phycobiliprotein or phycoerythrin is mostly used as a colorant in food, cosmetic, bakery, and dairy products, as well as in chewing gums and jellies. In the cosmetic industry, phycoerythrin finds application in several products, such as lipsticks and eyeliners for their bright red color. Highly influenced by its fluorescence property, phycoerythrin is also used in cake decoration, lollipops, soft drinks, and alcoholic drinks. In the global market, phycoerythrin is available in both dry and liquid forms. The global Phycoerythrin market is projected to grow at a considerable rate in the coming years.
 
The growing trend of veganism, as well as the desire for natural food colours and flavours, will continue to drive the phycoerythrin market forward. Phycoerythrin is extracted from marine, natural sources of red algae through a cell wall hydrolysis method. Natural, premium, organic, and plant-based goods are becoming more popular, which is influencing the phycoerythrin Market. Veganism's expanding popularity, as well as consumer demand for natural food colours and flavours, will propel the phycoerythrin market ahead. A cell wall hydrolysis process is used to extract phycoerythrin from marine, natural sources of red algae. The phycoerythrin market is being influenced by the growing popularity of natural, premium, organic, and plant-based items.

Report Metric Details
Market size available for years 2023–2030
Base year considered 2023
Forecast period 2024–2030
Forecast unit Value (USD Million)
Segments covered Process of Extraction, Sources, Form, End Use, Distribution Channel, and Region.
Regions covered North America (the U.S. and Canada), Europe (UK, Germany, France, Italy, Spain, Russia, Rest of Europe), Asia-Pacific (China, India, Japan, Australia, South East Asia, Rest of Asia Pacific), Latin America and the Middle East and Africa (Brazil, Saudi Arabia, UAE, Rest of LAMEA)
Companies covered Scientific Inc., Binmei Biotechnology, Phyco-Biotech, Norland Biotech, Europa Biotechnology, Sigma-Aldrich, Jackson Immuno Research, SETA BioMedicals, Columbia Bioscience, Dainippon Ink and Chemicals, Assay Biotech Company, Inc., R&D Systems, Inc., Vector Laboratories.


Covid-19 Impact on Phycoerythrin Market
 
In addition, the current Phycoerythrin Market study offers a detailed analysis of the current COVID-19 pandemic impact on the market growth and its influence on the future growth of the Phycoerythrin Market. The recently published report demonstrates the elevation in the demand for the healthcare sector. The healthcare manufacturers have experienced long-term as well as short-term effect which includes supply shortages, panic buying, and stocking, regulation changes as short-term whereas approval delays and possible trend variations in consumption could be perceived as long-term impacts of COVID-19 on the health and pharmaceutical market.

The increasing need for a cure has pushed vaccine research and manufacturers to the limit. In addition to this, panic conditions have already spurred the demand for many healthcare products and services which are discussed in detail in this report. Moreover, the impact of COVID-19 on overall market revenue for the base year 2020 and its projection up to 2027 is provided in detail in this report.
 
Phycoerythrin Market Segment Overview


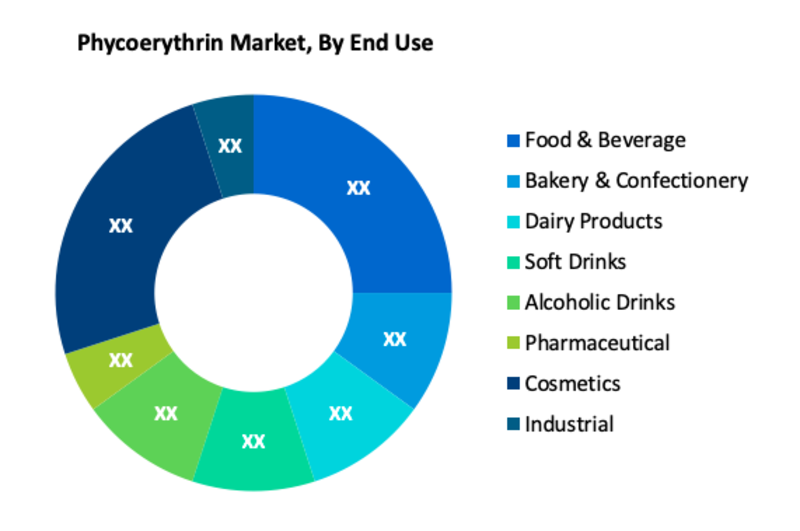
According to End-Use, Food & Beverage and Cosmetics are the most prominent segments in the global Phycoerythrin Market. Many industry sectors, such as food and beverage and cosmetics, are thriving in developing countries due to stable economic circumstances and rising urbanization rates. Premium product demand is quickly rising in these countries, propelled by increased disposable income and customers prepared to pay a higher price for high-quality goods. As a result, demand for phycoerythrin for use in high-end food, beverage, and cosmetics products is increasing.
 
Phycoerythrin Market, By Process of Extraction
·       Buffer Extraction
·       Cell Wall Hydrolysis
 
Phycoerythrin Market, By Sources
·       Corallina officinalis
·       Porphyra tenera
·       Palmaria palmate
·       Others
 
Phycoerythrin Market, By Form
·       Dry
·       Liquid
 
Phycoerythrin Market, By End Use
·       Food & Beverage
·       Bakery & Confectionery
·       Dairy Products
·       Soft Drinks
·       Alcoholic Drinks
·       Pharmaceutical
·       Cosmetics
·       Industrial

Phycoerythrin Market, By Distribution Channel
·       Direct Sales
·       Indirect Sale
·       Online Retail
·       Specialty Stores
·       Other Retail Format
 
Phycoerythrin Market Regional Overview

Geographically, North America and Europe are major regions for the global Phycoerythrin Market.  Furthermore, the market in the Asia Pacific is expected to enlarge at a higher rate in the coming years. In developing economies, significant prospects are envisaged. Over the next decade, countries such as Thailand, Japan, China, India, and others are expected to see an increase in cosmetic product sales. The global phycoerythrin market is expected to develop as demand for premium products rises in tandem with consumer spending power.
 
Phycoerythrin Market, By Geography
 
·       North America (US & Canada)
·       Europe (UK, Germany, France, Italy, Spain, Russia & Rest of Europe)
·       Asia-Pacific (Japan, China, India, Australia, & South Korea, & Rest of Asia-Pacific)
·       LAMEA (Brazil, Saudi Arabia, UAE & Rest of LAMEA)
 
Phycoerythrin Market, Key Players

·       Thermo Fischer Scientific Inc.
·       Binmei Biotechnology
·       Phyco-Biotech
·       Norland Biotech
·       Europa Biotechnology
·       Sigma-Aldrich
·       Jackson Immuno Research
·       SETA BioMedicals
·       Columbia Bioscience
·       Dainippon Ink and Chemicals
·       Assay Biotech Company, Inc.
·       R&D Systems, Inc.
·       Vector Laboratories

Frequently Asked Questions (FAQ) :

Q1. What are the driving factors for the Phycoerythrin market?

The growing trend of veganism, as well as the desire for natural food colours and flavours, will continue to drive the phycoerythrin market forward.

Q2. Which Segments are covered in the Phycoerythrin Market report?

Process of Extraction, Sources, Form, End-Use, Distribution Channel, and Region. these segments are covered in the Phycoerythrin market report

Q3. Which segment is projected to hold the largest share in the Phycoerythrin Market?

Food & Beverage and Cosmetics segments are projected to hold the largest share in the Phycoerythrin Market.

Q4. Which region holds the largest share in the Phycoerythrin market?

North America and Europe held the largest share in the global Phycoerythrin market

Q5. Which are the prominent players in the Phycoerythrin Market?

Scientific Inc., Binmei Biotechnology, Phyco-Biotech, Norland Biotech, Europa Biotechnology, Sigma-Aldrich, Jackson Immuno Research, SETA BioMedicals, Columbia Bioscience, Dainippon Ink and Chemicals, Assay Biotech Company, Inc., R&D Systems, Inc., Vector Laboratories. are some key players in the Phycoerythrin Market.
Phycoerythrin Market Study Global Market Analysis, Insights and Forecast, 2020-2027

    1. Introduction

    • 1.1. Research Scope
    • 1.2. Market Segmentation
    • 1.3. Research Methodology
    • 1.4. Definitions and Assumptions

    2. Executive Summary

      3. Market Dynamics

      • 3.1. Market Drivers
      • 3.2. Market Restraints
      • 3.3. Market Opportunities

      4. Key Insights

      • 4.1. Key Emerging Trends – For Major Countries
      • 4.2. Latest Technological Advancement
      • 4.3. Regulatory Landscape
      • 4.4. Industry SWOT Analysis
      • 4.5. Porters Five Forces Analysis

      5. Global Phycoerythrin Market Analysis (USD Billion), Insights and Forecast, 2020-2027

      • 5.1. Key Findings / Summary
      • 5.2. Market Analysis, Insights and Forecast – By Process of Extraction
        • 5.2.1. Buffer Extraction
        • 5.2.2. Cell Wall Hydrolysis
      • 5.3. Market Analysis, Insights and Forecast – By Sources
        • 5.3.1. Corallina officinalis
        • 5.3.2. Porphyra tenera
        • 5.3.3. Palmaria palmate
        • 5.3.4. Others
      • 5.4. Market Analysis, Insights and Forecast – By Form
        • 5.4.1. Dry
        • 5.4.2. Liquid
      • 5.5. Market Analysis, Insights and Forecast – By End Use
        • 5.5.1. Food & Beverage
        • 5.5.2. Bakery & Confectionery
        • 5.5.3. Dairy Products
        • 5.5.4. Soft Drinks
        • 5.5.5. Alcoholic Drinks
        • 5.5.6. Others
        • 5.5.7. Pharmaceutical
        • 5.5.8. Cosmetics
        • 5.5.9. Industrial
      • 5.6. Market Analysis, Insights and Forecast – By Distribution Channel
        • 5.6.1. Direct Sales
        • 5.6.2. Indirect Sale
        • 5.6.3. Online Retail
        • 5.6.4. Specialty Stores
        • 5.6.5. Other Retail Format
      • 5.7. Market Analysis, Insights and Forecast – By Region
        • 5.7.1. North America
        • 5.7.2. Europe
        • 5.7.3. Asia Pacific
        • 5.7.4. Latin America, Middle East and Africa

      6. North America Phycoerythrin Market Analysis (USD Billion), Insights and Forecast, 2020-2027

      • 6.1. Key Findings / Summary
      • 6.2. Market Analysis, Insights and Forecast – By Process of Extraction
        • 6.2.1. Buffer Extraction
        • 6.2.2. Cell Wall Hydrolysis
      • 6.3. Market Analysis, Insights and Forecast – By Sources
        • 6.3.1. Corallina officinalis
        • 6.3.2. Porphyra tenera
        • 6.3.3. Palmaria palmate
        • 6.3.4. Others
      • 6.4. Market Analysis, Insights and Forecast – By Form
        • 6.4.1. Dry
        • 6.4.2. Liquid
      • 6.5. Market Analysis, Insights and Forecast – By End Use
        • 6.5.1. Food & Beverage
        • 6.5.2. Bakery & Confectionery
        • 6.5.3. Dairy Products
        • 6.5.4. Soft Drinks
        • 6.5.5. Alcoholic Drinks
        • 6.5.6. Others
        • 6.5.7. Pharmaceutical
        • 6.5.8. Cosmetics
        • 6.5.9. Industrial
      • 6.6. Market Analysis, Insights and Forecast – By Distribution Channel
        • 6.6.1. Direct Sales
        • 6.6.2. Indirect Sale
        • 6.6.3. Online Retail
        • 6.6.4. Specialty Stores
        • 6.6.5. Other Retail Format
      • 6.7. Market Analysis, Insights and Forecast – By Country
        • 6.7.1. U.S.
        • 6.7.2. Canada

      7. Europe Phycoerythrin Market Analysis (USD Billion), Insights and Forecast, 2020-2027

      • 7.1. Key Findings / Summary
      • 7.2. Market Analysis, Insights and Forecast – By Process of Extraction
        • 7.2.1. Buffer Extraction
        • 7.2.2. Cell Wall Hydrolysis
      • 7.3. Market Analysis, Insights and Forecast – By Sources
        • 7.3.1. Corallina officinalis
        • 7.3.2. Porphyra tenera
        • 7.3.3. Palmaria palmate
        • 7.3.4. Others
      • 7.4. Market Analysis, Insights and Forecast – By Form
        • 7.4.1. Dry
        • 7.4.2. Liquid
      • 7.5. Market Analysis, Insights and Forecast – By End Use
        • 7.5.1. Food & Beverage
        • 7.5.2. Bakery & Confectionery
        • 7.5.3. Dairy Products
        • 7.5.4. Soft Drinks
        • 7.5.5. Alcoholic Drinks
        • 7.5.6. Others
        • 7.5.7. Pharmaceutical
        • 7.5.8. Cosmetics
        • 7.5.9. Industrial
      • 7.6. Market Analysis, Insights and Forecast – By Distribution Channel
        • 7.6.1. Direct Sales
        • 7.6.2. Indirect Sale
        • 7.6.3. Online Retail
        • 7.6.4. Specialty Stores
        • 7.6.5. Other Retail Format
      • 7.7. Market Analysis, Insights and Forecast – By Country
        • 7.7.1. UK
        • 7.7.2. Germany
        • 7.7.3. France
        • 7.7.4. Italy
        • 7.7.5. Spain
        • 7.7.6. Russia
        • 7.7.7. Rest of Europe

      8. Asia Pacific Phycoerythrin Market Analysis (USD Billion), Insights and Forecast, 2020-2027

      • 8.1. Key Findings / Summary
      • 8.2. Market Analysis, Insights and Forecast – By Process of Extraction
        • 8.2.1. Buffer Extraction
        • 8.2.2. Cell Wall Hydrolysis
      • 8.3. Market Analysis, Insights and Forecast – By Sources
        • 8.3.1. Corallina officinalis
        • 8.3.2. Porphyra tenera
        • 8.3.3. Palmaria palmate
        • 8.3.4. Others
      • 8.4. Market Analysis, Insights and Forecast – By Form
        • 8.4.1. Dry
        • 8.4.2. Liquid
      • 8.5. Market Analysis, Insights and Forecast – By End Use
        • 8.5.1. Food & Beverage
        • 8.5.2. Bakery & Confectionery
        • 8.5.3. Dairy Products
        • 8.5.4. Soft Drinks
        • 8.5.5. Alcoholic Drinks
        • 8.5.6. Others
        • 8.5.7. Pharmaceutical
        • 8.5.8. Cosmetics
        • 8.5.9. Industrial
      • 8.6. Market Analysis, Insights and Forecast – By Distribution Channel
        • 8.6.1. Direct Sales
        • 8.6.2. Indirect Sale
        • 8.6.3. Online Retail
        • 8.6.4. Specialty Stores
        • 8.6.5. Other Retail Format
      • 8.7. Market Analysis, Insights and Forecast – By Country
        • 8.7.1. China
        • 8.7.2. India
        • 8.7.3. Japan
        • 8.7.4. Australia
        • 8.7.5. South East Asia
        • 8.7.6. Rest of Asia Pacific

      9. Latin America, Middle East and Africa Phycoerythrin Market Analysis (USD Billion), Insights and Forecast, 2020-2027

      • 9.1. Key Findings / Summary
      • 9.2. Market Analysis, Insights and Forecast – By Process of Extraction
        • 9.2.1. Buffer Extraction
        • 9.2.2. Cell Wall Hydrolysis
      • 9.3. Market Analysis, Insights and Forecast – By Sources
        • 9.3.1. Corallina officinalis
        • 9.3.2. Porphyra tenera
        • 9.3.3. Palmaria palmate
        • 9.3.4. Others
      • 9.4. Market Analysis, Insights and Forecast – By Form
        • 9.4.1. Dry
        • 9.4.2. Liquid
      • 9.5. Market Analysis, Insights and Forecast – By End Use
        • 9.5.1. Food & Beverage
        • 9.5.2. Bakery & Confectionery
        • 9.5.3. Dairy Products
        • 9.5.4. Soft Drinks
        • 9.5.5. Alcoholic Drinks
        • 9.5.6. Others
        • 9.5.7. Pharmaceutical
        • 9.5.8. Cosmetics
        • 9.5.9. Industrial
      • 9.6. Market Analysis, Insights and Forecast – By Distribution Channel
        • 9.6.1. Direct Sales
        • 9.6.2. Indirect Sale
        • 9.6.3. Online Retail
        • 9.6.4. Specialty Stores
        • 9.6.5. Other Retail Format
      • 9.7. Market Analysis, Insights and Forecast – By Country
        • 9.7.1. Brazil
        • 9.7.2. Saudi Arabia
        • 9.7.3. UAE
        • 9.7.4. Rest of LAMEA

      10. Competitive Analysis

      • 10.1. Company Market Share Analysis, 2018
      • 10.2. Key Industry Developments
      • 10.3. Company Profile
      • 10.4. Thermo Fischer Scientific Inc.
        • 10.4.1. Business Overview
        • 10.4.2. Segment 1 & Service Offering
        • 10.4.3. Overall Revenue
        • 10.4.4. Geographic Presence
        • 10.4.5. Recent Development
      *Similar details will be provided for the following companies
      • 10.5. Binmei Biotechnology
      • 10.6. Phyco-Biotech
      • 10.7. Norland Biotech
      • 10.8. Europa Biotechnology
      • 10.9. Sigma-Aldrich
      • 10.10. Jackson Immuno Research
      • 10.11. SETA BioMedicals
      • 10.12. Columbia Bioscience
      • 10.13. Dainippon Ink and Chemicals
      • 10.14. Assay Biotech Company, Inc.
      • 10.15. R&D Systems, Inc.
      • 10.16. Vector Laboratories
      List of Figures

      Figure 1: Global Phycoerythrin Industry Market Revenue Breakdown (USD Billion, %) by Region, 2019 & 2027
      Figure 2: Global Market Value Share (%), By Segment 1, 2019 & 2027
      Figure 3: Global Market Forecast (USD Billion), by Sub-Segment 1, 2016-2027
      Figure 4: Global Market Forecast (USD Billion), by Sub-Segment 2, 2016-2027
      Figure 5: Global Market Value Share (%), By Segment 2, 2019 & 2027
      Figure 6: Global Market Forecast (USD Billion), by Sub-Segment 1, 2016-2027
      Figure 7: Global Market Forecast (USD Billion), by Sub-Segment 2, 2016-2027
      Figure 8: Global Market Forecast (USD Billion), by Sub-Segment 3, 2016-2027
      Figure 9: Global Phycoerythrin Industry Market Forecast (USD Billion), by Others, 2016-2027
      Figure 10: Global Market Value Share (%), By Segment 3, 2019 & 2027
      Figure 11: Global Market Forecast (USD Billion), by Sub-Segment 1, 2016-2027
      Figure 12: Global Market Forecast (USD Billion), by Sub-Segment 2, 2016-2027
      Figure 13: Global Market Forecast (USD Billion), by Sub-Segment 3, 2016-2027
      Figure 14: Global Market Forecast (USD Billion), by Others, 2016-2027
      Figure 15: Global Market Value (USD Billion), by Region, 2019 & 2027
      Figure 16: North America Phycoerythrin Industry Market Value Share (%), By Segment 1, 2019 & 2027
      Figure 17: North America Market Forecast (USD Billion), by Sub-Segment 1, 2016-2027
      Figure 18: North America Market Forecast (USD Billion), by Sub-Segment 2, 2016-2027
      Figure 19: North America Market Value Share (%), By Segment 2, 2019 & 2027
      Figure 20: North America Market Forecast (USD Billion), by Sub-Segment 1, 2016-2027
      Figure 21: North America Market Forecast (USD Billion), by Sub-Segment 2, 2016-2027
      Figure 22: North America Market Forecast (USD Billion), by Sub-Segment 3, 2016-2027
      Figure 23: North America Market Forecast (USD Billion), by Others, 2016-2027
      Figure 24: North America Market Value Share (%), By Segment 3, 2019 & 2027
      Figure 25: North America Market Forecast (USD Billion), by Sub-Segment 1, 2016-2027
      Figure 26: North America Market Forecast (USD Billion), by Sub-Segment 2, 2016-2027
      Figure 27: North America Market Forecast (USD Billion), by Sub-Segment 3, 2016-2027
      Figure 28: North America Market Forecast (USD Billion), by Others, 2016-2027
      Figure 29: North America Market Forecast (USD Billion), by U.S., 2016-2027
      Figure 30: North America Market Forecast (USD Billion), by Canada, 2016-2027
      Figure 31: Latin America Phycoerythrin Industry Market Value Share (%), By Segment 1, 2019 & 2027
      Figure 32: Latin America Market Forecast (USD Billion), by Sub-Segment 1, 2016-2027
      Figure 33: Latin America Market Forecast (USD Billion), by Sub-Segment 2, 2016-2027
      Figure 34: Latin America Market Value Share (%), By Segment 2, 2019 & 2027
      Figure 35: Latin America Market Forecast (USD Billion), by Sub-Segment 1, 2016-2027
      Figure 36: Latin America Market Forecast (USD Billion), by Sub-Segment 2, 2016-2027
      Figure 37: Latin America Market Forecast (USD Billion), by Sub-Segment 3, 2016-2027
      Figure 38: Latin America Market Forecast (USD Billion), by Others, 2016-2027
      Figure 39: Latin America Market Value Share (%), By Segment 3, 2019 & 2027
      Figure 40: Latin America Market Forecast (USD Billion), by Sub-Segment 1, 2016-2027
      Figure 41: Latin America Market Forecast (USD Billion), by Sub-Segment 2, 2016-2027
      Figure 42: Latin America Market Forecast (USD Billion), by Sub-Segment 3, 2016-2027
      Figure 43: Latin America Market Forecast (USD Billion), by Others, 2016-2027
      Figure 44: Latin America Market Forecast (USD Billion), by Brazil, 2016-2027
      Figure 45: Latin America Market Forecast (USD Billion), by Mexico, 2016-2027
      Figure 46: Latin America Market Forecast (USD Billion), by Rest of Latin America, 2016-2027
      Figure 47: Europe Phycoerythrin Industry Market Value Share (%), By Segment 1, 2019 & 2027
      Figure 48: Europe Market Forecast (USD Billion), by Sub-Segment 1, 2016-2027
      Figure 49: Europe Market Forecast (USD Billion), by Sub-Segment 2, 2016-2027
      Figure 50: Europe Market Value Share (%), By Segment 2, 2019 & 2027
      Figure 51: Europe Market Forecast (USD Billion), by Sub-Segment 1, 2016-2027
      Figure 52: Europe Market Forecast (USD Billion), by Sub-Segment 2, 2016-2027
      Figure 53: Europe Market Forecast (USD Billion), by Sub-Segment 3, 2016-2027
      Figure 54: Europe Market Forecast (USD Billion), by Others, 2016-2027
      Figure 55: Europe Market Value Share (%), By Segment 3, 2019 & 2027
      Figure 56: Europe Market Forecast (USD Billion), by Sub-Segment 1, 2016-2027
      Figure 57: Europe Market Forecast (USD Billion), by Sub-Segment 2, 2016-2027
      Figure 58: Europe Market Forecast (USD Billion), by Sub-Segment 3, 2016-2027
      Figure 59: Europe Market Forecast (USD Billion), by Others, 2016-2027
      Figure 60: Europe Market Forecast (USD Billion), by U.K., 2016-2027
      Figure 61: Europe Market Forecast (USD Billion), by Germany, 2016-2027
      Figure 62: Europe Market Forecast (USD Billion), by France, 2016-2027
      Figure 63: Europe Market Forecast (USD Billion), by Italy, 2016-2027
      Figure 64: Europe Market Forecast (USD Billion), by Spain, 2016-2027
      Figure 65: Europe Market Forecast (USD Billion), by Russia, 2016-2027
      Figure 66: Europe Market Forecast (USD Billion), by Rest of Europe, 2016-2027
      Figure 67: Asia Pacific Phycoerythrin Industry Market Value Share (%), By Segment 1, 2019 & 2027
      Figure 68: Asia Pacific Market Forecast (USD Billion), by Sub-Segment 1, 2016-2027
      Figure 69: Asia Pacific Market Forecast (USD Billion), by Sub-Segment 2, 2016-2027
      Figure 70: Asia Pacific Market Value Share (%), By Segment 2, 2019 & 2027
      Figure 71: Asia Pacific Market Forecast (USD Billion), by Sub-Segment 1, 2016-2027
      Figure 72: Asia Pacific Market Forecast (USD Billion), by Sub-Segment 2, 2016-2027
      Figure 73: Asia Pacific Market Forecast (USD Billion), by Sub-Segment 3, 2016-2027
      Figure 74: Asia Pacific Market Forecast (USD Billion), by Others, 2016-2027
      Figure 75: Asia Pacific Market Value Share (%), By Segment 3, 2019 & 2027
      Figure 76: Asia Pacific Market Forecast (USD Billion), by Sub-Segment 1, 2016-2027
      Figure 77: Asia Pacific Market Forecast (USD Billion), by Sub-Segment 2, 2016-2027
      Figure 78: Asia Pacific Market Forecast (USD Billion), by Sub-Segment 3, 2016-2027
      Figure 79: Asia Pacific Market Forecast (USD Billion), by Others, 2016-2027
      Figure 80: Asia Pacific Market Forecast (USD Billion), by China, 2016-2027
      Figure 81: Asia Pacific Market Forecast (USD Billion), by India, 2016-2027
      Figure 82: Asia Pacific Market Forecast (USD Billion), by Japan, 2016-2027
      Figure 83: Asia Pacific Market Forecast (USD Billion), by Australia, 2016-2027
      Figure 84: Asia Pacific Market Forecast (USD Billion), by Southeast Asia, 2016-2027
      Figure 85: Asia Pacific Market Forecast (USD Billion), by Rest of Asia Pacific, 2016-2027
      Figure 86: Middle East & Africa Phycoerythrin Industry Market Value Share (%), By Segment 1, 2019 & 2027
      Figure 87: Middle East & Africa Market Forecast (USD Billion), by Sub-Segment 1, 2016-2027
      Figure 88: Middle East & Africa Market Forecast (USD Billion), by Sub-Segment 2, 2016-2027
      Figure 89: Middle East & Africa Market Value Share (%), By Segment 2, 2019 & 2027
      Figure 90: Middle East & Africa Market Forecast (USD Billion), by Sub-Segment 1, 2016-2027
      Figure 91: Middle East & Africa Market Forecast (USD Billion), by Sub-Segment 2, 2016-2027
      Figure 92: Middle East & Africa Market Forecast (USD Billion), by Sub-Segment 3, 2016-2027
      Figure 93: Middle East & Africa Market Forecast (USD Billion), by Others, 2016-2027
      Figure 94: Middle East & Africa Market Value Share (%), By Segment 3, 2019 & 2027
      Figure 95: Middle East & Africa Market Forecast (USD Billion), by Sub-Segment 1, 2016-2027
      Figure 96: Middle East & Africa Market Forecast (USD Billion), by Sub-Segment 2, 2016-2027
      Figure 97: Middle East & Africa Market Forecast (USD Billion), by Sub-Segment 3, 2016-2027
      Figure 98: Middle East & Africa Market Forecast (USD Billion), by Others, 2016-2027
      Figure 99: Middle East & Africa Market Forecast (USD Billion), by GCC, 2016-2027
      Figure 100: Middle East & Africa Market Forecast (USD Billion), by South Africa, 2016-2027
      Figure 101: Middle East & Africa Market Forecast (USD Billion), by Rest of Middle East & Africa, 2016-2027 
      List of Tables
      Table 1: Global Phycoerythrin Industry Market Revenue (USD Billion) Forecast, by Segment 1, 2016-2027
      Table 2: Global Market Revenue (USD Billion) Forecast, by Segment 2, 2016-2027
      Table 3: Global Market Revenue (USD Billion) Forecast, by Segment 3, 2016-2027
      Table 4: Global Market Revenue (USD Billion) Forecast, by Region, 2016-2027
      Table 5: North America Phycoerythrin Industry Market Revenue (USD Billion) Forecast, by Segment 1, 2016-2027
      Table 6: North America Market Revenue (USD Billion) Forecast, by Segment 2, 2016-2027
      Table 7: North America Market Revenue (USD Billion) Forecast, by Segment 3, 2016-2027
      Table 8: North America Market Revenue (USD Billion) Forecast, by Country, 2016-2027
      Table 9: Europe Phycoerythrin Industry Market Revenue (USD Billion) Forecast, by Segment 1, 2016-2027
      Table 10: Europe Market Revenue (USD Billion) Forecast, by Segment 2, 2016-2027
      Table 11: Europe Market Revenue (USD Billion) Forecast, by Segment 3, 2016-2027
      Table 12: Europe Market Revenue (USD Billion) Forecast, by Country, 2016-2027
      Table 13: Latin America Phycoerythrin Industry Market Revenue (USD Billion) Forecast, by Segment 1, 2016-2027
      Table 14: Latin America Market Revenue (USD Billion) Forecast, by Segment 2, 2016-2027
      Table 15: Latin America Market Revenue (USD Billion) Forecast, by Segment 3, 2016-2027
      Table 16: Latin America Market Revenue (USD Billion) Forecast, by Country, 2016-2027
      Table 17: Asia Pacific Phycoerythrin Industry Market Revenue (USD Billion) Forecast, by Segment 1, 2016-2027
      Table 18: Asia Pacific Market Revenue (USD Billion) Forecast, by Segment 2, 2016-2027
      Table 19: Asia Pacific Market Revenue (USD Billion) Forecast, by Segment 3, 2016-2027
      Table 20: Asia Pacific Market Revenue (USD Billion) Forecast, by Country, 2016-2027
      Table 21: Middle East & Africa Phycoerythrin Industry Market Revenue (USD Billion) Forecast, by Segment 1, 2016-2027
      Table 22: Middle East & Africa Market Revenue (USD Billion) Forecast, by Segment 2, 2016-2027
      Table 23: Middle East & Africa Market Revenue (USD Billion) Forecast, by Segment 3, 2016-2027
      Table 24: Middle East & Africa Market Revenue (USD Billion) Forecast, by Country, 2016-2027
      Research Process

      Data Library Research are conducted by industry experts who offer insight on industry structure, market segmentations technology assessment and competitive landscape (CL), and penetration, as well as on emerging trends. Their analysis is based on primary interviews (~ 80%) and secondary research (~ 20%) as well as years of professional expertise in their respective industries. Adding to this, by analysing historical trends and current market positions, our analysts predict where the market will be headed for the next five years. Furthermore, the varying trends of segment & categories geographically presented are also studied and the estimated based on the primary & secondary research.

      In this particular report from the supply side Data Library Research has conducted primary surveys (interviews) with the key level executives (VP, CEO’s, Marketing Director, Business Development Manager and SOFT) of the companies that active & prominent as well as the midsized organization

      FIGURE 1: DLR RESEARH PROCESS

      Primary Research

      Extensive primary research was conducted to gain a deeper insight of the market and industry performance. The analysis is based on both primary and secondary research as well as years of professional expertise in the respective industries.

      In addition to analysing current and historical trends, our analysts predict where the market is headed over the next five years.

      It varies by segment for these categories geographically presented in the list of market tables. Speaking about this particular report we have conducted primary surveys (interviews) with the key level executives (VP, CEO’s, Marketing Director, Business Development Manager and many more) of the major players active in the market.

      Secondary Research

      Secondary research was mainly used to collect and identify information useful for the extensive, technical, market-oriented, and Friend’s study of the Global Extra Neutral Alcohol. It was also used to obtain key information about major players, market classification and segmentation according to the industry trends, geographical markets, and developments related to the market and technology perspectives. For this study, analysts have gathered information from various credible sources, such as annual reports, sec filings, journals, white papers, SOFT presentations, and company web sites.

      Market Size Estimation

      Both, top-down and bottom-up approaches were used to estimate and validate the size of the Global market and to estimate the size of various other dependent submarkets in the overall Extra Neutral Alcohol. The key players in the market were identified through secondary research and their market contributions in the respective geographies were determined through primary and secondary research.

      Forecast Model