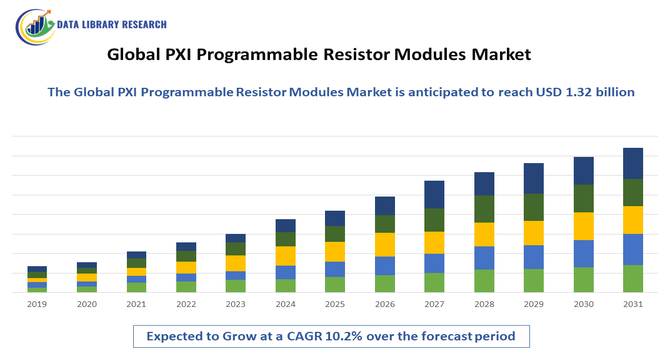
PXI Programmable Resistor Modules Market Overview and Analysis:
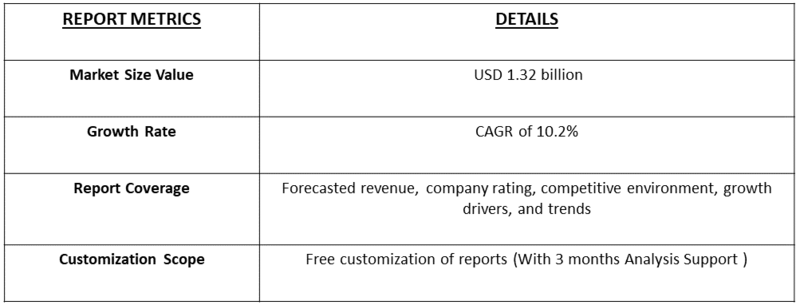
- The Global PXI Programmable Resistor Modules Market is expected to grow from 521.9 USD million in 2025 to 1.32 USD billion by 2035, growing with a CAGR of 10.2% from 2025 to 2032.
Get Complete Analysis Of The Report - Download Updated Free Sample PDF
The Global PXI Programmable Resistor Modules market involves advanced electronic modules used for testing and simulating electrical resistance in automated systems. These modules enable precise, repeatable, and configurable resistance values, supporting research, development, and quality assurance in industries like electronics, aerospace, automotive, and telecommunications. Growing demand for efficient, reliable, and high-speed testing solutions drove market expansion globally.
The global PXI programmable resistor modules market grew due to increasing demand for automated testing and simulation in electronics, aerospace, automotive, and telecommunications industries. Rising adoption of PXI-based test systems, the need for precise and repeatable resistance measurements, advancements in semiconductor testing, and growing focus on quality assurance and rapid prototyping further fueled market expansion globally.
PXI Programmable Resistor Modules Market Latest Trends
The PXI programmable resistor module market has experienced strong growth as industries, including automotive, telecommunications, aerospace, and electronics, increasingly rely on high-precision, flexible, and automated testing solutions. Technological advances improved module accuracy, resolution, resistance range, and power handling, allowing simulation of sensor loads and fault conditions for EV inverters, battery-management systems, and aerospace components. The rising complexity and miniaturization of electronic and automotive systems, along with the widespread adoption of Industry 4.0 and automation, further boosted demand.
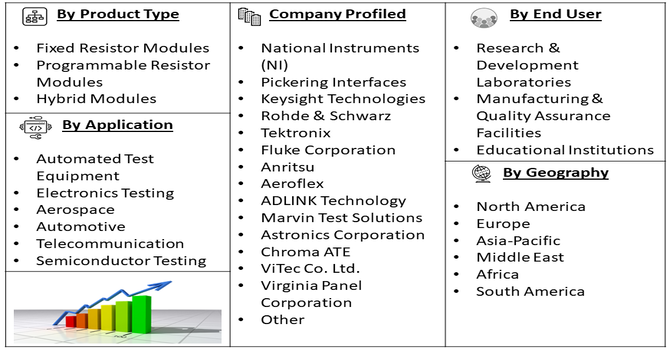
Segmentation: The Global PXI Programmable Resistor Modules Market Can Be Segmented by Module Type (Fixed Resistor Modules, Programmable Resistor Modules, and Hybrid Modules), Resistance Range (Low, Medium, and High Resistance Modules), Application (Automated Test Equipment, Electronics Testing, Aerospace, Automotive, Telecommunications, and Semiconductor Testing), End-Users (Research & Development Laboratories, Manufacturing & Quality Assurance Facilities, and Educational Institutions) and Geography (North America, Europe, Asia-Pacific, Middle East and Africa, and South America). The report provides the value (in USD million) for the above segments.
For Detailed Market Segmentation - Get a Free Sample PDF
Market Drivers:
- Increasing Demand for Automated Testing and Simulation
The global PXI programmable resistor modules market was driven by rising demand for automated testing and simulation across electronics, automotive, aerospace, and telecommunications sectors. As devices and systems grew more complex, manufacturers required high-precision, repeatable, and configurable resistance solutions to validate performance, simulate fault conditions, and ensure quality control. PXI-based modules enabled rapid prototyping, reduced testing time, and improved efficiency, allowing companies to meet strict industry standards. The adoption of Industry 4.0 practices, including smart manufacturing and automated test platforms, further reinforced the need for PXI programmable resistor modules, driving global market growth consistently over the forecast period.
- Technological Advancements and Industry 4.0 Adoption
Technological advancements in PXI and PXIe systems significantly fueled market growth. Improved module accuracy, higher resistance ranges, faster switching speeds, and better software integration enabled more sophisticated simulation and testing, supporting emerging applications such as electric vehicles, 5G networks, and aerospace electronics. Coupled with the adoption of Industry 4.0 and smart manufacturing practices, companies increasingly relied on modular, automated test solutions to optimize production efficiency and reduce operational costs. The capability to perform precise, repeatable, and scalable testing enhances product reliability and quality, making PXI programmable resistor modules an essential component in modern electronics testing infrastructure globally.
Market Restraints:
- High Costs and Complex Integration Challenges
Despite their advantages, PXI programmable resistor modules faced restraints due to high acquisition costs and integration complexities. Advanced PXI/PXIe modules required significant investment in hardware, software, and training, limiting adoption among small and medium-sized enterprises. Integration into existing automated test systems demanded technical expertise and time-consuming setup, creating barriers for rapid deployment. Additionally, maintenance, calibration, and compatibility with other test instruments added to operational expenses. In regions with limited industrial infrastructure or low technology penetration, these costs and technical challenges restricted widespread adoption.
Socioeconomic Impact on PXI Programmable Resistor Modules Market
The adoption of PXI programmable resistor modules has enhanced efficiency and reliability in manufacturing and testing workflows, reducing time-to-market for complex electronics and automotive products. Improved quality control and lower defect rates benefit end consumers with safer, higher-quality products. The market also supported job creation in advanced testing, engineering, and R&D sectors, particularly in regions with high-tech manufacturing. By enabling precise simulation and testing for EV batteries, semiconductors, and telecom hardware, these modules helped industries comply with regulatory and safety standards. Thus, the technology contributed to industrial growth, technological advancement, and economic competitiveness globally.
Segmental Analysis:
- Programmable Resistor Modules segment is expected to witness the highest growth over the forecast period
The programmable resistor modules segment was projected to witness the highest growth over the forecast period due to increasing demand for flexible and automated test solutions across industries. These modules allowed engineers to configure resistance values dynamically, enabling precise simulation of complex electrical and electronic systems without manual intervention. Their ability to replicate fault conditions, sensor responses, and varied load scenarios improved testing efficiency and reduced time-to-market. As industries such as automotive, aerospace, and telecommunications adopted PXI-based automated test platforms, the preference for programmable modules surged, positioning this segment as a key growth driver in the global market.
- Medium Resistive Modules segment is expected to witness the highest growth over the forecast period
Medium resistive modules were expected to lead growth due to their versatility and widespread application across electronics and industrial testing. These modules provided an optimal balance between low and high resistance ranges, catering to the majority of simulation and load-testing requirements. They were particularly suitable for automotive electronics, power systems, and semiconductor testing, where moderate resistance emulation is critical. The combination of high accuracy, reliability, and cost-effectiveness made medium resistive modules the preferred choice for engineers and test laboratories. Increasing adoption of automated testing, coupled with the need for precise system characterization, contributed to strong market growth for this segment globally.
- Automotive segment is expected to witness the highest growth over the forecast period
The automotive sector was expected to experience the highest growth for PXI programmable resistor modules due to the industry’s shift toward electric vehicles, autonomous driving, and advanced driver-assistance systems (ADAS). Testing electronic control units (ECUs), battery management systems, sensors, and in-vehicle networks required high-precision, repeatable, and configurable resistor modules to simulate real-world conditions. Increased regulatory standards and the need for rigorous quality assurance accelerated adoption. Furthermore, the automotive industry’s focus on reducing development cycles and ensuring safety compliance drove investments in PXI-based automated test solutions, positioning the automotive segment as a critical driver of global programmable resistor module market growth.
- Manufacturing & Quality Assurance Facilities segment is expected to witness the highest growth over the forecast period
Manufacturing and quality assurance facilities were projected to witness the highest growth due to their critical role in validating electronic and electrical systems. PXI programmable resistor modules enabled these facilities to perform accurate, repeatable, and automated testing of components, sub-systems, and complete products, ensuring compliance with stringent industry standards. Adoption of automated test systems improved throughput, reduced errors, and minimized production downtime. The growing emphasis on reducing manufacturing costs while maintaining high product quality incentivized companies to deploy programmable resistor modules in R&D, production, and QA processes. Consequently, manufacturing and QA facilities became key end-users driving market expansion globally.
- North America region is expected to witness the highest growth over the forecast period
North America was expected to lead growth in the PXI programmable resistor modules market due to its mature electronics, automotive, aerospace, and semiconductor industries. High adoption of advanced automated test systems, coupled with ongoing Industry 4.0 initiatives, increased demand for precision testing solutions.
Strong R&D infrastructure, availability of skilled engineering talent, and early adoption of electric and autonomous vehicle technologies further fueled growth. Companies in the U.S. and Canada increasingly invested in PXI-based resistor modules to optimize testing efficiency, reduce product development cycles, and ensure regulatory compliance. For instance, in 2021, Delta leveraged decades of R&D and manufacturing expertise to develop a highly efficient automated power supply testing system. The system featured built-in power testing aligned with international standards and allowed easy software-based editing of procedures. This innovation enhanced automated testing capabilities, accelerated product verification, and drove demand for PXI programmable resistor modules in the U.S. market. Thus, these factors collectively positioned North America as the fastest-growing regional market for programmable resistor modules.
To Learn More About This Report - Request a Free Sample Copy
PXI Programmable Resistor Modules Market Competitive Landscape
The competitive landscape is dominated by established test-equipment leaders and specialized module manufacturers. Companies such as National Instruments, Pickering Interfaces, Keysight Technologies, and Rohde & Schwarz lead by offering comprehensive PXI/PXIe modules and automated test solutions. Strategic collaborations, joint development projects, and continuous R&D investments are common approaches to maintain leadership, ensuring precision, reliability, and compliance with evolving industry standards.
The major players for above market are:
- National Instruments (NI)
- Pickering Interfaces
- Keysight Technologies
- Rohde & Schwarz
- Tektronix
- Fluke Corporation
- Anritsu
- Aeroflex
- ADLINK Technology
- Marvin Test Solutions
- Astronics Corporation
- Chroma ATE
- ViTec Co. Ltd.
- Virginia Panel Corporation
- Sundance Multiprocessor Technology
- Conduant Corporation
- Quantifi Photonics Inc.
- AMETEK, Inc.
- Teradyne, Inc.
- Advantest Corporation
Recent Development
- In October 2025, Keysight Technologies, Inc. launched the UALink 1.0 transmitter test solution, a dedicated compliance tool for UALink devices. The solution enabled high-speed validation of advanced computing and AI interconnect systems, automating critical electrical measurements to ensure signal integrity and compliance with standards, supporting link speeds up to 200 Gb/s and enhancing testing efficiency for next-generation high-performance applications.
- In October 2025, Teradyne, Inc. launched the ETS-800 D20, the latest addition to its high-performance ETS-800 test system platform for power semiconductors. The system provided a versatile, cost-effective solution for both high-volume and high-mix/low-volume device testing, addressing diverse customer needs and enhancing efficiency in automated semiconductor testing across various production and R&D environments.
Frequently Asked Questions (FAQ) :
Q1. What are the main growth-driving factors for this market?
The main driver is the growing need for automated testing across key sectors like aerospace, telecommunications, and automotive. PXI modules offer the high precision and flexibility required to simulate complex real-world sensor conditions and loads, which is crucial for modern applications like electric vehicle (EV) battery management systems.
Q2. What are the main restraining factors for this market?
The primary restraint is the significant initial investment cost associated with setting up a full PXI system, which can be prohibitive for smaller companies. Additionally, the complexity of configuring PXI hardware and software requires specialized technical expertise, creating a barrier to wider adoption.
Q3. Which segment is expected to witness high growth?
The Automotive application segment, specifically for Car Production and electric vehicle (EV) component testing, is expected to see the fastest growth. As manufacturers accelerate the development of batteries and autonomous driving systems, the demand for high-accuracy, programmable simulation tools grows rapidly.
Q4. Who are the top major players for this market?
The market is led by companies specializing in modular instrumentation and high-performance switching solutions. The top major players globally include Pickering Interfaces, National Instruments (NI), Marvin Test Solutions, AMETEK, and WireFlow.
Q5. Which country is the largest player?
The United States is the largest country player, dominating the market through its advanced technological infrastructure and high investment in defense, aerospace, and high-tech electronics R&D. Favorable government focus on modernizing testing standards also drives strong demand.
List of Figures
Figure 1: Global PXI Programmable Resistor Modules Market Revenue Breakdown (USD Billion, %) by Region, 2022 & 2029
Figure 2: Global PXI Programmable Resistor Modules Market Value Share (%), By Segment 1, 2022 & 2029
Figure 3: Global PXI Programmable Resistor Modules Market Forecast (USD Billion), by Sub-Segment 1, 2018-2029
Figure 4: Global PXI Programmable Resistor Modules Market Forecast (USD Billion), by Sub-Segment 2, 2018-2029
Figure 5: Global PXI Programmable Resistor Modules Market Value Share (%), By Segment 2, 2022 & 2029
Figure 6: Global PXI Programmable Resistor Modules Market Forecast (USD Billion), by Sub-Segment 1, 2018-2029
Figure 7: Global PXI Programmable Resistor Modules Market Forecast (USD Billion), by Sub-Segment 2, 2018-2029
Figure 8: Global PXI Programmable Resistor Modules Market Forecast (USD Billion), by Sub-Segment 3, 2018-2029
Figure 9: Global PXI Programmable Resistor Modules Market Forecast (USD Billion), by Others, 2018-2029
Figure 10: Global PXI Programmable Resistor Modules Market Value Share (%), By Segment 3, 2022 & 2029
Figure 11: Global PXI Programmable Resistor Modules Market Forecast (USD Billion), by Sub-Segment 1, 2018-2029
Figure 12: Global PXI Programmable Resistor Modules Market Forecast (USD Billion), by Sub-Segment 2, 2018-2029
Figure 13: Global PXI Programmable Resistor Modules Market Forecast (USD Billion), by Sub-Segment 3, 2018-2029
Figure 14: Global PXI Programmable Resistor Modules Market Forecast (USD Billion), by Others, 2018-2029
Figure 15: Global PXI Programmable Resistor Modules Market Value (USD Billion), by Region, 2022 & 2029
Figure 16: North America PXI Programmable Resistor Modules Market Value Share (%), By Segment 1, 2022 & 2029
Figure 17: North America PXI Programmable Resistor Modules Market Forecast (USD Billion), by Sub-Segment 1, 2018-2029
Figure 18: North America PXI Programmable Resistor Modules Market Forecast (USD Billion), by Sub-Segment 2, 2018-2029
Figure 19: North America PXI Programmable Resistor Modules Market Value Share (%), By Segment 2, 2022 & 2029
Figure 20: North America PXI Programmable Resistor Modules Market Forecast (USD Billion), by Sub-Segment 1, 2018-2029
Figure 21: North America PXI Programmable Resistor Modules Market Forecast (USD Billion), by Sub-Segment 2, 2018-2029
Figure 22: North America PXI Programmable Resistor Modules Market Forecast (USD Billion), by Sub-Segment 3, 2018-2029
Figure 23: North America PXI Programmable Resistor Modules Market Forecast (USD Billion), by Others, 2018-2029
Figure 24: North America PXI Programmable Resistor Modules Market Value Share (%), By Segment 3, 2022 & 2029
Figure 25: North America PXI Programmable Resistor Modules Market Forecast (USD Billion), by Sub-Segment 1, 2018-2029
Figure 26: North America PXI Programmable Resistor Modules Market Forecast (USD Billion), by Sub-Segment 2, 2018-2029
Figure 27: North America PXI Programmable Resistor Modules Market Forecast (USD Billion), by Sub-Segment 3, 2018-2029
Figure 28: North America PXI Programmable Resistor Modules Market Forecast (USD Billion), by Others, 2018-2029
Figure 29: North America PXI Programmable Resistor Modules Market Forecast (USD Billion), by U.S., 2018-2029
Figure 30: North America PXI Programmable Resistor Modules Market Forecast (USD Billion), by Canada, 2018-2029
Figure 31: Latin America PXI Programmable Resistor Modules Market Value Share (%), By Segment 1, 2022 & 2029
Figure 32: Latin America PXI Programmable Resistor Modules Market Forecast (USD Billion), by Sub-Segment 1, 2018-2029
Figure 33: Latin America PXI Programmable Resistor Modules Market Forecast (USD Billion), by Sub-Segment 2, 2018-2029
Figure 34: Latin America PXI Programmable Resistor Modules Market Value Share (%), By Segment 2, 2022 & 2029
Figure 35: Latin America PXI Programmable Resistor Modules Market Forecast (USD Billion), by Sub-Segment 1, 2018-2029
Figure 36: Latin America PXI Programmable Resistor Modules Market Forecast (USD Billion), by Sub-Segment 2, 2018-2029
Figure 37: Latin America PXI Programmable Resistor Modules Market Forecast (USD Billion), by Sub-Segment 3, 2018-2029
Figure 38: Latin America PXI Programmable Resistor Modules Market Forecast (USD Billion), by Others, 2018-2029
Figure 39: Latin America PXI Programmable Resistor Modules Market Value Share (%), By Segment 3, 2022 & 2029
Figure 40: Latin America PXI Programmable Resistor Modules Market Forecast (USD Billion), by Sub-Segment 1, 2018-2029
Figure 41: Latin America PXI Programmable Resistor Modules Market Forecast (USD Billion), by Sub-Segment 2, 2018-2029
Figure 42: Latin America PXI Programmable Resistor Modules Market Forecast (USD Billion), by Sub-Segment 3, 2018-2029
Figure 43: Latin America PXI Programmable Resistor Modules Market Forecast (USD Billion), by Others, 2018-2029
Figure 44: Latin America PXI Programmable Resistor Modules Market Forecast (USD Billion), by Brazil, 2018-2029
Figure 45: Latin America PXI Programmable Resistor Modules Market Forecast (USD Billion), by Mexico, 2018-2029
Figure 46: Latin America PXI Programmable Resistor Modules Market Forecast (USD Billion), by Rest of Latin America, 2018-2029
Figure 47: Europe PXI Programmable Resistor Modules Market Value Share (%), By Segment 1, 2022 & 2029
Figure 48: Europe PXI Programmable Resistor Modules Market Forecast (USD Billion), by Sub-Segment 1, 2018-2029
Figure 49: Europe PXI Programmable Resistor Modules Market Forecast (USD Billion), by Sub-Segment 2, 2018-2029
Figure 50: Europe PXI Programmable Resistor Modules Market Value Share (%), By Segment 2, 2022 & 2029
Figure 51: Europe PXI Programmable Resistor Modules Market Forecast (USD Billion), by Sub-Segment 1, 2018-2029
Figure 52: Europe PXI Programmable Resistor Modules Market Forecast (USD Billion), by Sub-Segment 2, 2018-2029
Figure 53: Europe PXI Programmable Resistor Modules Market Forecast (USD Billion), by Sub-Segment 3, 2018-2029
Figure 54: Europe PXI Programmable Resistor Modules Market Forecast (USD Billion), by Others, 2018-2029
Figure 55: Europe PXI Programmable Resistor Modules Market Value Share (%), By Segment 3, 2022 & 2029
Figure 56: Europe PXI Programmable Resistor Modules Market Forecast (USD Billion), by Sub-Segment 1, 2018-2029
Figure 57: Europe PXI Programmable Resistor Modules Market Forecast (USD Billion), by Sub-Segment 2, 2018-2029
Figure 58: Europe PXI Programmable Resistor Modules Market Forecast (USD Billion), by Sub-Segment 3, 2018-2029
Figure 59: Europe PXI Programmable Resistor Modules Market Forecast (USD Billion), by Others, 2018-2029
Figure 60: Europe PXI Programmable Resistor Modules Market Forecast (USD Billion), by U.K., 2018-2029
Figure 61: Europe PXI Programmable Resistor Modules Market Forecast (USD Billion), by Germany, 2018-2029
Figure 62: Europe PXI Programmable Resistor Modules Market Forecast (USD Billion), by France, 2018-2029
Figure 63: Europe PXI Programmable Resistor Modules Market Forecast (USD Billion), by Italy, 2018-2029
Figure 64: Europe PXI Programmable Resistor Modules Market Forecast (USD Billion), by Spain, 2018-2029
Figure 65: Europe PXI Programmable Resistor Modules Market Forecast (USD Billion), by Russia, 2018-2029
Figure 66: Europe PXI Programmable Resistor Modules Market Forecast (USD Billion), by Rest of Europe, 2018-2029
Figure 67: Asia Pacific PXI Programmable Resistor Modules Market Value Share (%), By Segment 1, 2022 & 2029
Figure 68: Asia Pacific PXI Programmable Resistor Modules Market Forecast (USD Billion), by Sub-Segment 1, 2018-2029
Figure 69: Asia Pacific PXI Programmable Resistor Modules Market Forecast (USD Billion), by Sub-Segment 2, 2018-2029
Figure 70: Asia Pacific PXI Programmable Resistor Modules Market Value Share (%), By Segment 2, 2022 & 2029
Figure 71: Asia Pacific PXI Programmable Resistor Modules Market Forecast (USD Billion), by Sub-Segment 1, 2018-2029
Figure 72: Asia Pacific PXI Programmable Resistor Modules Market Forecast (USD Billion), by Sub-Segment 2, 2018-2029
Figure 73: Asia Pacific PXI Programmable Resistor Modules Market Forecast (USD Billion), by Sub-Segment 3, 2018-2029
Figure 74: Asia Pacific PXI Programmable Resistor Modules Market Forecast (USD Billion), by Others, 2018-2029
Figure 75: Asia Pacific PXI Programmable Resistor Modules Market Value Share (%), By Segment 3, 2022 & 2029
Figure 76: Asia Pacific PXI Programmable Resistor Modules Market Forecast (USD Billion), by Sub-Segment 1, 2018-2029
Figure 77: Asia Pacific PXI Programmable Resistor Modules Market Forecast (USD Billion), by Sub-Segment 2, 2018-2029
Figure 78: Asia Pacific PXI Programmable Resistor Modules Market Forecast (USD Billion), by Sub-Segment 3, 2018-2029
Figure 79: Asia Pacific PXI Programmable Resistor Modules Market Forecast (USD Billion), by Others, 2018-2029
Figure 80: Asia Pacific PXI Programmable Resistor Modules Market Forecast (USD Billion), by China, 2018-2029
Figure 81: Asia Pacific PXI Programmable Resistor Modules Market Forecast (USD Billion), by India, 2018-2029
Figure 82: Asia Pacific PXI Programmable Resistor Modules Market Forecast (USD Billion), by Japan, 2018-2029
Figure 83: Asia Pacific PXI Programmable Resistor Modules Market Forecast (USD Billion), by Australia, 2018-2029
Figure 84: Asia Pacific PXI Programmable Resistor Modules Market Forecast (USD Billion), by Southeast Asia, 2018-2029
Figure 85: Asia Pacific PXI Programmable Resistor Modules Market Forecast (USD Billion), by Rest of Asia Pacific, 2018-2029
Figure 86: Middle East & Africa PXI Programmable Resistor Modules Market Value Share (%), By Segment 1, 2022 & 2029
Figure 87: Middle East & Africa PXI Programmable Resistor Modules Market Forecast (USD Billion), by Sub-Segment 1, 2018-2029
Figure 88: Middle East & Africa PXI Programmable Resistor Modules Market Forecast (USD Billion), by Sub-Segment 2, 2018-2029
Figure 89: Middle East & Africa PXI Programmable Resistor Modules Market Value Share (%), By Segment 2, 2022 & 2029
Figure 90: Middle East & Africa PXI Programmable Resistor Modules Market Forecast (USD Billion), by Sub-Segment 1, 2018-2029
Figure 91: Middle East & Africa PXI Programmable Resistor Modules Market Forecast (USD Billion), by Sub-Segment 2, 2018-2029
Figure 92: Middle East & Africa PXI Programmable Resistor Modules Market Forecast (USD Billion), by Sub-Segment 3, 2018-2029
Figure 93: Middle East & Africa PXI Programmable Resistor Modules Market Forecast (USD Billion), by Others, 2018-2029
Figure 94: Middle East & Africa PXI Programmable Resistor Modules Market Value Share (%), By Segment 3, 2022 & 2029
Figure 95: Middle East & Africa PXI Programmable Resistor Modules Market Forecast (USD Billion), by Sub-Segment 1, 2018-2029
Figure 96: Middle East & Africa PXI Programmable Resistor Modules Market Forecast (USD Billion), by Sub-Segment 2, 2018-2029
Figure 97: Middle East & Africa PXI Programmable Resistor Modules Market Forecast (USD Billion), by Sub-Segment 3, 2018-2029
Figure 98: Middle East & Africa PXI Programmable Resistor Modules Market Forecast (USD Billion), by Others, 2018-2029
Figure 99: Middle East & Africa PXI Programmable Resistor Modules Market Forecast (USD Billion), by GCC, 2018-2029
Figure 100: Middle East & Africa PXI Programmable Resistor Modules Market Forecast (USD Billion), by South Africa, 2018-2029
Figure 101: Middle East & Africa PXI Programmable Resistor Modules Market Forecast (USD Billion), by Rest of Middle East & Africa, 2018-2029
List of Tables
Table 1: Global PXI Programmable Resistor Modules Market Revenue (USD Billion) Forecast, by Segment 1, 2018-2029
Table 2: Global PXI Programmable Resistor Modules Market Revenue (USD Billion) Forecast, by Segment 2, 2018-2029
Table 3: Global PXI Programmable Resistor Modules Market Revenue (USD Billion) Forecast, by Segment 3, 2018-2029
Table 4: Global PXI Programmable Resistor Modules Market Revenue (USD Billion) Forecast, by Region, 2018-2029
Table 5: North America PXI Programmable Resistor Modules Market Revenue (USD Billion) Forecast, by Segment 1, 2018-2029
Table 6: North America PXI Programmable Resistor Modules Market Revenue (USD Billion) Forecast, by Segment 2, 2018-2029
Table 7: North America PXI Programmable Resistor Modules Market Revenue (USD Billion) Forecast, by Segment 3, 2018-2029
Table 8: North America PXI Programmable Resistor Modules Market Revenue (USD Billion) Forecast, by Country, 2018-2029
Table 9: Europe PXI Programmable Resistor Modules Market Revenue (USD Billion) Forecast, by Segment 1, 2018-2029
Table 10: Europe PXI Programmable Resistor Modules Market Revenue (USD Billion) Forecast, by Segment 2, 2018-2029
Table 11: Europe PXI Programmable Resistor Modules Market Revenue (USD Billion) Forecast, by Segment 3, 2018-2029
Table 12: Europe PXI Programmable Resistor Modules Market Revenue (USD Billion) Forecast, by Country, 2018-2029
Table 13: Latin America PXI Programmable Resistor Modules Market Revenue (USD Billion) Forecast, by Segment 1, 2018-2029
Table 14: Latin America PXI Programmable Resistor Modules Market Revenue (USD Billion) Forecast, by Segment 2, 2018-2029
Table 15: Latin America PXI Programmable Resistor Modules Market Revenue (USD Billion) Forecast, by Segment 3, 2018-2029
Table 16: Latin America PXI Programmable Resistor Modules Market Revenue (USD Billion) Forecast, by Country, 2018-2029
Table 17: Asia Pacific PXI Programmable Resistor Modules Market Revenue (USD Billion) Forecast, by Segment 1, 2018-2029
Table 18: Asia Pacific PXI Programmable Resistor Modules Market Revenue (USD Billion) Forecast, by Segment 2, 2018-2029
Table 19: Asia Pacific PXI Programmable Resistor Modules Market Revenue (USD Billion) Forecast, by Segment 3, 2018-2029
Table 20: Asia Pacific PXI Programmable Resistor Modules Market Revenue (USD Billion) Forecast, by Country, 2018-2029
Table 21: Middle East & Africa PXI Programmable Resistor Modules Market Revenue (USD Billion) Forecast, by Segment 1, 2018-2029
Table 22: Middle East & Africa PXI Programmable Resistor Modules Market Revenue (USD Billion) Forecast, by Segment 2, 2018-2029
Table 23: Middle East & Africa PXI Programmable Resistor Modules Market Revenue (USD Billion) Forecast, by Segment 3, 2018-2029
Table 24: Middle East & Africa PXI Programmable Resistor Modules Market Revenue (USD Billion) Forecast, by Country, 2018-2029
Research Process
Data Library Research are conducted by industry experts who offer insight on
industry structure, market segmentations technology assessment and competitive landscape (CL), and penetration, as well as on emerging trends. Their analysis is based on primary interviews (~ 80%) and secondary research (~ 20%) as well as years of professional expertise in their respective industries. Adding to this, by analysing historical trends and current market positions, our analysts predict where the market will be headed for the next five years. Furthermore, the varying trends of segment & categories geographically presented are also studied and the estimated based on the primary & secondary research.
In this particular report from the supply side Data Library Research has conducted primary surveys (interviews) with the key level executives (VP, CEO’s, Marketing Director, Business Development Manager
and SOFT) of the companies that active & prominent as well as the midsized organization
FIGURE 1: DLR RESEARH PROCESS
![research-methodology1]()
Primary Research
Extensive primary research was conducted to gain a deeper insight of the market and industry performance. The analysis is based on both primary and secondary research as well as years of professional expertise in the respective industries.
In addition to analysing current and historical trends, our analysts predict where the market is headed over the next five years.
It varies by segment for these categories geographically presented in the list of market tables. Speaking about this particular report we have conducted primary surveys (interviews) with the key level executives (VP, CEO’s, Marketing Director, Business Development Manager and many more) of the major players active in the market.
Secondary Research
Secondary research was mainly used to collect and identify information useful for the extensive, technical, market-oriented, and Friend’s study of the Global Extra Neutral Alcohol. It was also used to obtain key information about major players, market classification and segmentation according to the industry trends, geographical markets, and developments related to the market and technology perspectives. For this study, analysts have gathered information from various credible sources, such as annual reports, sec filings, journals, white papers, SOFT presentations, and company web sites.
Market Size Estimation
Both, top-down and bottom-up approaches were used to estimate and validate the size of the Global market and to estimate the size of various other dependent submarkets in the overall Extra Neutral Alcohol. The key players in the market were identified through secondary research and their market contributions in the respective geographies were determined through primary and secondary research.
Forecast Model
![research-methodology2]()