Refined Functional Carbohydrates Market Overview and Analysis:
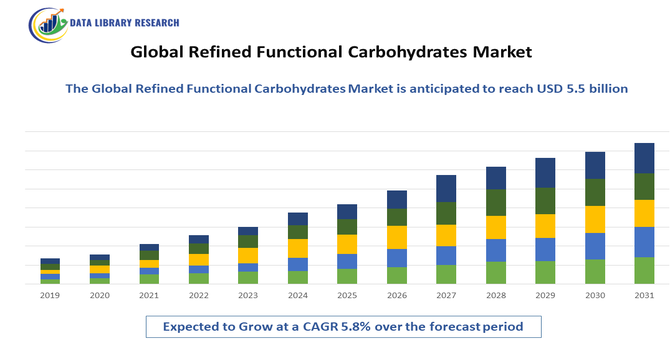
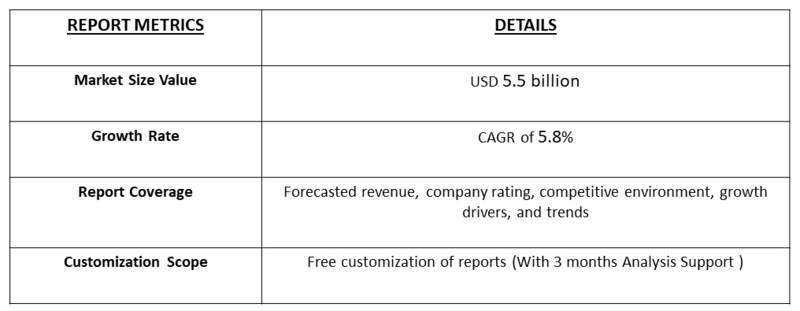
The Refined Functional Carbohydrates Market size is estimated to be USD 4.8 billion in 2025 and is expected to reach USD 5.5 billion by 2032, and is expected to grow at a CAGR of 5.8%.
Get Complete Analysis Of The Report - Download Free Sample PDF
The refined functional carbohydrate market is fundamentally redefined as a dynamic and evolving sector that extends far beyond traditional food and sweetener applications. It now encompasses a diverse range of product streams, including native and modified starches, sugar alcohols (polyols), specialty sugars, and novel functional fibers, driven by innovation in processing and biotechnology. This market is increasingly pivoting towards health and wellness, supplying low-glycemic and prebiotic ingredients for functional foods and beverages, as well as serving critical non-food industrial applications in pharmaceuticals (as excipients), bioplastics, biofuels, and personal care products, reflecting its integral role in both sustainable consumer goods and the bio-based economy.
Refined Functional Carbohydrates Market Latest Trends:
The market for "redefined carbohydrates" is undergoing a significant transformation driven by a global shift in consumer priorities. A growing number of consumers are moving away from traditional, simple carbohydrates and actively seeking healthier, functional alternatives that offer added benefits. This trend is fueling demand for products that are naturally high in protein, fiber, minerals, and antioxidants, and low in fat. Consequently, food manufacturers are increasingly innovating with ingredients like red rice and seeds to fortify products, providing a strategic pathway for them to meet consumer expectations and contribute to the growth and evolution of the market.
Segmentation:
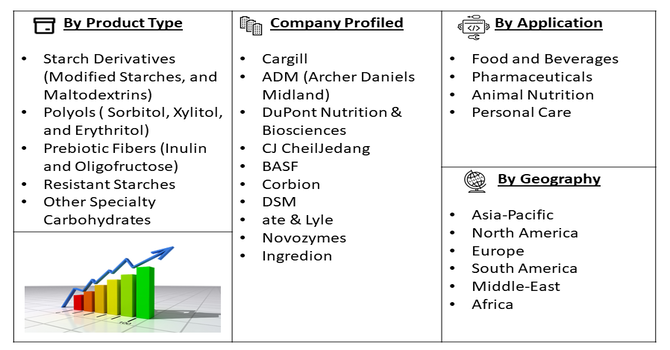
The refined functional carbohydrates market is segmented primarily by Product Type, (Starch Derivatives (Modified Starches, and Maltodextrins), Polyols ( Sorbitol, Xylitol, and Erythritol), Prebiotic Fibers (Inulin and Oligofructose), Resistant Starches, and Other Specialty Carbohydrates)), Application (Food and Beverages, Pharmaceuticals, Animal Nutrition, and Personal Care) and Geography (North America, Europe, Asia-Pacific, Middle East and Africa, and South America). The report provides the value (in USD million) for the above segments.
For Detailed Market Segmentation - Get a Free Sample PDF
Market Drivers:
- Growing Consumer Demand for Health and Wellness
A significant driver for the refined functional carbohydrates market is the escalating global consumer focus on health and wellness, coupled with an increased awareness of the role of diet in disease prevention and overall well-being. This trend fuels demand for ingredients that offer specific health benefits beyond basic nutrition, such as improved gut health, enhanced satiety, and blood sugar management. Prebiotic fibers like inulin and oligofructose are gaining immense popularity due to their proven ability to support a healthy gut microbiome, leading to increased adoption in dairy products, baked goods, and dietary supplements. Similarly, low-glycemic index carbohydrates and sugar-replacement solutions derived from refined functional carbohydrates are sought after by consumers looking to manage weight and reduce their intake of refined sugars. This fundamental shift in consumer priorities is compelling food and beverage manufacturers to reformulate their products, creating a robust demand for these specialized ingredients.
- Technological Advancements and Product Innovations
Ingredient Science Significant advancements in biotechnology, enzymatic engineering, and extraction processes are a major catalyst for market growth. These technologies enable manufacturers to produce highly purified, targeted, and efficacious functional carbohydrates with enhanced properties, such as improved solubility, stability, and specific health benefits. Innovation is leading to the development of novel ingredients from diverse and sustainable sources, including agricultural side streams, which improves cost-effectiveness and aligns with circular economy principles. This continuous R&D allows companies to create superior, science-backed solutions that meet stringent regulatory standards and cater to the evolving needs of the pharmaceutical and nutraceutical industries, opening new application avenues.
Market Restraints:
- High Production Costs and Complex Regulatory Hurdles
A significant restraint on the market's expansion is the substantial cost and complexity involved in the production and commercialization of these advanced ingredients. The manufacturing processes for high-purity refined functional carbohydrates often require specialized equipment, sophisticated technology, and rigorous quality control, leading to high capital and operational expenditures. Furthermore, navigating the complex and varying global regulatory landscapes for health claims is a major challenge. Obtaining approvals from bodies like the FDA (GRAS), EFSA, and others is a time-consuming and expensive process. Any ambiguity or rejection of a health claim can severely limit a product's market potential and deter investment, hindering widespread adoption.
Social Economic Impact On Refined Functional Carbohydrates Markets
The market for "redefined carbohydrates" has a profound socio-economic impact, beginning with public health. By shifting consumers toward products with higher fiber and protein and lower fat, this market can help combat the rise of diet-related diseases like obesity and diabetes, potentially reducing long-term healthcare costs. Economically, this trend stimulates significant innovation and investment within the food manufacturing industry, creating new job opportunities in research, development, and production. It also diversifies agricultural supply chains by increasing the demand for alternative crops and specialized ingredients, which can benefit farmers and create new revenue streams for farming communities.
Segmental Analysis
- Maltodextrins Product Type Segment is Expected to Witness Significant Growth Over the Forecast Period
The Maltodextrins segment is poised for significant growth within the refined functional carbohydrates market, driven by its exceptional versatility and cost-effectiveness. As a widely applicable starch derivative, maltodextrins excel in providing desirable textural properties, acting as bulking agents, carriers for flavors and colors, and thickeners in a myriad of food and beverage products. Their solubility, low viscosity, and neutral taste profile make them an ideal ingredient for applications ranging from infant formulas and sports nutrition products to baked goods and processed snacks. Furthermore, ongoing research into enhancing their digestive properties and developing specialized grades for specific functionalities, such as controlled release or improved stability in acidic environments, is expected to further broaden their appeal. The ability of maltodextrins to improve mouthfeel and stability while managing costs makes them a staple for manufacturers aiming to meet consumer demand for palatable and affordable food items.
- Food and Beverages Application Segment is Expected to Witness Significant Growth Over the Forecast Period
The food and beverages application segment is anticipated to be the dominant and fastest-growing area for refined functional carbohydrates. This surge is directly attributed to the accelerating consumer demand for healthier, fortified food options that offer benefits beyond basic nutrition. Manufacturers are actively reformulating products to incorporate ingredients like prebiotic fibers, resistant starches, and soluble corn fiber to promote digestive health, manage blood sugar levels, and reduce calorie content. The segment's growth is pervasive across categories including dairy (yogurts, fermented drinks), bakery (high-fiber breads), cereals, beverages (functional drinks), and infant nutrition, driven by strong marketing of health claims and the global trend towards preventive healthcare through diet.
- North America Region is Expected to Witness Significant Growth Over the Forecast Period
North America is projected to witness substantial growth in the refined functional carbohydrates market, largely due to a highly health-conscious consumer base, a robust and innovative food and beverage industry, and strong regulatory support for functional ingredients. The region has a high prevalence of lifestyle-related health issues such as obesity and diabetes, which is driving demand for low-glycemic and gut-health-promoting products. Well-established distribution channels and high consumer spending power enable the rapid adoption of new fortified products. Furthermore, the presence of major global ingredient manufacturers and their significant investments in research and development within North America ensures a continuous pipeline of innovative solutions, solidifying the region's position as a key growth market.
To Learn More About This Report - Request a Free Sample Copy
Refined Functional Carbohydrates Market Competitive Landscape:
The competitive landscape of the refined functional carbohydrates market is shaped by a mix of食品Ingredients suppliers, specialty biotech firms, food and health manufacturers, and contract development and manufacturing organizations competing on purity, functionality (taste, texture, glycemic response, prebiotic effects), regulatory compliance, and sustainability credentials. Key differentiators include enzyme engineering, fermentation efficiency, proprietary purification technologies, and the ability to scale vertically from biomass to finished ingredients. Consolidation through acquisitions and partnerships accelerates access to diverse substrates and advanced analytics, while traceability, clean-label credentials, and certifications (non-GMO, organic, Kosher/Halal) influence buyer choice. Major players span global starch, biotech, and flavor companies, with regional champions leveraging local feedstock and regulatory familiarity to capture market share.
Here are 10 major players commonly active in the refined functional carbohydrates market:
- Cargill
- ADM (Archer Daniels Midland)
- DuPont Nutrition & Biosciences
- CJ CheilJedang
- BASF
- Corbion
- DSM
- ate & Lyle
- Novozymes
- Ingredion
Recent Developments:
- In May 2025, scientists from the Department of Biotechnology, Jaypee Institute of Information Technology, reported that the creation of fortified cookies using red rice and a blend of six different seeds. The study revealed that the new cookies possessed a superior nutritional profile, containing significantly higher levels of protein, fiber, minerals, amino acids, and antioxidants, while reducing fat content. Advanced analytical methods were used to confirm these findings, with KSOMs analysis grouping the cookies based on their similar properties and FTIR analysis revealing specific changes to their protein, lipid, and phenol levels following the fortification process. By validating the nutritional benefits of using alternative ingredients, the study helps drive the market's shift away from simple carbs toward fortified, nutrient-dense options.
- In December 2022, the UK government launched a new funding program offering grants of up to $309,612 to help livestock and dairy farmers improve or expand their slurry storage facilities. This initiative, alongside the global increase in meat and dairy consumption, is expected to significantly boost the cattle farming industry. Ultimately, this trend is creating a promising market for developing mannan-oligosaccharides (MOS) for use in cattle feed.
Frequently Asked Questions (FAQ) :
Q1. What the main growth driving factors for this market?
The market is primarily driven by rising demand for "better-for-you" and functional foods, which are sought after by health-conscious consumers. Growth is also fueled by the increasing use of refined functional carbohydrates as natural additives in animal feed to improve animal health and immunity.
Q2. What are the main restraining factors for this market?
Restraining factors include growing consumer awareness about the health risks associated with excessive refined carbohydrate consumption, such as obesity and related diseases. Supply chain disruptions, fluctuating raw material prices, and complex trade tariffs also pose significant challenges to market growth.
Q3. Which segment is expected to witness high growth?
The animal nutrition segment is expected to witness high growth due to the increasing demand for high-quality feed additives and natural growth promoters. Within this segment, both the mannan-oligosaccharides and beta-glucan product types are poised for significant expansion.
Q4. Who are the top major players for this market?
Top major players in the refined carbohydrate market include large food ingredient companies like Tate & Lyle, Cargill, Inc., and DuPont. Other key players include Ingredion, Roquette Frères, and Südzucker, who focus on various specialty and functional carbohydrate products.
Q5. Which country is the largest player?
North America is the largest player in the refined functional carbohydrate market, holding the largest market share in 2025. This is driven by robust R&D ecosystems, favorable regulatory frameworks, and significant consumer demand for functional and health-oriented products.
List of Figures
Figure 1: Global Refined Functional Carbohydrates Market Revenue Breakdown (USD Billion, %) by Region, 2023 & 2030
Figure 2: Global Refined Functional Carbohydrates Market Value Share (%), By Segment 1, 2023 & 2030
Figure 3: Global Refined Functional Carbohydrates Market Forecast (USD Billion), by Sub-Segment 1, 2018-2030
Figure 4: Global Refined Functional Carbohydrates Market Forecast (USD Billion), by Sub-Segment 2, 2018-2030
Figure 5: Global Refined Functional Carbohydrates Market Value Share (%), By Segment 2, 2023 & 2030
Figure 6: Global Refined Functional Carbohydrates Market Forecast (USD Billion), by Sub-Segment 1, 2018-2030
Figure 7: Global Refined Functional Carbohydrates Market Forecast (USD Billion), by Sub-Segment 2, 2018-2030
Figure 8: Global Refined Functional Carbohydrates Market Forecast (USD Billion), by Sub-Segment 3, 2018-2030
Figure 9: Global Refined Functional Carbohydrates Market Forecast (USD Billion), by Others, 2018-2030
Figure 10: Global Refined Functional Carbohydrates Market Value Share (%), By Segment 3, 2023 & 2030
Figure 11: Global Refined Functional Carbohydrates Market Forecast (USD Billion), by Sub-Segment 1, 2018-2030
Figure 12: Global Refined Functional Carbohydrates Market Forecast (USD Billion), by Sub-Segment 2, 2018-2030
Figure 13: Global Refined Functional Carbohydrates Market Forecast (USD Billion), by Sub-Segment 3, 2018-2030
Figure 14: Global Refined Functional Carbohydrates Market Forecast (USD Billion), by Others, 2018-2030
Figure 15: Global Refined Functional Carbohydrates Market Value (USD Billion), by Region, 2023 & 2030
Figure 16: North America Refined Functional Carbohydrates Market Value Share (%), By Segment 1, 2023 & 2030
Figure 17: North America Refined Functional Carbohydrates Market Forecast (USD Billion), by Sub-Segment 1, 2018-2030
Figure 18: North America Refined Functional Carbohydrates Market Forecast (USD Billion), by Sub-Segment 2, 2018-2030
Figure 19: North America Refined Functional Carbohydrates Market Value Share (%), By Segment 2, 2023 & 2030
Figure 20: North America Refined Functional Carbohydrates Market Forecast (USD Billion), by Sub-Segment 1, 2018-2030
Figure 21: North America Refined Functional Carbohydrates Market Forecast (USD Billion), by Sub-Segment 2, 2018-2030
Figure 22: North America Refined Functional Carbohydrates Market Forecast (USD Billion), by Sub-Segment 3, 2018-2030
Figure 23: North America Refined Functional Carbohydrates Market Forecast (USD Billion), by Others, 2018-2030
Figure 24: North America Refined Functional Carbohydrates Market Value Share (%), By Segment 3, 2023 & 2030
Figure 25: North America Refined Functional Carbohydrates Market Forecast (USD Billion), by Sub-Segment 1, 2018-2030
Figure 26: North America Refined Functional Carbohydrates Market Forecast (USD Billion), by Sub-Segment 2, 2018-2030
Figure 27: North America Refined Functional Carbohydrates Market Forecast (USD Billion), by Sub-Segment 3, 2018-2030
Figure 28: North America Refined Functional Carbohydrates Market Forecast (USD Billion), by Others, 2018-2030
Figure 29: North America Refined Functional Carbohydrates Market Forecast (USD Billion), by U.S., 2018-2030
Figure 30: North America Refined Functional Carbohydrates Market Forecast (USD Billion), by Canada, 2018-2030
Figure 31: Latin America Refined Functional Carbohydrates Market Value Share (%), By Segment 1, 2023 & 2030
Figure 32: Latin America Refined Functional Carbohydrates Market Forecast (USD Billion), by Sub-Segment 1, 2018-2030
Figure 33: Latin America Refined Functional Carbohydrates Market Forecast (USD Billion), by Sub-Segment 2, 2018-2030
Figure 34: Latin America Refined Functional Carbohydrates Market Value Share (%), By Segment 2, 2023 & 2030
Figure 35: Latin America Refined Functional Carbohydrates Market Forecast (USD Billion), by Sub-Segment 1, 2018-2030
Figure 36: Latin America Refined Functional Carbohydrates Market Forecast (USD Billion), by Sub-Segment 2, 2018-2030
Figure 37: Latin America Refined Functional Carbohydrates Market Forecast (USD Billion), by Sub-Segment 3, 2018-2030
Figure 38: Latin America Refined Functional Carbohydrates Market Forecast (USD Billion), by Others, 2018-2030
Figure 39: Latin America Refined Functional Carbohydrates Market Value Share (%), By Segment 3, 2023 & 2030
Figure 40: Latin America Refined Functional Carbohydrates Market Forecast (USD Billion), by Sub-Segment 1, 2018-2030
Figure 41: Latin America Refined Functional Carbohydrates Market Forecast (USD Billion), by Sub-Segment 2, 2018-2030
Figure 42: Latin America Refined Functional Carbohydrates Market Forecast (USD Billion), by Sub-Segment 3, 2018-2030
Figure 43: Latin America Refined Functional Carbohydrates Market Forecast (USD Billion), by Others, 2018-2030
Figure 44: Latin America Refined Functional Carbohydrates Market Forecast (USD Billion), by Brazil, 2018-2030
Figure 45: Latin America Refined Functional Carbohydrates Market Forecast (USD Billion), by Mexico, 2018-2030
Figure 46: Latin America Refined Functional Carbohydrates Market Forecast (USD Billion), by Rest of Latin America, 2018-2030
Figure 47: Europe Refined Functional Carbohydrates Market Value Share (%), By Segment 1, 2023 & 2030
Figure 48: Europe Refined Functional Carbohydrates Market Forecast (USD Billion), by Sub-Segment 1, 2018-2030
Figure 49: Europe Refined Functional Carbohydrates Market Forecast (USD Billion), by Sub-Segment 2, 2018-2030
Figure 50: Europe Refined Functional Carbohydrates Market Value Share (%), By Segment 2, 2023 & 2030
Figure 51: Europe Refined Functional Carbohydrates Market Forecast (USD Billion), by Sub-Segment 1, 2018-2030
Figure 52: Europe Refined Functional Carbohydrates Market Forecast (USD Billion), by Sub-Segment 2, 2018-2030
Figure 53: Europe Refined Functional Carbohydrates Market Forecast (USD Billion), by Sub-Segment 3, 2018-2030
Figure 54: Europe Refined Functional Carbohydrates Market Forecast (USD Billion), by Others, 2018-2030
Figure 55: Europe Refined Functional Carbohydrates Market Value Share (%), By Segment 3, 2023 & 2030
Figure 56: Europe Refined Functional Carbohydrates Market Forecast (USD Billion), by Sub-Segment 1, 2018-2030
Figure 57: Europe Refined Functional Carbohydrates Market Forecast (USD Billion), by Sub-Segment 2, 2018-2030
Figure 58: Europe Refined Functional Carbohydrates Market Forecast (USD Billion), by Sub-Segment 3, 2018-2030
Figure 59: Europe Refined Functional Carbohydrates Market Forecast (USD Billion), by Others, 2018-2030
Figure 60: Europe Refined Functional Carbohydrates Market Forecast (USD Billion), by U.K., 2018-2030
Figure 61: Europe Refined Functional Carbohydrates Market Forecast (USD Billion), by Germany, 2018-2030
Figure 62: Europe Refined Functional Carbohydrates Market Forecast (USD Billion), by France, 2018-2030
Figure 63: Europe Refined Functional Carbohydrates Market Forecast (USD Billion), by Italy, 2018-2030
Figure 64: Europe Refined Functional Carbohydrates Market Forecast (USD Billion), by Spain, 2018-2030
Figure 65: Europe Refined Functional Carbohydrates Market Forecast (USD Billion), by Russia, 2018-2030
Figure 66: Europe Refined Functional Carbohydrates Market Forecast (USD Billion), by Rest of Europe, 2018-2030
Figure 67: Asia Pacific Refined Functional Carbohydrates Market Value Share (%), By Segment 1, 2023 & 2030
Figure 68: Asia Pacific Refined Functional Carbohydrates Market Forecast (USD Billion), by Sub-Segment 1, 2018-2030
Figure 69: Asia Pacific Refined Functional Carbohydrates Market Forecast (USD Billion), by Sub-Segment 2, 2018-2030
Figure 70: Asia Pacific Refined Functional Carbohydrates Market Value Share (%), By Segment 2, 2023 & 2030
Figure 71: Asia Pacific Refined Functional Carbohydrates Market Forecast (USD Billion), by Sub-Segment 1, 2018-2030
Figure 72: Asia Pacific Refined Functional Carbohydrates Market Forecast (USD Billion), by Sub-Segment 2, 2018-2030
Figure 73: Asia Pacific Refined Functional Carbohydrates Market Forecast (USD Billion), by Sub-Segment 3, 2018-2030
Figure 74: Asia Pacific Refined Functional Carbohydrates Market Forecast (USD Billion), by Others, 2018-2030
Figure 75: Asia Pacific Refined Functional Carbohydrates Market Value Share (%), By Segment 3, 2023 & 2030
Figure 76: Asia Pacific Refined Functional Carbohydrates Market Forecast (USD Billion), by Sub-Segment 1, 2018-2030
Figure 77: Asia Pacific Refined Functional Carbohydrates Market Forecast (USD Billion), by Sub-Segment 2, 2018-2030
Figure 78: Asia Pacific Refined Functional Carbohydrates Market Forecast (USD Billion), by Sub-Segment 3, 2018-2030
Figure 79: Asia Pacific Refined Functional Carbohydrates Market Forecast (USD Billion), by Others, 2018-2030
Figure 80: Asia Pacific Refined Functional Carbohydrates Market Forecast (USD Billion), by China, 2018-2030
Figure 81: Asia Pacific Refined Functional Carbohydrates Market Forecast (USD Billion), by India, 2018-2030
Figure 82: Asia Pacific Refined Functional Carbohydrates Market Forecast (USD Billion), by Japan, 2018-2030
Figure 83: Asia Pacific Refined Functional Carbohydrates Market Forecast (USD Billion), by Australia, 2018-2030
Figure 84: Asia Pacific Refined Functional Carbohydrates Market Forecast (USD Billion), by Southeast Asia, 2018-2030
Figure 85: Asia Pacific Refined Functional Carbohydrates Market Forecast (USD Billion), by Rest of Asia Pacific, 2018-2030
Figure 86: Middle East & Africa Refined Functional Carbohydrates Market Value Share (%), By Segment 1, 2023 & 2030
Figure 87: Middle East & Africa Refined Functional Carbohydrates Market Forecast (USD Billion), by Sub-Segment 1, 2018-2030
Figure 88: Middle East & Africa Refined Functional Carbohydrates Market Forecast (USD Billion), by Sub-Segment 2, 2018-2030
Figure 89: Middle East & Africa Refined Functional Carbohydrates Market Value Share (%), By Segment 2, 2023 & 2030
Figure 90: Middle East & Africa Refined Functional Carbohydrates Market Forecast (USD Billion), by Sub-Segment 1, 2018-2030
Figure 91: Middle East & Africa Refined Functional Carbohydrates Market Forecast (USD Billion), by Sub-Segment 2, 2018-2030
Figure 92: Middle East & Africa Refined Functional Carbohydrates Market Forecast (USD Billion), by Sub-Segment 3, 2018-2030
Figure 93: Middle East & Africa Refined Functional Carbohydrates Market Forecast (USD Billion), by Others, 2018-2030
Figure 94: Middle East & Africa Refined Functional Carbohydrates Market Value Share (%), By Segment 3, 2023 & 2030
Figure 95: Middle East & Africa Refined Functional Carbohydrates Market Forecast (USD Billion), by Sub-Segment 1, 2018-2030
Figure 96: Middle East & Africa Refined Functional Carbohydrates Market Forecast (USD Billion), by Sub-Segment 2, 2018-2030
Figure 97: Middle East & Africa Refined Functional Carbohydrates Market Forecast (USD Billion), by Sub-Segment 3, 2018-2030
Figure 98: Middle East & Africa Refined Functional Carbohydrates Market Forecast (USD Billion), by Others, 2018-2030
Figure 99: Middle East & Africa Refined Functional Carbohydrates Market Forecast (USD Billion), by GCC, 2018-2030
Figure 100: Middle East & Africa Refined Functional Carbohydrates Market Forecast (USD Billion), by South Africa, 2018-2030
Figure 101: Middle East & Africa Refined Functional Carbohydrates Market Forecast (USD Billion), by Rest of Middle East & Africa, 2018-2030
List of Tables
Table 1: Global Refined Functional Carbohydrates Market Revenue (USD Billion) Forecast, by Segment 1, 2018-2030
Table 2: Global Refined Functional Carbohydrates Market Revenue (USD Billion) Forecast, by Segment 2, 2018-2030
Table 3: Global Refined Functional Carbohydrates Market Revenue (USD Billion) Forecast, by Segment 3, 2018-2030
Table 4: Global Refined Functional Carbohydrates Market Revenue (USD Billion) Forecast, by Region, 2018-2030
Table 5: North America Refined Functional Carbohydrates Market Revenue (USD Billion) Forecast, by Segment 1, 2018-2030
Table 6: North America Refined Functional Carbohydrates Market Revenue (USD Billion) Forecast, by Segment 2, 2018-2030
Table 7: North America Refined Functional Carbohydrates Market Revenue (USD Billion) Forecast, by Segment 3, 2018-2030
Table 8: North America Refined Functional Carbohydrates Market Revenue (USD Billion) Forecast, by Country, 2018-2030
Table 9: Europe Refined Functional Carbohydrates Market Revenue (USD Billion) Forecast, by Segment 1, 2018-2030
Table 10: Europe Refined Functional Carbohydrates Market Revenue (USD Billion) Forecast, by Segment 2, 2018-2030
Table 11: Europe Refined Functional Carbohydrates Market Revenue (USD Billion) Forecast, by Segment 3, 2018-2030
Table 12: Europe Refined Functional Carbohydrates Market Revenue (USD Billion) Forecast, by Country, 2018-2030
Table 13: Latin America Refined Functional Carbohydrates Market Revenue (USD Billion) Forecast, by Segment 1, 2018-2030
Table 14: Latin America Refined Functional Carbohydrates Market Revenue (USD Billion) Forecast, by Segment 2, 2018-2030
Table 15: Latin America Refined Functional Carbohydrates Market Revenue (USD Billion) Forecast, by Segment 3, 2018-2030
Table 16: Latin America Refined Functional Carbohydrates Market Revenue (USD Billion) Forecast, by Country, 2018-2030
Table 17: Asia Pacific Refined Functional Carbohydrates Market Revenue (USD Billion) Forecast, by Segment 1, 2018-2030
Table 18: Asia Pacific Refined Functional Carbohydrates Market Revenue (USD Billion) Forecast, by Segment 2, 2018-2030
Table 19: Asia Pacific Refined Functional Carbohydrates Market Revenue (USD Billion) Forecast, by Segment 3, 2018-2030
Table 20: Asia Pacific Refined Functional Carbohydrates Market Revenue (USD Billion) Forecast, by Country, 2018-2030
Table 21: Middle East & Africa Refined Functional Carbohydrates Market Revenue (USD Billion) Forecast, by Segment 1, 2018-2030
Table 22: Middle East & Africa Refined Functional Carbohydrates Market Revenue (USD Billion) Forecast, by Segment 2, 2018-2030
Table 23: Middle East & Africa Refined Functional Carbohydrates Market Revenue (USD Billion) Forecast, by Segment 3, 2018-2030
Table 24: Middle East & Africa Refined Functional Carbohydrates Market Revenue (USD Billion) Forecast, by Country, 2018-2030
Research Process
Data Library Research are conducted by industry experts who offer insight on
industry structure, market segmentations technology assessment and competitive landscape (CL), and penetration, as well as on emerging trends. Their analysis is based on primary interviews (~ 80%) and secondary research (~ 20%) as well as years of professional expertise in their respective industries. Adding to this, by analysing historical trends and current market positions, our analysts predict where the market will be headed for the next five years. Furthermore, the varying trends of segment & categories geographically presented are also studied and the estimated based on the primary & secondary research.
In this particular report from the supply side Data Library Research has conducted primary surveys (interviews) with the key level executives (VP, CEO’s, Marketing Director, Business Development Manager
and SOFT) of the companies that active & prominent as well as the midsized organization
FIGURE 1: DLR RESEARH PROCESS
![research-methodology1]()
Primary Research
Extensive primary research was conducted to gain a deeper insight of the market and industry performance. The analysis is based on both primary and secondary research as well as years of professional expertise in the respective industries.
In addition to analysing current and historical trends, our analysts predict where the market is headed over the next five years.
It varies by segment for these categories geographically presented in the list of market tables. Speaking about this particular report we have conducted primary surveys (interviews) with the key level executives (VP, CEO’s, Marketing Director, Business Development Manager and many more) of the major players active in the market.
Secondary Research
Secondary research was mainly used to collect and identify information useful for the extensive, technical, market-oriented, and Friend’s study of the Global Extra Neutral Alcohol. It was also used to obtain key information about major players, market classification and segmentation according to the industry trends, geographical markets, and developments related to the market and technology perspectives. For this study, analysts have gathered information from various credible sources, such as annual reports, sec filings, journals, white papers, SOFT presentations, and company web sites.
Market Size Estimation
Both, top-down and bottom-up approaches were used to estimate and validate the size of the Global market and to estimate the size of various other dependent submarkets in the overall Extra Neutral Alcohol. The key players in the market were identified through secondary research and their market contributions in the respective geographies were determined through primary and secondary research.
Forecast Model
![research-methodology2]()