Robotics Virtual Commissioning Market Overview and Analysis:

  • The Robotics Virtual Commissioning Market, valued at an estimated $3.1 billion in 2025 and projected to grow at a Compound Annual Growth Rate (CAGR) of 14.98% from 2025 to 2032, is expected to reach approximately $8.25 billion by the year 2032.

Robotics Virtual Commissioning Market

Get Complete Analysis Of The Report - Download Free Sample PDF

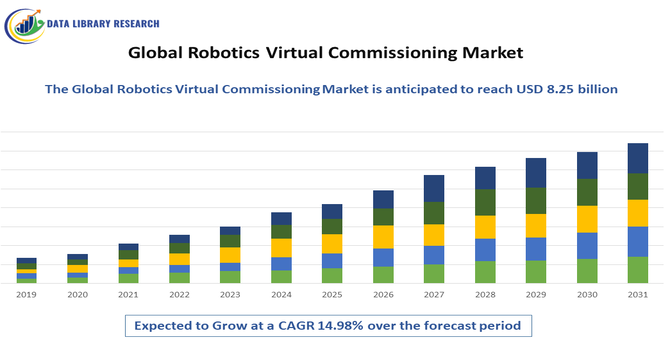
Robotics virtual commissioning is a process where engineers use a virtual simulation environment—called a digital twin—that perfectly mimics a real robot system and its factory surroundings. Instead of testing the actual physical robots on the production floor, they test and program the robots digitally using the real control software before anything is physically installed. This approach helps catch and fix problems early, allows engineers to optimize robot operations, and ensures everything works smoothly without stopping or disrupting ongoing production. It saves time, lowers costs, reduces risks, and improves safety by enabling testing and training in a virtual, controlled space before launching the real system.

Robotics Virtual Commissioning Market Latest Trends:

Robotics virtual commissioning is rapidly evolving with key trends shaping its future. One major trend is the increasing use of digital twins, which create detailed virtual models of robots, equipment, and entire production systems, allowing companies to test and validate complex setups before physical deployment. Artificial intelligence (AI) and machine learning are also being integrated to enhance simulation accuracy, analyze commissioning data, optimize robot performance, and help systems continuously improve from past experiences.

Additionally, the integration of 5G technology is enabling faster and more reliable data exchange between virtual simulations and real equipment, speeding up collaboration and reducing the time it takes to bring systems to market. These developments aim to minimize commissioning time and costs, reduce physical system debugging, and support wider adoption of automated systems globally. Cloud platforms and immersive technologies like AR/VR are also increasingly used for operator training and remote assistance, further boosting efficiency and safety in manufacturing environments.

Segmentation:

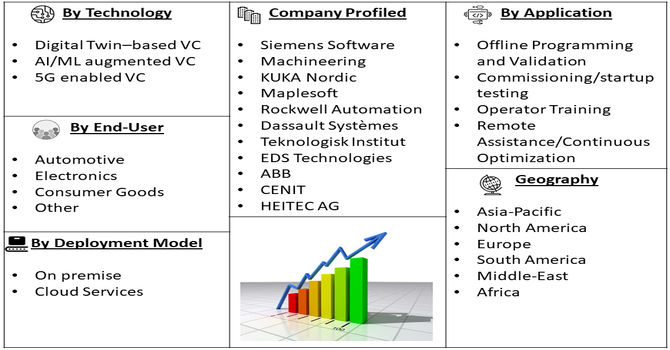
The Robotics virtual commissioning market segmented by Technology (Digital Twin–based VC, AI/ML augmented VC, and 5G enabled VC); Application (Offline Programming and Validation, Commissioning/startup testing, Operator Training, and Remote Assistance/Continuous Optimization); Deployment Model (On premise and Cloud Services); End User (Automotive, Electronics, Consumer Goods, and Other End Users); and Geography (North America, Europe, Asia-Pacific, and Rest of World).

Robotics Virtual Commissioning Market Segment

For Detailed Market Segmentation - Get a Free Sample PDF

Market Drivers:

  • Design Flexibility and Manufacturing Innovation

One key market driver for the Robotics Virtual Commissioning Market is the enhanced flexibility in design and implementation, which empowers manufacturers to innovate without the prohibitive costs and delays associated with traditional physical commissioning. By allowing teams to test and refine designs—such as optimizing gripping sequences to reduce cycle times, repositioning components for a smaller footprint, or improving access for maintenance—in a virtual environment, changes can be made quickly and affordably, leading to better performance, maintainability, and potential cost savings. This agility not only accelerates product development and minimizes risks but also fosters overall efficiency, making virtual commissioning an attractive solution for industries seeking competitive edges in a fast-evolving market, thereby boosting demand and driving market growth as companies prioritize these tools to streamline operations and enhance innovation.

  • Improved System Efficiency and Reliability

Another key driver for the adoption of Robotics Virtual Commissioning is its ability to improve system efficiency and reliability. By leveraging the virtual simulation environment, manufacturers can thoroughly test and validate their robotic systems before deploying them on the production floor. This allows them to identify and address potential issues or bottlenecks early on, without the risks and costs associated with debugging on the actual physical equipment.

Also, an article published in June 2025 in the Robotics and Computer-Integrated Manufacturing Journal reported that, researchers have developed a digital twin-driven system that enables accurate machining path prediction and error compensation through machine learning-enhanced models and consistency retention methods. These advancements in virtual commissioning significantly improve the contour accuracy of robotic machining, allowing manufacturers to thoroughly validate and optimize their processes in a digital environment. This is fueling the growth of the Robotics Virtual Commissioning market by helping unlock the full potential of robotic automation while minimizing errors and enhancing system efficiency and reliability.

Market Restraints:

  • High initial investment costs

An article published by Runpod in May 2025 highlighted that implementing RVC requires significant investment in software and hardware are slowing the growth of the robotics virtual commissioning market. Users need to carefully select GPU instances—while RVC tasks don’t require enormous VRAM like large language models, they still need at least 8–12 GB VRAM for smooth performance, ideally with modern GPUs such as NVIDIA RTX 4090, A6000, or L40S. Managing storage is also crucial; attaching a Network Volume with at least 40-60 GB is recommended to hold model files and save audio or data persistently. These technical requirements around GPU capacity, storage configuration, and setup complexity can create hurdles for users, increasing cost and deployment time, which collectively slow down broader adoption and market growth.

Social Economic Impact On Robotics Virtual Commissioning Market

The Robotics Virtual Commissioning market holds significant socioeconomic implications, as it enables manufacturers to enhance the efficiency, reliability, and cost-effectiveness of their automated production processes. By allowing for thorough testing and optimization of robotic systems in a virtual environment, this technology helps manufacturers reduce errors, minimize downtime, and improve the overall performance of their operations. This, in turn, can lead to increased productivity, lower manufacturing costs, and improved product quality, ultimately benefiting consumers through more affordable and reliable goods.

Additionally, the flexibility and agility afforded by Robotics Virtual Commissioning can spur manufacturing innovation, unlocking new design possibilities and driving the development of more advanced robotic solutions. This can strengthen the global competitiveness of manufacturers, create new job opportunities in the field of automation and simulation, and contribute to the overall economic growth and technological progress of societies worldwide.

Segmental Analysis

  • Digital Twin–based VC segment is expected to witness the highest growth over the forecast period

The Digital Twin–based Virtual Commissioning (VC) segment is a rapidly growing part of the overall virtual commissioning market, driven by its ability to create detailed, interactive virtual models of robotic and automated systems along with their production environments. This technology allows manufacturers to simulate, test, and optimize system performance before physical deployment, significantly reducing errors, commissioning time, and costs.

For instance, in a significant development, the Department of Technology (DoT) and the International Telecommunication Union (ITU) announced in February 2025 that they are joining forces to explore the potential of AI-driven digital twin technologies for future-ready infrastructure planning. This collaboration between the DoT and ITU is poised to fuel the growth of the digital twin-driven virtual commissioning segment within the broader Robotics Virtual Commissioning market. By combining the expertise of these two prominent organizations, the initiative will focus on leveraging advanced digital twin models and AI capabilities to optimize the planning, design, and integration of next-generation infrastructure, including robotics-enabled production systems.  

  • The Remote Assistance/Continuous Optimization Application segment is expected to witness the highest growth over the forecast period.

Remote Assistance and Continuous Optimization segment in the Robotics Virtual Commissioning market play crucial roles by enabling real-time monitoring, troubleshooting, and system improvements even after deployment, thus driving its growth. Remote assistance allows engineers and operators to access the virtual commissioning environment from anywhere to diagnose issues, make adjustments, and guide on-site staff without interrupting production, significantly reducing downtime and maintenance costs. Continuous optimization leverages data collected during operation to iteratively refine robot paths, control logic, and system integration, enhancing overall efficiency, reliability, and flexibility. Together, these applications improve productivity, facilitate faster problem-solving, and extend the lifecycle of automated systems while minimizing disruptions.

  • The Cloud Services Deployment segment is expected to witness highest growth over the forecast period

Cloud services play a critical role in the Robotics Virtual Commissioning (VC) market by providing scalable, flexible, and accessible computing resources needed for complex simulations and collaboration. Deploying virtual commissioning environments on the cloud allows manufacturers to run high-fidelity digital twin simulations without investing heavily in on-premises hardware, enabling faster processing of large datasets and real-time interaction with robotic systems.

Cloud platforms facilitate seamless integration of software tools, remote access for global teams, and continuous updates, reducing commissioning time and costs. Additionally, cloud deployment supports data storage, versioning, and backup, ensuring persistence and scalability as projects grow, which accelerates innovation and adoption across industries.

  • Automotive End User segment is expected to witness the highest growth over the forecast period

The automotive industry is a key end-user segment that is driving the growth of the Robotics Virtual Commissioning market. As automotive manufacturers strive to enhance their production efficiency, quality, and flexibility, the adoption of virtual commissioning technologies has become increasingly essential. By leveraging virtual commissioning, automotive companies can optimize the programming and integration of their robotic systems, ensuring seamless interactions and minimizing potential errors or conflicts on the production floor. This results in increased production uptime, reduced debugging time, and improved overall equipment effectiveness (OEE).

The automotive industry's reliance on advanced manufacturing technologies, combined with the need for continuous process improvements, positions Robotics Virtual Commissioning as a crucial enabler for maintaining a competitive edge. As automakers continue to invest in and adopt these virtual commissioning solutions, the demand from this end-user segment will continue to be a significant driver for the overall growth of the Robotics Virtual Commissioning market

  • North America Region is expected to witness highest growth over the forecast period

The presence of numerous tech-driven companies and high investment in AI and advanced technologies in North America is rapidly accelerating the adoption of Robotics Virtual Commissioning.

For instance, in February 2024, Looq AI launched its groundbreaking AI-enabled digital twin platform, which enables fast, cost-effective, and highly accurate 3D mapping of critical infrastructure using novel camera AI technology. This platform simplifies creating precise, geo-referenced digital twins at scale, enhancing asset intelligence and decision-making. Such advancements, combined with strong tech ecosystems and investment in AI-driven solutions in North American countries, are accelerating adoption and driving significant growth in digital twin–based virtual commissioning across industries.

Robotics Virtual Commissioning Market Table

To Learn More About This Report - Request a Free Sample Copy

Robotics Virtual Commissioning Market Competitive Landscape:

The Robotics Virtual Commissioning market features a competitive landscape characterized by the presence of both established industry players and innovative startups. Leading automation and simulation software providers, such as Siemens, Dassault Systèmes, and Rockwell Automation, offer comprehensive virtual commissioning solutions integrated with their broader manufacturing suites. These companies leverage their deep domain expertise and extensive customer bases to maintain a strong foothold in the market. Simultaneously, agile technology companies and specialized virtual commissioning vendors, including CENIT, Cybernetix, and Syque, are disrupting the market with novel AI-driven digital twin approaches, cloud-based deployments, and tailored solutions for specific industries like automotive and aerospace. The competitive dynamics are further intensified by the continuous advancements in hardware capabilities, sensor technologies, and data analytics, driving players to continuously innovate and differentiate their offerings to meet the evolving needs of manufacturers seeking to optimize their robotic systems through virtual commissioning.

The following companies are major players in the above market

  • Siemens Software
  • Machineering
  • KUKA Nordic
  • Maplesoft
  • Rockwell Automation
  • Dassault Systèmes
  • Teknologisk Institut
  • EDS Technologies
  • ABB
  • CENIT
  • HEITEC AG

Recent Developments:

  • In January 2025, Siemens presented its vision at CES 2025 for a future where data, artificial intelligence (AI), and software-defined automation converge to deliver unmatched flexibility, optimization, and ongoing improvement across industries of all sizes worldwide. Siemens’ integration of data, AI, and software-defined automation is accelerating the Robotics Virtual Commissioning market by enabling faster, more flexible, and highly optimized simulation and testing of robotic systems, which significantly reduces commissioning time and costs across industries.
  • In March 2025, Ericsson, Volvo Group in India, and Bharti Airtel have forged a pioneering research partnership to accelerate the adoption of Industry 4.0 and Industry 5.0 technologies in India. This collaborative endeavor will explore the transformative potential of Extended Reality (XR), Digital Twin solutions, and AI, all powered by the capabilities of 5G and 5G Advanced networks. The application of Extended Reality (XR), Digital Twin, and AI technologies in the Robotics Virtual Commissioning market enables enhanced real-time visualization, operator support, and remote interaction, allowing engineers to simulate, optimize, and troubleshoot complex robotic systems more intuitively and efficiently, thereby reducing commissioning time and improving safety in industrial automation environments.


Frequently Asked Questions (FAQ) :

Q1. What are the main growth-driving factors for this market?

The main growth driving factors for the Robotics Virtual Commissioning market include the increasing adoption of automation, the need for process optimization, and the growing emphasis on Industry 4.0 and Industry 5.0 technologies.

Q2. What are the main restraining factors for this market?

The main restraining factors for the Robotics Virtual Commissioning market include the high initial investment, the lack of skilled workforce, and the concerns over data security and privacy.

Q3. Which segment is expected to witness high growth?

The cloud-based deployment segment is expected to witness high growth in the Robotics Virtual Commissioning market due to the advantages of scalability, accessibility, and advanced analytics capabilities offered by cloud platforms.

Q4. Who are the top major players for this market?

The top major players in the Robotics Virtual Commissioning market include Siemens, Dassault Systèmes, Rockwell Automation, CENIT, Cybernetix, and Syque, among others, who are continuously innovating their offerings to meet the evolving needs of manufacturers.

Q5. Which country is the largest player?

The United States is the largest player in the Robotics Virtual Commissioning market, driven by the presence of a robust manufacturing sector, significant investment in advanced technologies, and the growing adoption of automation and digitalization across various industries.

Robotics Virtual Commissioning MARKET STUDY GLOBAL MARKET ANALYSIS, INSIGHTS AND FORECAST, 2022-2029

    1. Introduction

    • 1.1. Research Scope
    • 1.2. Market Segmentation
    • 1.3. Research Methodology
    • 1.4. Definitions and Assumptions

    2. Executive Summary

      3. Market Dynamics

      • 3.1. Market Drivers
      • 3.2. Market Restraints
      • 3.3. Market Opportunities

      4. Key Insights

      • 4.1. Key Emerging Trends – For Major Countries
      • 4.2. Latest Technological Advancement
      • 4.3. Regulatory Landscape
      • 4.4. Industry SWOT Analysis
      • 4.5. Porters Five Forces Analysis

      5. Global Robotics Virtual Commissioning Market Analysis (USD Billion), Insights and Forecast, 2018-2029

      • 5.1. Key Findings / Summary
      • 5.2. Market Analysis, Insights and Forecast – By Segment 1
        • 5.2.1. Sub-Segment 1
        • 5.2.2. Sub-Segment 2
      • 5.3. Market Analysis, Insights and Forecast – By Segment 2
        • 5.3.1. Sub-Segment 1
        • 5.3.2. Sub-Segment 2
        • 5.3.3. Sub-Segment 3
        • 5.3.4. Others
      • 5.4. Market Analysis, Insights and Forecast – By Segment 3
        • 5.4.1. Sub-Segment 1
        • 5.4.2. Sub-Segment 2
        • 5.4.3. Sub-Segment 3
        • 5.4.4. Others
      • 5.5. Market Analysis, Insights and Forecast – By Region
        • 5.5.1. North America
        • 5.5.2. Latin America
        • 5.5.3. Europe
        • 5.5.4. Asia Pacific
        • 5.5.5. Middle East and Africa

      6. North America Robotics Virtual Commissioning Market Analysis (USD Billion), Insights and Forecast, 2018-2029

      • 6.1. Key Findings / Summary
      • 6.2. Market Analysis, Insights and Forecast – By Segment 1
        • 6.2.1. Sub-Segment 1
        • 6.2.2. Sub-Segment 2
      • 6.3. Market Analysis, Insights and Forecast – By Segment 2
        • 6.3.1. Sub-Segment 1
        • 6.3.2. Sub-Segment 2
        • 6.3.3. Sub-Segment 3
        • 6.3.4. Others
      • 6.4. Market Analysis, Insights and Forecast – By Segment 3
        • 6.4.1. Sub-Segment 1
        • 6.4.2. Sub-Segment 2
        • 6.4.3. Sub-Segment 3
        • 6.4.4. Others
      • 6.5. Market Analysis, Insights and Forecast – By Country
        • 6.5.1. U.S.
        • 6.5.2. Canada

      7. Latin America Robotics Virtual Commissioning Market Analysis (USD Billion), Insights and Forecast, 2018-2029

      • 7.1. Key Findings / Summary
      • 7.2. Market Analysis, Insights and Forecast – By Segment 1
        • 7.2.1. Sub-Segment 1
        • 7.2.2. Sub-Segment 2
      • 7.3. Market Analysis, Insights and Forecast – By Segment 2
        • 7.3.1. Sub-Segment 1
        • 7.3.2. Sub-Segment 2
        • 7.3.3. Sub-Segment 3
        • 7.3.4. Others
      • 7.4. Market Analysis, Insights and Forecast – By Segment 3
        • 7.4.1. Sub-Segment 1
        • 7.4.2. Sub-Segment 2
        • 7.4.3. Sub-Segment 3
        • 7.4.4. Others
      • 7.5. Insights and Forecast – By Country
        • 7.5.1. Brazil
        • 7.5.2. Mexico
        • 7.5.3. Rest of Latin America

      8. Europe Robotics Virtual Commissioning Market Analysis (USD Billion), Insights and Forecast, 2018-2029

      • 8.1. Key Findings / Summary
      • 8.2. Market Analysis, Insights and Forecast – By Segment 1
        • 8.2.1. Sub-Segment 1
        • 8.2.2. Sub-Segment 2
      • 8.3. Market Analysis, Insights and Forecast – By Segment 2
        • 8.3.1. Sub-Segment 1
        • 8.3.2. Sub-Segment 2
        • 8.3.3. Sub-Segment 3
        • 8.3.4. Others
      • 8.4. Market Analysis, Insights and Forecast – By Segment 3
        • 8.4.1. Sub-Segment 1
        • 8.4.2. Sub-Segment 2
        • 8.4.3. Sub-Segment 3
        • 8.4.4. Others
      • 8.5. Market Analysis, Insights and Forecast – By Country
        • 8.5.1. UK
        • 8.5.2. Germany
        • 8.5.3. France
        • 8.5.4. Italy
        • 8.5.5. Spain
        • 8.5.6. Russia
        • 8.5.7. Rest of Europe

      9. Asia Pacific Robotics Virtual Commissioning Market Analysis (USD Billion), Insights and Forecast, 2018-2029

      • 9.1. Key Findings / Summary
      • 9.2. Market Analysis, Insights and Forecast – By Segment 1
        • 9.2.1. Sub-Segment 1
        • 9.2.2. Sub-Segment 2
      • 9.3. Market Analysis, Insights and Forecast – By Segment 2
        • 9.3.1. Sub-Segment 1
        • 9.3.2. Sub-Segment 2
        • 9.3.3. Sub-Segment 3
        • 9.3.4. Others
      • 9.4. Market Analysis, Insights and Forecast – By Segment 3
        • 9.4.1. Sub-Segment 1
        • 9.4.2. Sub-Segment 2
        • 9.4.3. Sub-Segment 3
        • 9.4.4. Others
      • 9.5. Market Analysis, Insights and Forecast – By Country
        • 9.5.1. China
        • 9.5.2. India
        • 9.5.3. Japan
        • 9.5.4. Australia
        • 9.5.5. South East Asia
        • 9.5.6. Rest of Asia Pacific

      10. Middle East & Africa Robotics Virtual Commissioning Market Analysis (USD Billion), Insights and Forecast, 2018-2029

      • 10.1. Key Findings / Summary
      • 10.2. Market Analysis, Insights and Forecast – By Segment 1
        • 10.2.1. Sub-Segment 1
        • 10.2.2. Sub-Segment 2
      • 10.3. Market Analysis, Insights and Forecast – By Segment 2
        • 10.3.1. Sub-Segment 1
        • 10.3.2. Sub-Segment 2
        • 10.3.3. Sub-Segment 3
        • 10.3.4. Others
      • 10.4. Market Analysis, Insights and Forecast – By Segment 3
        • 10.4.1. Sub-Segment 1
        • 10.4.2. Sub-Segment 2
        • 10.4.3. Sub-Segment 3
        • 10.4.4. Others
      • 10.5. Market Analysis, Insights and Forecast – By Country
        • 10.5.1. GCC
        • 10.5.2. South Africa
        • 10.5.3. Rest of Middle East & Africa

      11. Competitive Analysis

      • 11.1. Company Market Share Analysis, 2018
      • 11.2. Key Industry Developments
      • 11.3. Company Profile
        • 11.3.1. Company 1
          • 11.3.1.1. Business Overview
          • 11.3.1.2. Segment 1 & Service Offering
          • 11.3.1.3. Overall Revenue
          • 11.3.1.4. Geographic Presence
          • 11.3.1.5. Recent Development
        *Similar details will be provided for the following companies
        • 11.3.2. Company 2
        • 11.3.3. Company 3
        • 11.3.4. Company 4
        • 11.3.5. Company 5
        • 11.3.6. Company 6
        • 11.3.7. Company 7
        • 11.3.8. Company 8
        • 11.3.9. Company 9
        • 11.3.10. Company 10
        • 11.3.11. Company 11
        • 11.3.12. Company 12
      List of Figures

      Figure 1: Global Robotics Virtual Commissioning Market Revenue Breakdown (USD Billion, %) by Region, 2022 & 2029
      Figure 2: Global Robotics Virtual Commissioning Market Value Share (%), By Segment 1, 2022 & 2029
      Figure 3: Global Robotics Virtual Commissioning Market Forecast (USD Billion), by Sub-Segment 1, 2018-2029
      Figure 4: Global Robotics Virtual Commissioning Market Forecast (USD Billion), by Sub-Segment 2, 2018-2029
      Figure 5: Global Robotics Virtual Commissioning Market Value Share (%), By Segment 2, 2022 & 2029
      Figure 6: Global Robotics Virtual Commissioning Market Forecast (USD Billion), by Sub-Segment 1, 2018-2029
      Figure 7: Global Robotics Virtual Commissioning Market Forecast (USD Billion), by Sub-Segment 2, 2018-2029
      Figure 8: Global Robotics Virtual Commissioning Market Forecast (USD Billion), by Sub-Segment 3, 2018-2029
      Figure 9: Global Robotics Virtual Commissioning Market Forecast (USD Billion), by Others, 2018-2029
      Figure 10: Global Robotics Virtual Commissioning Market Value Share (%), By Segment 3, 2022 & 2029
      Figure 11: Global Robotics Virtual Commissioning Market Forecast (USD Billion), by Sub-Segment 1, 2018-2029
      Figure 12: Global Robotics Virtual Commissioning Market Forecast (USD Billion), by Sub-Segment 2, 2018-2029
      Figure 13: Global Robotics Virtual Commissioning Market Forecast (USD Billion), by Sub-Segment 3, 2018-2029
      Figure 14: Global Robotics Virtual Commissioning Market Forecast (USD Billion), by Others, 2018-2029
      Figure 15: Global Robotics Virtual Commissioning Market Value (USD Billion), by Region, 2022 & 2029
      Figure 16: North America Robotics Virtual Commissioning Market Value Share (%), By Segment 1, 2022 & 2029
      Figure 17: North America Robotics Virtual Commissioning Market Forecast (USD Billion), by Sub-Segment 1, 2018-2029
      Figure 18: North America Robotics Virtual Commissioning Market Forecast (USD Billion), by Sub-Segment 2, 2018-2029
      Figure 19: North America Robotics Virtual Commissioning Market Value Share (%), By Segment 2, 2022 & 2029
      Figure 20: North America Robotics Virtual Commissioning Market Forecast (USD Billion), by Sub-Segment 1, 2018-2029
      Figure 21: North America Robotics Virtual Commissioning Market Forecast (USD Billion), by Sub-Segment 2, 2018-2029
      Figure 22: North America Robotics Virtual Commissioning Market Forecast (USD Billion), by Sub-Segment 3, 2018-2029
      Figure 23: North America Robotics Virtual Commissioning Market Forecast (USD Billion), by Others, 2018-2029
      Figure 24: North America Robotics Virtual Commissioning Market Value Share (%), By Segment 3, 2022 & 2029
      Figure 25: North America Robotics Virtual Commissioning Market Forecast (USD Billion), by Sub-Segment 1, 2018-2029
      Figure 26: North America Robotics Virtual Commissioning Market Forecast (USD Billion), by Sub-Segment 2, 2018-2029
      Figure 27: North America Robotics Virtual Commissioning Market Forecast (USD Billion), by Sub-Segment 3, 2018-2029
      Figure 28: North America Robotics Virtual Commissioning Market Forecast (USD Billion), by Others, 2018-2029
      Figure 29: North America Robotics Virtual Commissioning Market Forecast (USD Billion), by U.S., 2018-2029
      Figure 30: North America Robotics Virtual Commissioning Market Forecast (USD Billion), by Canada, 2018-2029
      Figure 31: Latin America Robotics Virtual Commissioning Market Value Share (%), By Segment 1, 2022 & 2029
      Figure 32: Latin America Robotics Virtual Commissioning Market Forecast (USD Billion), by Sub-Segment 1, 2018-2029
      Figure 33: Latin America Robotics Virtual Commissioning Market Forecast (USD Billion), by Sub-Segment 2, 2018-2029
      Figure 34: Latin America Robotics Virtual Commissioning Market Value Share (%), By Segment 2, 2022 & 2029
      Figure 35: Latin America Robotics Virtual Commissioning Market Forecast (USD Billion), by Sub-Segment 1, 2018-2029
      Figure 36: Latin America Robotics Virtual Commissioning Market Forecast (USD Billion), by Sub-Segment 2, 2018-2029
      Figure 37: Latin America Robotics Virtual Commissioning Market Forecast (USD Billion), by Sub-Segment 3, 2018-2029
      Figure 38: Latin America Robotics Virtual Commissioning Market Forecast (USD Billion), by Others, 2018-2029
      Figure 39: Latin America Robotics Virtual Commissioning Market Value Share (%), By Segment 3, 2022 & 2029
      Figure 40: Latin America Robotics Virtual Commissioning Market Forecast (USD Billion), by Sub-Segment 1, 2018-2029
      Figure 41: Latin America Robotics Virtual Commissioning Market Forecast (USD Billion), by Sub-Segment 2, 2018-2029
      Figure 42: Latin America Robotics Virtual Commissioning Market Forecast (USD Billion), by Sub-Segment 3, 2018-2029
      Figure 43: Latin America Robotics Virtual Commissioning Market Forecast (USD Billion), by Others, 2018-2029
      Figure 44: Latin America Robotics Virtual Commissioning Market Forecast (USD Billion), by Brazil, 2018-2029
      Figure 45: Latin America Robotics Virtual Commissioning Market Forecast (USD Billion), by Mexico, 2018-2029
      Figure 46: Latin America Robotics Virtual Commissioning Market Forecast (USD Billion), by Rest of Latin America, 2018-2029
      Figure 47: Europe Robotics Virtual Commissioning Market Value Share (%), By Segment 1, 2022 & 2029
      Figure 48: Europe Robotics Virtual Commissioning Market Forecast (USD Billion), by Sub-Segment 1, 2018-2029
      Figure 49: Europe Robotics Virtual Commissioning Market Forecast (USD Billion), by Sub-Segment 2, 2018-2029
      Figure 50: Europe Robotics Virtual Commissioning Market Value Share (%), By Segment 2, 2022 & 2029
      Figure 51: Europe Robotics Virtual Commissioning Market Forecast (USD Billion), by Sub-Segment 1, 2018-2029
      Figure 52: Europe Robotics Virtual Commissioning Market Forecast (USD Billion), by Sub-Segment 2, 2018-2029
      Figure 53: Europe Robotics Virtual Commissioning Market Forecast (USD Billion), by Sub-Segment 3, 2018-2029
      Figure 54: Europe Robotics Virtual Commissioning Market Forecast (USD Billion), by Others, 2018-2029
      Figure 55: Europe Robotics Virtual Commissioning Market Value Share (%), By Segment 3, 2022 & 2029
      Figure 56: Europe Robotics Virtual Commissioning Market Forecast (USD Billion), by Sub-Segment 1, 2018-2029
      Figure 57: Europe Robotics Virtual Commissioning Market Forecast (USD Billion), by Sub-Segment 2, 2018-2029
      Figure 58: Europe Robotics Virtual Commissioning Market Forecast (USD Billion), by Sub-Segment 3, 2018-2029
      Figure 59: Europe Robotics Virtual Commissioning Market Forecast (USD Billion), by Others, 2018-2029
      Figure 60: Europe Robotics Virtual Commissioning Market Forecast (USD Billion), by U.K., 2018-2029
      Figure 61: Europe Robotics Virtual Commissioning Market Forecast (USD Billion), by Germany, 2018-2029
      Figure 62: Europe Robotics Virtual Commissioning Market Forecast (USD Billion), by France, 2018-2029
      Figure 63: Europe Robotics Virtual Commissioning Market Forecast (USD Billion), by Italy, 2018-2029
      Figure 64: Europe Robotics Virtual Commissioning Market Forecast (USD Billion), by Spain, 2018-2029
      Figure 65: Europe Robotics Virtual Commissioning Market Forecast (USD Billion), by Russia, 2018-2029
      Figure 66: Europe Robotics Virtual Commissioning Market Forecast (USD Billion), by Rest of Europe, 2018-2029
      Figure 67: Asia Pacific Robotics Virtual Commissioning Market Value Share (%), By Segment 1, 2022 & 2029
      Figure 68: Asia Pacific Robotics Virtual Commissioning Market Forecast (USD Billion), by Sub-Segment 1, 2018-2029
      Figure 69: Asia Pacific Robotics Virtual Commissioning Market Forecast (USD Billion), by Sub-Segment 2, 2018-2029
      Figure 70: Asia Pacific Robotics Virtual Commissioning Market Value Share (%), By Segment 2, 2022 & 2029
      Figure 71: Asia Pacific Robotics Virtual Commissioning Market Forecast (USD Billion), by Sub-Segment 1, 2018-2029
      Figure 72: Asia Pacific Robotics Virtual Commissioning Market Forecast (USD Billion), by Sub-Segment 2, 2018-2029
      Figure 73: Asia Pacific Robotics Virtual Commissioning Market Forecast (USD Billion), by Sub-Segment 3, 2018-2029
      Figure 74: Asia Pacific Robotics Virtual Commissioning Market Forecast (USD Billion), by Others, 2018-2029
      Figure 75: Asia Pacific Robotics Virtual Commissioning Market Value Share (%), By Segment 3, 2022 & 2029
      Figure 76: Asia Pacific Robotics Virtual Commissioning Market Forecast (USD Billion), by Sub-Segment 1, 2018-2029
      Figure 77: Asia Pacific Robotics Virtual Commissioning Market Forecast (USD Billion), by Sub-Segment 2, 2018-2029
      Figure 78: Asia Pacific Robotics Virtual Commissioning Market Forecast (USD Billion), by Sub-Segment 3, 2018-2029
      Figure 79: Asia Pacific Robotics Virtual Commissioning Market Forecast (USD Billion), by Others, 2018-2029
      Figure 80: Asia Pacific Robotics Virtual Commissioning Market Forecast (USD Billion), by China, 2018-2029
      Figure 81: Asia Pacific Robotics Virtual Commissioning Market Forecast (USD Billion), by India, 2018-2029
      Figure 82: Asia Pacific Robotics Virtual Commissioning Market Forecast (USD Billion), by Japan, 2018-2029
      Figure 83: Asia Pacific Robotics Virtual Commissioning Market Forecast (USD Billion), by Australia, 2018-2029
      Figure 84: Asia Pacific Robotics Virtual Commissioning Market Forecast (USD Billion), by Southeast Asia, 2018-2029
      Figure 85: Asia Pacific Robotics Virtual Commissioning Market Forecast (USD Billion), by Rest of Asia Pacific, 2018-2029
      Figure 86: Middle East & Africa Robotics Virtual Commissioning Market Value Share (%), By Segment 1, 2022 & 2029
      Figure 87: Middle East & Africa Robotics Virtual Commissioning Market Forecast (USD Billion), by Sub-Segment 1, 2018-2029
      Figure 88: Middle East & Africa Robotics Virtual Commissioning Market Forecast (USD Billion), by Sub-Segment 2, 2018-2029
      Figure 89: Middle East & Africa Robotics Virtual Commissioning Market Value Share (%), By Segment 2, 2022 & 2029
      Figure 90: Middle East & Africa Robotics Virtual Commissioning Market Forecast (USD Billion), by Sub-Segment 1, 2018-2029
      Figure 91: Middle East & Africa Robotics Virtual Commissioning Market Forecast (USD Billion), by Sub-Segment 2, 2018-2029
      Figure 92: Middle East & Africa Robotics Virtual Commissioning Market Forecast (USD Billion), by Sub-Segment 3, 2018-2029
      Figure 93: Middle East & Africa Robotics Virtual Commissioning Market Forecast (USD Billion), by Others, 2018-2029
      Figure 94: Middle East & Africa Robotics Virtual Commissioning Market Value Share (%), By Segment 3, 2022 & 2029
      Figure 95: Middle East & Africa Robotics Virtual Commissioning Market Forecast (USD Billion), by Sub-Segment 1, 2018-2029
      Figure 96: Middle East & Africa Robotics Virtual Commissioning Market Forecast (USD Billion), by Sub-Segment 2, 2018-2029
      Figure 97: Middle East & Africa Robotics Virtual Commissioning Market Forecast (USD Billion), by Sub-Segment 3, 2018-2029
      Figure 98: Middle East & Africa Robotics Virtual Commissioning Market Forecast (USD Billion), by Others, 2018-2029
      Figure 99: Middle East & Africa Robotics Virtual Commissioning Market Forecast (USD Billion), by GCC, 2018-2029
      Figure 100: Middle East & Africa Robotics Virtual Commissioning Market Forecast (USD Billion), by South Africa, 2018-2029
      Figure 101: Middle East & Africa Robotics Virtual Commissioning Market Forecast (USD Billion), by Rest of Middle East & Africa, 2018-2029 
      List of Tables
      Table 1: Global Robotics Virtual Commissioning Market Revenue (USD Billion) Forecast, by Segment 1, 2018-2029
      Table 2: Global Robotics Virtual Commissioning Market Revenue (USD Billion) Forecast, by Segment 2, 2018-2029
      Table 3: Global Robotics Virtual Commissioning Market Revenue (USD Billion) Forecast, by Segment 3, 2018-2029
      Table 4: Global Robotics Virtual Commissioning Market Revenue (USD Billion) Forecast, by Region, 2018-2029
      Table 5: North America Robotics Virtual Commissioning Market Revenue (USD Billion) Forecast, by Segment 1, 2018-2029
      Table 6: North America Robotics Virtual Commissioning Market Revenue (USD Billion) Forecast, by Segment 2, 2018-2029
      Table 7: North America Robotics Virtual Commissioning Market Revenue (USD Billion) Forecast, by Segment 3, 2018-2029
      Table 8: North America Robotics Virtual Commissioning Market Revenue (USD Billion) Forecast, by Country, 2018-2029
      Table 9: Europe Robotics Virtual Commissioning Market Revenue (USD Billion) Forecast, by Segment 1, 2018-2029
      Table 10: Europe Robotics Virtual Commissioning Market Revenue (USD Billion) Forecast, by Segment 2, 2018-2029
      Table 11: Europe Robotics Virtual Commissioning Market Revenue (USD Billion) Forecast, by Segment 3, 2018-2029
      Table 12: Europe Robotics Virtual Commissioning Market Revenue (USD Billion) Forecast, by Country, 2018-2029
      Table 13: Latin America Robotics Virtual Commissioning Market Revenue (USD Billion) Forecast, by Segment 1, 2018-2029
      Table 14: Latin America Robotics Virtual Commissioning Market Revenue (USD Billion) Forecast, by Segment 2, 2018-2029
      Table 15: Latin America Robotics Virtual Commissioning Market Revenue (USD Billion) Forecast, by Segment 3, 2018-2029
      Table 16: Latin America Robotics Virtual Commissioning Market Revenue (USD Billion) Forecast, by Country, 2018-2029
      Table 17: Asia Pacific Robotics Virtual Commissioning Market Revenue (USD Billion) Forecast, by Segment 1, 2018-2029
      Table 18: Asia Pacific Robotics Virtual Commissioning Market Revenue (USD Billion) Forecast, by Segment 2, 2018-2029
      Table 19: Asia Pacific Robotics Virtual Commissioning Market Revenue (USD Billion) Forecast, by Segment 3, 2018-2029
      Table 20: Asia Pacific Robotics Virtual Commissioning Market Revenue (USD Billion) Forecast, by Country, 2018-2029
      Table 21: Middle East & Africa Robotics Virtual Commissioning Market Revenue (USD Billion) Forecast, by Segment 1, 2018-2029
      Table 22: Middle East & Africa Robotics Virtual Commissioning Market Revenue (USD Billion) Forecast, by Segment 2, 2018-2029
      Table 23: Middle East & Africa Robotics Virtual Commissioning Market Revenue (USD Billion) Forecast, by Segment 3, 2018-2029
      Table 24: Middle East & Africa Robotics Virtual Commissioning Market Revenue (USD Billion) Forecast, by Country, 2018-2029
      Research Process

      Data Library Research are conducted by industry experts who offer insight on industry structure, market segmentations technology assessment and competitive landscape (CL), and penetration, as well as on emerging trends. Their analysis is based on primary interviews (~ 80%) and secondary research (~ 20%) as well as years of professional expertise in their respective industries. Adding to this, by analysing historical trends and current market positions, our analysts predict where the market will be headed for the next five years. Furthermore, the varying trends of segment & categories geographically presented are also studied and the estimated based on the primary & secondary research.

      In this particular report from the supply side Data Library Research has conducted primary surveys (interviews) with the key level executives (VP, CEO’s, Marketing Director, Business Development Manager and SOFT) of the companies that active & prominent as well as the midsized organization

      FIGURE 1: DLR RESEARH PROCESS

      research-methodology1

      Primary Research

      Extensive primary research was conducted to gain a deeper insight of the market and industry performance. The analysis is based on both primary and secondary research as well as years of professional expertise in the respective industries.

      In addition to analysing current and historical trends, our analysts predict where the market is headed over the next five years.

      It varies by segment for these categories geographically presented in the list of market tables. Speaking about this particular report we have conducted primary surveys (interviews) with the key level executives (VP, CEO’s, Marketing Director, Business Development Manager and many more) of the major players active in the market.

      Secondary Research

      Secondary research was mainly used to collect and identify information useful for the extensive, technical, market-oriented, and Friend’s study of the Global Extra Neutral Alcohol. It was also used to obtain key information about major players, market classification and segmentation according to the industry trends, geographical markets, and developments related to the market and technology perspectives. For this study, analysts have gathered information from various credible sources, such as annual reports, sec filings, journals, white papers, SOFT presentations, and company web sites.

      Market Size Estimation

      Both, top-down and bottom-up approaches were used to estimate and validate the size of the Global market and to estimate the size of various other dependent submarkets in the overall Extra Neutral Alcohol. The key players in the market were identified through secondary research and their market contributions in the respective geographies were determined through primary and secondary research.

      Forecast Model

      research-methodology2

      Happy to Assist You

      If you have a question?

      info@datalibraryresearch.com

      IND : +91 955 279 0357

      Browse Related Reports