Smart Security ICs Market Overview and Analysis

The global industrial control systems security market size was valued at USD 18.99 billion in 2023 and is projected to reach USD 32.88 billion by 2030.

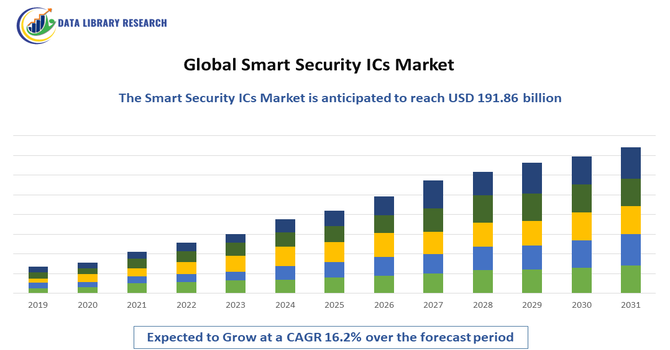
The Global Smart Security ICs Market refers to the global market for integrated circuits specifically designed to deliver hardware based security functions—such as encryption, secure boot, tamper resistance, authentication, and secure key storage—in devices and systems. These ICs target applications across IoT, payment systems, automotive, identity management and industrial controls. Their adoption is driven by growing cybersecurity threats, proliferation of connected devices and stringent regulatory demands.

The Global Smart Security IC market growth is being propelled by several key factors. First, the surge in connected devices across the Internet of Things (IoT) and increasing cyber threats are prompting demand for embedded hardware security solutions to protect data and device integrity. Second, rising adoption of contactless payment systems, biometric authentication and digital identity programs by governments and enterprises is driving the need for secure ICs capable of encryption and tamper resistance. Together, these trends are creating robust tailwinds for the secure IC industry worldwide.

Smart Security ICs Market Latest Trends

The Global Smart Security ICs market, one prominent trend is the embedding of advanced features like hardware based encryption, tamper resistance and biometric authentication directly into connected devices and endpoints. As the number of IoT devices rapidly increases, manufacturers are incorporating these security ICs to meet heightened demands for device integrity, trusted access and data protection. At the same time, there is growing convergence of consumer and infrastructure security needs—from smart homes to industrial systems—prompting more integrated security hardware solutions and elevating the importance of secure ICs in next generation electronics.

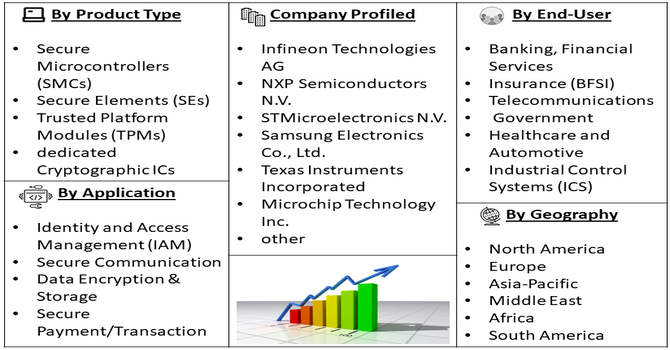
Segmentation: The Global Smart Security ICs Market is segmented by Product Type (Secure Microcontrollers (SMCs), Secure Elements (SEs), Trusted Platform Modules (TPMs) and dedicated Cryptographic ICs), Application (Identity and Access Management (IAM), Secure Communication, Data Encryption & Storage and Secure Payment/Transaction), End User (Banking, Financial Services, and Insurance (BFSI) , Telecommunications, Government and Healthcare and Automotive & Industrial Control Systems (ICS)) and Geography (North America, Europe, Asia-Pacific, Middle East and Africa, and South America). The report provides the value (in USD million) for the above segments.

Market Drivers:

  • Surge in IoT Device Proliferation

The rapid growth in connected devices across consumer, industrial and infrastructure segments has dramatically heightened demand for smart security ICs. As IoT ecosystems expand—from smart homes and wearables to automotive systems and smart cities—embedded hardware security becomes essential to protect sensitive data and prevent unauthorized access. This trend is fuelling investment in ICs that incorporate encryption, authentication and tamper resistance, driving solid growth in the smart security ICs market.

In March 2025, the publication of TXOne Networks’ 2024 OT/ICS Cybersecurity Report detailed serious risks such as supply chain vulnerabilities, aging infrastructure and patching difficulties in connected industrial systems. This spotlight on the vulnerability of countless smart sensors and edge computing devices underscored how the surge in IoT device proliferation demands stronger hardware security. As a result, the global smart security ICs market gained momentum, with organizations accelerating adoption of secure chip solutions to protect devices and data across sprawling IoT and industrial ecosystems.

  • Expansion of Digital Transactions and Identity Systems

The global shift toward digital payment systems, government identity programs and contactless interactions has created a strong need for hardware based security solutions. Smart security ICs, which can provide secure key storage, secure boot, and device authentication, are critical in safeguarding financial and identity related data. As organisations adopt mobile payments, e IDs and biometric authentication, the demand for these secure chips rises, reinforcing growth across the market.

Market Restraint:

  • High Costs and Integration Complexity

Despite the upward trajectory, the smart security ICs market is constrained by significant barriers such as high development and manufacturing costs, as well as integration challenges. Advanced security features demand specialized fabrication, rigorous certification and compatibility with diverse legacy systems—factors that increase cost and delay deployments. In price sensitive regions especially, these financial and technical hurdles slow the adoption of smart security ICs and restrict the pace of market expansion.

Socio Economic Impact on Smart Security ICs Market

Smart security ICs are playing a key role in enhancing societal trust in digital and connected systems by enabling safer smart homes, secure payment mechanisms and protected identity credentials. With billions of devices now connected, the presence of embedded hardware security chips reduces risk of data breaches and unauthorized access, reinforcing public confidence in digital services. Moreover, deployment of these chips in infrastructure, consumer products and identity systems helps support economic productivity and privacy protection. However, it also raises concerns about equitable access to secure technology in emerging markets and highlights the need for inclusive cybersecurity initiatives.

Segmental Analysis:

  • Trusted Platform Modules (TPMs) Segment is Expected to Witness Significant Growth Over the Forecast Period

The TPM segment is projected to see robust expansion as demand for hardware based root of trust solutions increases across consumer, enterprise and industrial devices. TPMs enable secure boot, cryptographic key storage and platform integrity verification—capabilities that are increasingly essential in IoT, computing systems and connected devices. Growth is further supported by stringent cybersecurity regulations and rising cyber threat exposure, driving organizations to adopt TPMs as foundational security hardware. This makes the TPM segment one of the fastest growing within the smart security ICs market.

  • Identity and Access Management (IAMSegment is Expected to Witness Significant Growth Over the Forecast Period

The IAM segment is set for significant growth as organizations globally focus on securely managing identities, access rights and authentication across systems and devices. As digital transformation accelerates, demand for IAM solutions rises—prompting integration of smart security ICs to enable hardware backed authentication, biometric verification and secure privileged access. With the surge in cloud adoption, remote work and zero trust frameworks, IAM becomes a critical layer of defence, elevating the role of embedded security chips and accelerating growth in this segment.

  • Automotive & Industrial Control Systems (ICS) Segment is Expected to Witness Significant Growth Over the Forecast Period

The automotive and industrial control systems (ICS) segment is forecasted to grow strongly as vehicles, manufacturing and utility systems become increasingly connected and automated. These environments demand robust, tamper resistant security hardware like smart security ICs to protect against firmware exploitation, unauthorized access, and cyber threats. With the rise of connected vehicles, autonomous platforms and smart factories, the need for embedded device level security intensifies—making the automotive & ICS segment a key growth driver for the smart security ICs market.

  • North America Region is Expected to Witness Significant Growth Over the Forecast Period

The North America region is projected to experience strong growth in the smart security ICs market owing to its mature cybersecurity infrastructure, high device penetration and proactive regulatory landscape. With enterprises and governments prioritizing hardware based security, adoption of secure ICs is accelerating across sectors like finance, healthcare, government and industrial.

Advanced device manufacturing and innovation hubs further support growth momentum, positioning North America as a leading region for smart security IC deployment. For instance, in May 2025, SEALSQ Corp announced it would acquire 100 % of Grenoble based ASIC design specialist IC’ALPS SAS. This strategic acquisition strengthened SEALSQ’s corporate footprint and technological capabilities, enabling a faster rollout of post quantum and secure hardware solutions. For the North American smart security ICs market, it meant heightened competition, accelerated innovation cycles and more advanced, differentiated secure chip offerings accessible in the region—ultimately enhancing the availability of next generation hardware security in North American systems.

Similarly, in October 2025, Censys released a new ICS/OT Internet intelligence offering designed to close the visibility gap defenders faced in securing exposed industrial assets. This launch heightened awareness of risks in industrial control systems using insecure ICs, prompting stronger demand for secure, hardware based protections. As organizations in energy, manufacturing and utilities sought to safeguard exposed systems, the smart security ICs market in North America benefited—accelerating adoption of advanced security chip solutions embedded in critical infrastructure.

Smart Security ICs Market Competitive Analysis:

The competitive landscape of the smart security ICs market is characterized by large multinational semiconductor firms and growing specialist players. Established companies with deep R&D capacity are pushing next generation secure hardware features, while a wave of smaller firms is creating niche solutions targeting IoT endpoints and vertical specific applications. Competition is intensifying on multiple fronts—including design innovation, certification compliance and ecosystem partnerships—which is forcing players to refine strategies around silicon integration, software support and system level security offerings.

Recent Development

  • In May 2025, Siemens Digital Industries Software announced the launch of its Questa One smart verification software portfolio, which combined connectivity, data driven workflows and AI to overhaul the integrated circuit (IC) verification process. This development marked a key enabler for the smart security ICs industry by accelerating verification of highly complex designs—such as 3D ICs and chiplet based systems—used in security hardware. Faster, more reliable verification means manufacturers can bring secure ICs to market more rapidly, support advanced security features and respond to growing demand for hardware root of trust solutions in IoT, identity and industrial applications.


  • In March 2025, STMicroelectronics introduced its STM32U3 microcontrollers, which featured ultra low power consumption, near threshold chip design, factory provisioned secret key protection and robust hardware security for IoT and remote applications. The launch of the STM32U3 series significantly strengthened the smart security ICs market by delivering next generation hardware security capabilities and energy efficient operation that align with the growing demand for secure, connected edge devices. It enabled chip manufacturers and IoT designers to incorporate secure roots of trust in low power applications, accelerating adoption of secure ICs across identity, IoT and industrial domains.


Frequently Asked Questions (FAQ) :

Q1. What the main growth driving factors for this market?

The main growth driver is the explosive proliferation of connected devices like IoT, smartphones, and autonomous vehicles, all of which demand strong, hardware-level data protection. The increasing frequency and sophistication of cyberattacks targeting both financial transactions and critical infrastructure compel industries to adopt robust security measures. Furthermore, the global shift towards digital payment systems (contactless cards and mobile payments) and stricter regulatory compliance requirements, which mandate secure data handling, are accelerating the integration of Smart Security ICs to prevent fraud and maintain public trust.

Q2. What are the main restraining factors for this market?

The primary restraining factor is the high cost associated with implementing and integrating advanced security ICs, especially for Small and Medium-sized Enterprises (SMEs) or in devices where cost optimization is critical. These sophisticated chips require specialized design and robust testing, which drives up production costs. Additionally, the challenge of securing legacy systems in industrial control and critical infrastructure environments is a major hurdle. Integrating modern security ICs with these older platforms is often complex and disruptive, posing compatibility issues and potential system downtime.

Q3. Which segment is expected to witness high growth?

The Automotive and Industrial Control Systems (ICS) segment is expected to witness the highest growth. This is due to the convergence of IT and Operational Technology (OT) and the rapid adoption of connected features in vehicles (V2X communication) and factories (Industry 4.0). Security ICs are crucial here to protect critical functions, such as engine control units and industrial robots, from cyberattacks, making them a compulsory investment driven by rising cyber threats and increasingly stringent government cybersecurity regulations for critical infrastructure.

Q4. Who are the top major players for this market?

The Global Smart Security ICs Market is dominated by major semiconductor and technology companies. Top players include European specialists like Infineon Technologies and STMicroelectronics, who are well-known for their secure microcontroller and smart card ICs used widely in payment and identity applications. Other significant players providing embedded security solutions across various applications are NXP Semiconductors, Microchip Technology, and Samsung Semiconductor, all of whom continuously innovate to address the security needs of IoT and automotive systems.

Q5. Which country is the largest player?

North America, particularly the United States, holds the largest market share in terms of revenue and demand for high-end Smart Security ICs. This is driven by its large, highly regulated financial and defense sectors, significant investment in automotive electronics, and a powerful IT and cybersecurity infrastructure. However, the Asia-Pacific (APAC) region, led by countries like China and South Korea, is the fastest-growing market, fueled by massive government-led initiatives for smart city development and world-leading production volumes of IoT devices and consumer electronics.

Smart Security ICs MARKET STUDY GLOBAL MARKET ANALYSIS, INSIGHTS AND FORECAST, 2022-2029

    1. Introduction

    • 1.1. Research Scope
    • 1.2. Market Segmentation
    • 1.3. Research Methodology
    • 1.4. Definitions and Assumptions

    2. Executive Summary

      3. Market Dynamics

      • 3.1. Market Drivers
      • 3.2. Market Restraints
      • 3.3. Market Opportunities

      4. Key Insights

      • 4.1. Key Emerging Trends – For Major Countries
      • 4.2. Latest Technological Advancement
      • 4.3. Regulatory Landscape
      • 4.4. Industry SWOT Analysis
      • 4.5. Porters Five Forces Analysis

      5. Global Smart Security ICs Market Analysis (USD Billion), Insights and Forecast, 2018-2029

      • 5.1. Key Findings / Summary
      • 5.2. Market Analysis, Insights and Forecast – By Segment 1
        • 5.2.1. Sub-Segment 1
        • 5.2.2. Sub-Segment 2
      • 5.3. Market Analysis, Insights and Forecast – By Segment 2
        • 5.3.1. Sub-Segment 1
        • 5.3.2. Sub-Segment 2
        • 5.3.3. Sub-Segment 3
        • 5.3.4. Others
      • 5.4. Market Analysis, Insights and Forecast – By Segment 3
        • 5.4.1. Sub-Segment 1
        • 5.4.2. Sub-Segment 2
        • 5.4.3. Sub-Segment 3
        • 5.4.4. Others
      • 5.5. Market Analysis, Insights and Forecast – By Region
        • 5.5.1. North America
        • 5.5.2. Latin America
        • 5.5.3. Europe
        • 5.5.4. Asia Pacific
        • 5.5.5. Middle East and Africa

      6. North America Smart Security ICs Market Analysis (USD Billion), Insights and Forecast, 2018-2029

      • 6.1. Key Findings / Summary
      • 6.2. Market Analysis, Insights and Forecast – By Segment 1
        • 6.2.1. Sub-Segment 1
        • 6.2.2. Sub-Segment 2
      • 6.3. Market Analysis, Insights and Forecast – By Segment 2
        • 6.3.1. Sub-Segment 1
        • 6.3.2. Sub-Segment 2
        • 6.3.3. Sub-Segment 3
        • 6.3.4. Others
      • 6.4. Market Analysis, Insights and Forecast – By Segment 3
        • 6.4.1. Sub-Segment 1
        • 6.4.2. Sub-Segment 2
        • 6.4.3. Sub-Segment 3
        • 6.4.4. Others
      • 6.5. Market Analysis, Insights and Forecast – By Country
        • 6.5.1. U.S.
        • 6.5.2. Canada

      7. Latin America Smart Security ICs Market Analysis (USD Billion), Insights and Forecast, 2018-2029

      • 7.1. Key Findings / Summary
      • 7.2. Market Analysis, Insights and Forecast – By Segment 1
        • 7.2.1. Sub-Segment 1
        • 7.2.2. Sub-Segment 2
      • 7.3. Market Analysis, Insights and Forecast – By Segment 2
        • 7.3.1. Sub-Segment 1
        • 7.3.2. Sub-Segment 2
        • 7.3.3. Sub-Segment 3
        • 7.3.4. Others
      • 7.4. Market Analysis, Insights and Forecast – By Segment 3
        • 7.4.1. Sub-Segment 1
        • 7.4.2. Sub-Segment 2
        • 7.4.3. Sub-Segment 3
        • 7.4.4. Others
      • 7.5. Insights and Forecast – By Country
        • 7.5.1. Brazil
        • 7.5.2. Mexico
        • 7.5.3. Rest of Latin America

      8. Europe Smart Security ICs Market Analysis (USD Billion), Insights and Forecast, 2018-2029

      • 8.1. Key Findings / Summary
      • 8.2. Market Analysis, Insights and Forecast – By Segment 1
        • 8.2.1. Sub-Segment 1
        • 8.2.2. Sub-Segment 2
      • 8.3. Market Analysis, Insights and Forecast – By Segment 2
        • 8.3.1. Sub-Segment 1
        • 8.3.2. Sub-Segment 2
        • 8.3.3. Sub-Segment 3
        • 8.3.4. Others
      • 8.4. Market Analysis, Insights and Forecast – By Segment 3
        • 8.4.1. Sub-Segment 1
        • 8.4.2. Sub-Segment 2
        • 8.4.3. Sub-Segment 3
        • 8.4.4. Others
      • 8.5. Market Analysis, Insights and Forecast – By Country
        • 8.5.1. UK
        • 8.5.2. Germany
        • 8.5.3. France
        • 8.5.4. Italy
        • 8.5.5. Spain
        • 8.5.6. Russia
        • 8.5.7. Rest of Europe

      9. Asia Pacific Smart Security ICs Market Analysis (USD Billion), Insights and Forecast, 2018-2029

      • 9.1. Key Findings / Summary
      • 9.2. Market Analysis, Insights and Forecast – By Segment 1
        • 9.2.1. Sub-Segment 1
        • 9.2.2. Sub-Segment 2
      • 9.3. Market Analysis, Insights and Forecast – By Segment 2
        • 9.3.1. Sub-Segment 1
        • 9.3.2. Sub-Segment 2
        • 9.3.3. Sub-Segment 3
        • 9.3.4. Others
      • 9.4. Market Analysis, Insights and Forecast – By Segment 3
        • 9.4.1. Sub-Segment 1
        • 9.4.2. Sub-Segment 2
        • 9.4.3. Sub-Segment 3
        • 9.4.4. Others
      • 9.5. Market Analysis, Insights and Forecast – By Country
        • 9.5.1. China
        • 9.5.2. India
        • 9.5.3. Japan
        • 9.5.4. Australia
        • 9.5.5. South East Asia
        • 9.5.6. Rest of Asia Pacific

      10. Middle East & Africa Smart Security ICs Market Analysis (USD Billion), Insights and Forecast, 2018-2029

      • 10.1. Key Findings / Summary
      • 10.2. Market Analysis, Insights and Forecast – By Segment 1
        • 10.2.1. Sub-Segment 1
        • 10.2.2. Sub-Segment 2
      • 10.3. Market Analysis, Insights and Forecast – By Segment 2
        • 10.3.1. Sub-Segment 1
        • 10.3.2. Sub-Segment 2
        • 10.3.3. Sub-Segment 3
        • 10.3.4. Others
      • 10.4. Market Analysis, Insights and Forecast – By Segment 3
        • 10.4.1. Sub-Segment 1
        • 10.4.2. Sub-Segment 2
        • 10.4.3. Sub-Segment 3
        • 10.4.4. Others
      • 10.5. Market Analysis, Insights and Forecast – By Country
        • 10.5.1. GCC
        • 10.5.2. South Africa
        • 10.5.3. Rest of Middle East & Africa

      11. Competitive Analysis

      • 11.1. Company Market Share Analysis, 2018
      • 11.2. Key Industry Developments
      • 11.3. Company Profile
        • 11.3.1. Company 1
          • 11.3.1.1. Business Overview
          • 11.3.1.2. Segment 1 & Service Offering
          • 11.3.1.3. Overall Revenue
          • 11.3.1.4. Geographic Presence
          • 11.3.1.5. Recent Development
        *Similar details will be provided for the following companies
        • 11.3.2. Company 2
        • 11.3.3. Company 3
        • 11.3.4. Company 4
        • 11.3.5. Company 5
        • 11.3.6. Company 6
        • 11.3.7. Company 7
        • 11.3.8. Company 8
        • 11.3.9. Company 9
        • 11.3.10. Company 10
        • 11.3.11. Company 11
        • 11.3.12. Company 12
      List of Figures

      Figure 1: Global Smart Security ICs Market Revenue Breakdown (USD Billion, %) by Region, 2022 & 2029
      Figure 2: Global Smart Security ICs Market Value Share (%), By Segment 1, 2022 & 2029
      Figure 3: Global Smart Security ICs Market Forecast (USD Billion), by Sub-Segment 1, 2018-2029
      Figure 4: Global Smart Security ICs Market Forecast (USD Billion), by Sub-Segment 2, 2018-2029
      Figure 5: Global Smart Security ICs Market Value Share (%), By Segment 2, 2022 & 2029
      Figure 6: Global Smart Security ICs Market Forecast (USD Billion), by Sub-Segment 1, 2018-2029
      Figure 7: Global Smart Security ICs Market Forecast (USD Billion), by Sub-Segment 2, 2018-2029
      Figure 8: Global Smart Security ICs Market Forecast (USD Billion), by Sub-Segment 3, 2018-2029
      Figure 9: Global Smart Security ICs Market Forecast (USD Billion), by Others, 2018-2029
      Figure 10: Global Smart Security ICs Market Value Share (%), By Segment 3, 2022 & 2029
      Figure 11: Global Smart Security ICs Market Forecast (USD Billion), by Sub-Segment 1, 2018-2029
      Figure 12: Global Smart Security ICs Market Forecast (USD Billion), by Sub-Segment 2, 2018-2029
      Figure 13: Global Smart Security ICs Market Forecast (USD Billion), by Sub-Segment 3, 2018-2029
      Figure 14: Global Smart Security ICs Market Forecast (USD Billion), by Others, 2018-2029
      Figure 15: Global Smart Security ICs Market Value (USD Billion), by Region, 2022 & 2029
      Figure 16: North America Smart Security ICs Market Value Share (%), By Segment 1, 2022 & 2029
      Figure 17: North America Smart Security ICs Market Forecast (USD Billion), by Sub-Segment 1, 2018-2029
      Figure 18: North America Smart Security ICs Market Forecast (USD Billion), by Sub-Segment 2, 2018-2029
      Figure 19: North America Smart Security ICs Market Value Share (%), By Segment 2, 2022 & 2029
      Figure 20: North America Smart Security ICs Market Forecast (USD Billion), by Sub-Segment 1, 2018-2029
      Figure 21: North America Smart Security ICs Market Forecast (USD Billion), by Sub-Segment 2, 2018-2029
      Figure 22: North America Smart Security ICs Market Forecast (USD Billion), by Sub-Segment 3, 2018-2029
      Figure 23: North America Smart Security ICs Market Forecast (USD Billion), by Others, 2018-2029
      Figure 24: North America Smart Security ICs Market Value Share (%), By Segment 3, 2022 & 2029
      Figure 25: North America Smart Security ICs Market Forecast (USD Billion), by Sub-Segment 1, 2018-2029
      Figure 26: North America Smart Security ICs Market Forecast (USD Billion), by Sub-Segment 2, 2018-2029
      Figure 27: North America Smart Security ICs Market Forecast (USD Billion), by Sub-Segment 3, 2018-2029
      Figure 28: North America Smart Security ICs Market Forecast (USD Billion), by Others, 2018-2029
      Figure 29: North America Smart Security ICs Market Forecast (USD Billion), by U.S., 2018-2029
      Figure 30: North America Smart Security ICs Market Forecast (USD Billion), by Canada, 2018-2029
      Figure 31: Latin America Smart Security ICs Market Value Share (%), By Segment 1, 2022 & 2029
      Figure 32: Latin America Smart Security ICs Market Forecast (USD Billion), by Sub-Segment 1, 2018-2029
      Figure 33: Latin America Smart Security ICs Market Forecast (USD Billion), by Sub-Segment 2, 2018-2029
      Figure 34: Latin America Smart Security ICs Market Value Share (%), By Segment 2, 2022 & 2029
      Figure 35: Latin America Smart Security ICs Market Forecast (USD Billion), by Sub-Segment 1, 2018-2029
      Figure 36: Latin America Smart Security ICs Market Forecast (USD Billion), by Sub-Segment 2, 2018-2029
      Figure 37: Latin America Smart Security ICs Market Forecast (USD Billion), by Sub-Segment 3, 2018-2029
      Figure 38: Latin America Smart Security ICs Market Forecast (USD Billion), by Others, 2018-2029
      Figure 39: Latin America Smart Security ICs Market Value Share (%), By Segment 3, 2022 & 2029
      Figure 40: Latin America Smart Security ICs Market Forecast (USD Billion), by Sub-Segment 1, 2018-2029
      Figure 41: Latin America Smart Security ICs Market Forecast (USD Billion), by Sub-Segment 2, 2018-2029
      Figure 42: Latin America Smart Security ICs Market Forecast (USD Billion), by Sub-Segment 3, 2018-2029
      Figure 43: Latin America Smart Security ICs Market Forecast (USD Billion), by Others, 2018-2029
      Figure 44: Latin America Smart Security ICs Market Forecast (USD Billion), by Brazil, 2018-2029
      Figure 45: Latin America Smart Security ICs Market Forecast (USD Billion), by Mexico, 2018-2029
      Figure 46: Latin America Smart Security ICs Market Forecast (USD Billion), by Rest of Latin America, 2018-2029
      Figure 47: Europe Smart Security ICs Market Value Share (%), By Segment 1, 2022 & 2029
      Figure 48: Europe Smart Security ICs Market Forecast (USD Billion), by Sub-Segment 1, 2018-2029
      Figure 49: Europe Smart Security ICs Market Forecast (USD Billion), by Sub-Segment 2, 2018-2029
      Figure 50: Europe Smart Security ICs Market Value Share (%), By Segment 2, 2022 & 2029
      Figure 51: Europe Smart Security ICs Market Forecast (USD Billion), by Sub-Segment 1, 2018-2029
      Figure 52: Europe Smart Security ICs Market Forecast (USD Billion), by Sub-Segment 2, 2018-2029
      Figure 53: Europe Smart Security ICs Market Forecast (USD Billion), by Sub-Segment 3, 2018-2029
      Figure 54: Europe Smart Security ICs Market Forecast (USD Billion), by Others, 2018-2029
      Figure 55: Europe Smart Security ICs Market Value Share (%), By Segment 3, 2022 & 2029
      Figure 56: Europe Smart Security ICs Market Forecast (USD Billion), by Sub-Segment 1, 2018-2029
      Figure 57: Europe Smart Security ICs Market Forecast (USD Billion), by Sub-Segment 2, 2018-2029
      Figure 58: Europe Smart Security ICs Market Forecast (USD Billion), by Sub-Segment 3, 2018-2029
      Figure 59: Europe Smart Security ICs Market Forecast (USD Billion), by Others, 2018-2029
      Figure 60: Europe Smart Security ICs Market Forecast (USD Billion), by U.K., 2018-2029
      Figure 61: Europe Smart Security ICs Market Forecast (USD Billion), by Germany, 2018-2029
      Figure 62: Europe Smart Security ICs Market Forecast (USD Billion), by France, 2018-2029
      Figure 63: Europe Smart Security ICs Market Forecast (USD Billion), by Italy, 2018-2029
      Figure 64: Europe Smart Security ICs Market Forecast (USD Billion), by Spain, 2018-2029
      Figure 65: Europe Smart Security ICs Market Forecast (USD Billion), by Russia, 2018-2029
      Figure 66: Europe Smart Security ICs Market Forecast (USD Billion), by Rest of Europe, 2018-2029
      Figure 67: Asia Pacific Smart Security ICs Market Value Share (%), By Segment 1, 2022 & 2029
      Figure 68: Asia Pacific Smart Security ICs Market Forecast (USD Billion), by Sub-Segment 1, 2018-2029
      Figure 69: Asia Pacific Smart Security ICs Market Forecast (USD Billion), by Sub-Segment 2, 2018-2029
      Figure 70: Asia Pacific Smart Security ICs Market Value Share (%), By Segment 2, 2022 & 2029
      Figure 71: Asia Pacific Smart Security ICs Market Forecast (USD Billion), by Sub-Segment 1, 2018-2029
      Figure 72: Asia Pacific Smart Security ICs Market Forecast (USD Billion), by Sub-Segment 2, 2018-2029
      Figure 73: Asia Pacific Smart Security ICs Market Forecast (USD Billion), by Sub-Segment 3, 2018-2029
      Figure 74: Asia Pacific Smart Security ICs Market Forecast (USD Billion), by Others, 2018-2029
      Figure 75: Asia Pacific Smart Security ICs Market Value Share (%), By Segment 3, 2022 & 2029
      Figure 76: Asia Pacific Smart Security ICs Market Forecast (USD Billion), by Sub-Segment 1, 2018-2029
      Figure 77: Asia Pacific Smart Security ICs Market Forecast (USD Billion), by Sub-Segment 2, 2018-2029
      Figure 78: Asia Pacific Smart Security ICs Market Forecast (USD Billion), by Sub-Segment 3, 2018-2029
      Figure 79: Asia Pacific Smart Security ICs Market Forecast (USD Billion), by Others, 2018-2029
      Figure 80: Asia Pacific Smart Security ICs Market Forecast (USD Billion), by China, 2018-2029
      Figure 81: Asia Pacific Smart Security ICs Market Forecast (USD Billion), by India, 2018-2029
      Figure 82: Asia Pacific Smart Security ICs Market Forecast (USD Billion), by Japan, 2018-2029
      Figure 83: Asia Pacific Smart Security ICs Market Forecast (USD Billion), by Australia, 2018-2029
      Figure 84: Asia Pacific Smart Security ICs Market Forecast (USD Billion), by Southeast Asia, 2018-2029
      Figure 85: Asia Pacific Smart Security ICs Market Forecast (USD Billion), by Rest of Asia Pacific, 2018-2029
      Figure 86: Middle East & Africa Smart Security ICs Market Value Share (%), By Segment 1, 2022 & 2029
      Figure 87: Middle East & Africa Smart Security ICs Market Forecast (USD Billion), by Sub-Segment 1, 2018-2029
      Figure 88: Middle East & Africa Smart Security ICs Market Forecast (USD Billion), by Sub-Segment 2, 2018-2029
      Figure 89: Middle East & Africa Smart Security ICs Market Value Share (%), By Segment 2, 2022 & 2029
      Figure 90: Middle East & Africa Smart Security ICs Market Forecast (USD Billion), by Sub-Segment 1, 2018-2029
      Figure 91: Middle East & Africa Smart Security ICs Market Forecast (USD Billion), by Sub-Segment 2, 2018-2029
      Figure 92: Middle East & Africa Smart Security ICs Market Forecast (USD Billion), by Sub-Segment 3, 2018-2029
      Figure 93: Middle East & Africa Smart Security ICs Market Forecast (USD Billion), by Others, 2018-2029
      Figure 94: Middle East & Africa Smart Security ICs Market Value Share (%), By Segment 3, 2022 & 2029
      Figure 95: Middle East & Africa Smart Security ICs Market Forecast (USD Billion), by Sub-Segment 1, 2018-2029
      Figure 96: Middle East & Africa Smart Security ICs Market Forecast (USD Billion), by Sub-Segment 2, 2018-2029
      Figure 97: Middle East & Africa Smart Security ICs Market Forecast (USD Billion), by Sub-Segment 3, 2018-2029
      Figure 98: Middle East & Africa Smart Security ICs Market Forecast (USD Billion), by Others, 2018-2029
      Figure 99: Middle East & Africa Smart Security ICs Market Forecast (USD Billion), by GCC, 2018-2029
      Figure 100: Middle East & Africa Smart Security ICs Market Forecast (USD Billion), by South Africa, 2018-2029
      Figure 101: Middle East & Africa Smart Security ICs Market Forecast (USD Billion), by Rest of Middle East & Africa, 2018-2029 
      List of Tables
      Table 1: Global Smart Security ICs Market Revenue (USD Billion) Forecast, by Segment 1, 2018-2029
      Table 2: Global Smart Security ICs Market Revenue (USD Billion) Forecast, by Segment 2, 2018-2029
      Table 3: Global Smart Security ICs Market Revenue (USD Billion) Forecast, by Segment 3, 2018-2029
      Table 4: Global Smart Security ICs Market Revenue (USD Billion) Forecast, by Region, 2018-2029
      Table 5: North America Smart Security ICs Market Revenue (USD Billion) Forecast, by Segment 1, 2018-2029
      Table 6: North America Smart Security ICs Market Revenue (USD Billion) Forecast, by Segment 2, 2018-2029
      Table 7: North America Smart Security ICs Market Revenue (USD Billion) Forecast, by Segment 3, 2018-2029
      Table 8: North America Smart Security ICs Market Revenue (USD Billion) Forecast, by Country, 2018-2029
      Table 9: Europe Smart Security ICs Market Revenue (USD Billion) Forecast, by Segment 1, 2018-2029
      Table 10: Europe Smart Security ICs Market Revenue (USD Billion) Forecast, by Segment 2, 2018-2029
      Table 11: Europe Smart Security ICs Market Revenue (USD Billion) Forecast, by Segment 3, 2018-2029
      Table 12: Europe Smart Security ICs Market Revenue (USD Billion) Forecast, by Country, 2018-2029
      Table 13: Latin America Smart Security ICs Market Revenue (USD Billion) Forecast, by Segment 1, 2018-2029
      Table 14: Latin America Smart Security ICs Market Revenue (USD Billion) Forecast, by Segment 2, 2018-2029
      Table 15: Latin America Smart Security ICs Market Revenue (USD Billion) Forecast, by Segment 3, 2018-2029
      Table 16: Latin America Smart Security ICs Market Revenue (USD Billion) Forecast, by Country, 2018-2029
      Table 17: Asia Pacific Smart Security ICs Market Revenue (USD Billion) Forecast, by Segment 1, 2018-2029
      Table 18: Asia Pacific Smart Security ICs Market Revenue (USD Billion) Forecast, by Segment 2, 2018-2029
      Table 19: Asia Pacific Smart Security ICs Market Revenue (USD Billion) Forecast, by Segment 3, 2018-2029
      Table 20: Asia Pacific Smart Security ICs Market Revenue (USD Billion) Forecast, by Country, 2018-2029
      Table 21: Middle East & Africa Smart Security ICs Market Revenue (USD Billion) Forecast, by Segment 1, 2018-2029
      Table 22: Middle East & Africa Smart Security ICs Market Revenue (USD Billion) Forecast, by Segment 2, 2018-2029
      Table 23: Middle East & Africa Smart Security ICs Market Revenue (USD Billion) Forecast, by Segment 3, 2018-2029
      Table 24: Middle East & Africa Smart Security ICs Market Revenue (USD Billion) Forecast, by Country, 2018-2029
      Research Process

      Data Library Research are conducted by industry experts who offer insight on industry structure, market segmentations technology assessment and competitive landscape (CL), and penetration, as well as on emerging trends. Their analysis is based on primary interviews (~ 80%) and secondary research (~ 20%) as well as years of professional expertise in their respective industries. Adding to this, by analysing historical trends and current market positions, our analysts predict where the market will be headed for the next five years. Furthermore, the varying trends of segment & categories geographically presented are also studied and the estimated based on the primary & secondary research.

      In this particular report from the supply side Data Library Research has conducted primary surveys (interviews) with the key level executives (VP, CEO’s, Marketing Director, Business Development Manager and SOFT) of the companies that active & prominent as well as the midsized organization

      FIGURE 1: DLR RESEARH PROCESS

      research-methodology1

      Primary Research

      Extensive primary research was conducted to gain a deeper insight of the market and industry performance. The analysis is based on both primary and secondary research as well as years of professional expertise in the respective industries.

      In addition to analysing current and historical trends, our analysts predict where the market is headed over the next five years.

      It varies by segment for these categories geographically presented in the list of market tables. Speaking about this particular report we have conducted primary surveys (interviews) with the key level executives (VP, CEO’s, Marketing Director, Business Development Manager and many more) of the major players active in the market.

      Secondary Research

      Secondary research was mainly used to collect and identify information useful for the extensive, technical, market-oriented, and Friend’s study of the Global Extra Neutral Alcohol. It was also used to obtain key information about major players, market classification and segmentation according to the industry trends, geographical markets, and developments related to the market and technology perspectives. For this study, analysts have gathered information from various credible sources, such as annual reports, sec filings, journals, white papers, SOFT presentations, and company web sites.

      Market Size Estimation

      Both, top-down and bottom-up approaches were used to estimate and validate the size of the Global market and to estimate the size of various other dependent submarkets in the overall Extra Neutral Alcohol. The key players in the market were identified through secondary research and their market contributions in the respective geographies were determined through primary and secondary research.

      Forecast Model

      research-methodology2

      Happy to Assist You

      If you have a question?

      info@datalibraryresearch.com

      IND : +91 955 279 0357

      Browse Related Reports