Global Solid Phase Extraction (SPE) Industry Market, By Type (SPE Disk, SPE Cartridge, Others), By Application (Pharmaceutical Industries, Hospitals & Clinics, Environmental, Academic & Research Institutes, Others), and opportunities and forecast 2020-2027
Solid Phase Extraction (SPE) Industry Market Overview
Solid-phase extraction (SPE) is an extractive technique that separates compounds that are dissolved or suspended in a liquid mixture based on their physical and chemical properties from other compounds in the mixture. Solid phase extraction is used in analytical laboratories to concentrate and purify materials for analysis. Solid phase extraction is a technique for isolating analytes of interest from a range of matrices, including urine, blood, water, drinks, soil, and animal tissue. The global Solid Phase Extraction (SPE) Industry market is expected to grow at a considerable rate in the forthcoming year.
The solid phase extraction (SPE) market has seen numerous technological improvements to fulfil the needs of biotechnology and biopharmaceutical companies, food and beverage companies, chemical companies, semiconductor companies, and environmental monitoring. Miniaturized, automated, and computerized gadgets have resulted from these improvements. SPE devices have become more convenient and simpler to use as a result of these technical improvements. Technological improvements and automation are projected to increase the growth of the global Solid Phase Extraction (SPE) Industry market. The global solid phase extraction market is expanding as product characteristics become more technologically advanced. Because of the expanding number of contract research companies and the increasing use of generic pharmaceuticals, there is a growing demand for creative goods. Increased investments in the life science sector are also projected to promote market growth in the near future.
On the negative side, the lack of standardized regulations is hindering the growth of the solid phase extraction (SPE) industry market. Moreover, changing government policies and regulations for medical instruments manufacturing and shipment or exports are some other factors limiting the market growth.
Report Metric
Details
Market size available for years
2019–2027
Base year considered
2019
Forecast period
2020–2027
Forecast unit
Value (USD Million)
Segments covered
Type, Application, and Region.
Regions covered
North America (the U.S. and Canada), Europe (UK, Germany, France, Italy, Spain, Russia, Rest of Europe), Asia-Pacific (China, India, Japan, Australia, South East Asia, Rest of Asia Pacific), Latin America and the Middle East and Africa (Brazil, Saudi Arabia, UAE, Rest of LAMEA)
Covid-19 Impact on Solid Phase Extraction (SPE) Industry Market
In addition, the current Solid Phase Extraction (SPE) Industry Market study offers a detailed analysis of the current COVID-19 pandemic impact on the market growth and its influence on the future growth of the Solid Phase Extraction (SPE) Industry Market. The recently published report demonstrates the elevation in the demand for the healthcare sector. The healthcare manufacturers have experienced long-term as well as short-term effect which includes supply shortages, panic buying, and stocking, regulation changes as short-term whereas approval delays and possible trend variations in consumption could be perceived as long-term impacts of COVID-19 on the health and pharmaceutical market The increasing need for a cure has pushed vaccine research and manufacturers to the limit. In addition to this, panic conditions have already spurred the demand for many healthcare products and services which are discussed in detail in this report. Moreover, the impact of COVID-19 on overall market revenue for the base year 2020 and its projection up to 2027 is provided in detail in this report.
Solid Phase Extraction (SPE) Industry Market Segment Overview
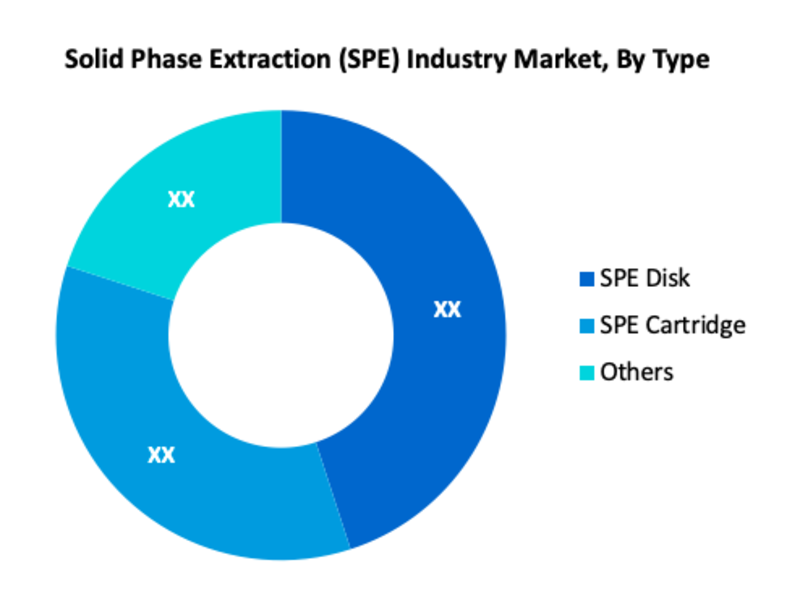
According to Type, SPE Disk is the most prominent segment in the global Solid Phase Extraction (SPE) Industry market. For sample preparation, the SPE disc is used in solid-phase extraction. The constantly expanding pharmaceutical industry increased laboratory spending, and high adoption of superior technologies in emerging regions are driving market expansion for SPE discs. According to Application, Pharmaceutical Industries is another main segment in the global market. This segment's growth is primarily impacted by the constantly increasing pharmaceutical industry and widespread adoption of advanced technology. Furthermore, pharmaceutical companies are investing heavily in R&D to develop new pharmaceuticals and other biological products, which is propelling the segment's growth.
Solid Phase Extraction (SPE) Industry Market, By Type · SPE Disk · SPE Cartridge · Others
Solid Phase Extraction (SPE) Industry Market, By Application · Pharmaceutical Industries · Hospitals & Clinics · Environmental · Academic & Research Institutes · Others
Solid Phase Extraction (SPE) Industry Market Regional Overview
Region-wise, North America commanded a major share of the market and is predictable to maintain its supremacy over the forecast period. The expansion in biotechnology and pharmaceutical companies, greater R&D capacities, concentration of the leading market participants, and availability of the latest techniques and tools for drug discovery research are all factors contributing to this supremacy. Moreover, Europe is the second-largest region for the market. For market players, Europe provides significant growth potential, which can help in the advancement of the solid phase extraction market in the future years. The government's measures to assist such projects help the market grow in the region. As well, the Asia Pacific is expected to register the fastest growth during the forecast period. The latest advancements in instrumentation, emerging economic conditions, increasing investment in biotechnology, and pharmaceutical research organizations in Asia-Pacific developing countries are all contributing to the market’s expansion.
Solid Phase Extraction (SPE) Industry Market, By Geography
· North America (US & Canada) · Europe (UK, Germany, France, Italy, Spain, Russia & Rest of Europe) · Asia-Pacific (Japan, China, India, Australia, & South Korea, & Rest of Asia-Pacific) · LAMEA (Brazil, Saudi Arabia, UAE & Rest of LAMEA)
Solid Phase Extraction (SPE) Industry Market, Key Players
· Thermo Fisher Scientific · PerkinElmer Inc. · 3M · Gilson Incorporated · Gerstel GmbH & Co. KG · Merck KGaA · Agilent Technologies · GL Sciences Inc. · Biotage AB · Waters Corporation · Tecan Trading AG · Cytiva · Pall Corporation · Phenomenex Inc. · Sigma-Aldrich
Frequently Asked Questions (FAQ) :
Q1. What are the driving factors for the global Solid Phase Extraction (SPE) Industry market?
A. Technological improvements and automation are projected to increase the growth of the global Solid Phase Extraction (SPE) Industry market.
Q2. What are the restraining factors for the global Solid Phase Extraction (SPE) Industry market?
A. The lack of standardized regulations is hindering the growth of the solid phase extraction (SPE) industry market.
Q3. Which segment is projected to hold the largest share in the global Solid Phase Extraction (SPE) Industry Market?
A. SPE Disk segment is projected to hold the largest share in the global Solid Phase Extraction (SPE) Industry Market.
Q4. Which region holds the largest share in the global Solid Phase Extraction (SPE) Industry market?
A. North America held the largest share in the global Solid Phase Extraction (SPE) Industry market.
Q5. Which are the prominent players in the global Solid Phase Extraction (SPE) Industry Market?
A. Thermo Fisher Scientific, PerkinElmer Inc., 3M, Gilson Incorporated, Gerstel GmbH & Co. KG, Merck KGaA, Agilent Technologies, GL Sciences Inc., Biotage AB, Waters Corporation, Tecan Trading AG, Cytiva, Pall Corporation, Phenomenex Inc., Sigma-Aldrich. are some key players in the global Solid Phase Extraction (SPE) Industry Market
Solid Phase Extraction (SPE) Industry Market Study Global Market Analysis, Insights and Forecast, 2020-2027
1. Introduction
1.1. Research Scope
1.2. Market Segmentation
1.3. Research Methodology
1.4. Definitions and Assumptions
2. Executive Summary
3. Market Dynamics
3.1. Market Drivers
3.2. Market Restraints
3.3. Market Opportunities
4. Key Insights
4.1. Key Emerging Trends – For Major Countries
4.2. Latest Technological Advancement
4.3. Regulatory Landscape
4.4. Industry SWOT Analysis
4.5. Porters Five Forces Analysis
5. Global Solid Phase Extraction (SPE) Industry Market Analysis (USD Billion), Insights and Forecast, 2020-2027
5.1. Key Findings / Summary
5.2. Market Analysis, Insights and Forecast – By Type
5.2.1. SPE Disk
5.2.2. SPE Cartridge
5.2.3. Others
5.3. Market Analysis, Insights and Forecast – By Application
5.3.1. Pharmaceutical Industries
5.3.2. Hospitals & Clinics
5.3.3. Environmental
5.3.4. Academic & Research Institutes
5.3.5. Others
5.4. Market Analysis, Insights and Forecast – By Region
5.4.1. North America
5.4.2. Europe
5.4.3. Asia Pacific
5.4.4. Latin America, Middle East and Africa
6. North America Solid Phase Extraction (SPE) Industry Market Analysis (USD Billion), Insights and Forecast, 2020-2027
6.1. Key Findings / Summary
6.2. Market Analysis, Insights and Forecast – By Type
6.2.1. SPE Disk
6.2.2. SPE Cartridge
6.2.3. Others
6.3. Market Analysis, Insights and Forecast – By Application
6.3.1. Pharmaceutical Industries
6.3.2. Hospitals & Clinics
6.3.3. Environmental
6.3.4. Academic & Research Institutes
6.3.5. Others
6.4. Market Analysis, Insights and Forecast – By Country
6.4.1. U.S.
6.4.2. Canada
7. Europe Solid Phase Extraction (SPE) Industry Market Analysis (USD Billion), Insights and Forecast, 2020-2027
7.1. Key Findings / Summary
7.2. Market Analysis, Insights and Forecast – By Type
7.2.1. SPE Disk
7.2.2. SPE Cartridge
7.2.3. Others
7.3. Market Analysis, Insights and Forecast – By Application
7.3.1. Pharmaceutical Industries
7.3.2. Hospitals & Clinics
7.3.3. Environmental
7.3.4. Academic & Research Institutes
7.3.5. Others
7.4. Market Analysis, Insights and Forecast – By Country
7.4.1. UK
7.4.2. Germany
7.4.3. France
7.4.4. Italy
7.4.5. Spain
7.4.6. Russia
7.4.7. Rest of Europe
8. Asia Pacific Solid Phase Extraction (SPE) Industry Market Analysis (USD Billion), Insights and Forecast, 2020-2027
8.1. Key Findings / Summary
8.2. Market Analysis, Insights and Forecast – By Type
8.2.1. SPE Disk
8.2.2. SPE Cartridge
8.2.3. Others
8.3. Market Analysis, Insights and Forecast – By Application
8.3.1. Pharmaceutical Industries
8.3.2. Hospitals & Clinics
8.3.3. Environmental
8.3.4. Academic & Research Institutes
8.3.5. Others
8.4. Market Analysis, Insights and Forecast – By Country
8.4.1. China
8.4.2. India
8.4.3. Japan
8.4.4. Australia
8.4.5. South East Asia
8.4.6. Rest of Asia Pacific
9. Latin America, Middle East and Africa Solid Phase Extraction (SPE) Industry Market Analysis (USD Billion), Insights and Forecast, 2020-2027
9.1. Key Findings / Summary
9.2. Market Analysis, Insights and Forecast – By Type
9.2.1. SPE Disk
9.2.2. SPE Cartridge
9.2.3. Others
9.3. Market Analysis, Insights and Forecast – By Application
9.3.1. Pharmaceutical Industries
9.3.2. Hospitals & Clinics
9.3.3. Environmental
9.3.4. Academic & Research Institutes
9.3.5. Others
9.4. Market Analysis, Insights and Forecast – By Country
9.4.1. Brazil
9.4.2. Saudi Arabia
9.4.3. UAE
9.4.4. Rest of LAMEA
10. Competitive Analysis
10.1. Company Market Share Analysis, 2018
10.2. Key Industry Developments
10.3. Company Profile
10.4. Thermo Fisher Scientific
10.4.1. Business Overview
10.4.2. Segment 1 & Service Offering
10.4.3. Overall Revenue
10.4.4. Geographic Presence
10.4.5. Recent Development
*Similar details will be provided for the following companies
10.5. PerkinElmer Inc.
10.6. 3M
10.7. Gilson Incorporated
10.8. Gerstel GmbH & Co. KG
10.9. Merck KGaA
10.10. Agilent Technologies
10.11. GL Sciences Inc.
10.12. Biotage AB
10.13. Waters Corporation
10.14. Tecan Trading AG
10.15. Cytiva
10.16. Pall Corporation
10.17. Phenomenex Inc.
List of Figures
Figure 1: Global Solid Phase Extraction Market Revenue Breakdown (USD Billion, %) by Region, 2019 & 2027
Figure 2: Global Market Value Share (%), By Segment 1, 2019 & 2027
Figure 3: Global Market Forecast (USD Billion), by Sub-Segment 1, 2016-2027
Figure 4: Global Market Forecast (USD Billion), by Sub-Segment 2, 2016-2027
Figure 5: Global Market Value Share (%), By Segment 2, 2019 & 2027
Figure 6: Global Market Forecast (USD Billion), by Sub-Segment 1, 2016-2027
Figure 7: Global Market Forecast (USD Billion), by Sub-Segment 2, 2016-2027
Figure 8: Global Market Forecast (USD Billion), by Sub-Segment 3, 2016-2027
Figure 9: Global Solid Phase Extraction Market Forecast (USD Billion), by Others, 2016-2027
Figure 10: Global Market Value Share (%), By Segment 3, 2019 & 2027
Figure 11: Global Market Forecast (USD Billion), by Sub-Segment 1, 2016-2027
Figure 12: Global Market Forecast (USD Billion), by Sub-Segment 2, 2016-2027
Figure 13: Global Market Forecast (USD Billion), by Sub-Segment 3, 2016-2027
Figure 14: Global Market Forecast (USD Billion), by Others, 2016-2027
Figure 15: Global Market Value (USD Billion), by Region, 2019 & 2027
Figure 16: North America Solid Phase Extraction Market Value Share (%), By Segment 1, 2019 & 2027
Figure 17: North America Market Forecast (USD Billion), by Sub-Segment 1, 2016-2027
Figure 18: North America Market Forecast (USD Billion), by Sub-Segment 2, 2016-2027
Figure 19: North America Market Value Share (%), By Segment 2, 2019 & 2027
Figure 20: North America Market Forecast (USD Billion), by Sub-Segment 1, 2016-2027
Figure 21: North America Market Forecast (USD Billion), by Sub-Segment 2, 2016-2027
Figure 22: North America Market Forecast (USD Billion), by Sub-Segment 3, 2016-2027
Figure 23: North America Market Forecast (USD Billion), by Others, 2016-2027
Figure 24: North America Market Value Share (%), By Segment 3, 2019 & 2027
Figure 25: North America Market Forecast (USD Billion), by Sub-Segment 1, 2016-2027
Figure 26: North America Market Forecast (USD Billion), by Sub-Segment 2, 2016-2027
Figure 27: North America Market Forecast (USD Billion), by Sub-Segment 3, 2016-2027
Figure 28: North America Market Forecast (USD Billion), by Others, 2016-2027
Figure 29: North America Market Forecast (USD Billion), by U.S., 2016-2027
Figure 30: North America Market Forecast (USD Billion), by Canada, 2016-2027
Figure 31: Latin America Solid Phase Extraction Market Value Share (%), By Segment 1, 2019 & 2027
Figure 32: Latin America Market Forecast (USD Billion), by Sub-Segment 1, 2016-2027
Figure 33: Latin America Market Forecast (USD Billion), by Sub-Segment 2, 2016-2027
Figure 34: Latin America Market Value Share (%), By Segment 2, 2019 & 2027
Figure 35: Latin America Market Forecast (USD Billion), by Sub-Segment 1, 2016-2027
Figure 36: Latin America Market Forecast (USD Billion), by Sub-Segment 2, 2016-2027
Figure 37: Latin America Market Forecast (USD Billion), by Sub-Segment 3, 2016-2027
Figure 38: Latin America Market Forecast (USD Billion), by Others, 2016-2027
Figure 39: Latin America Market Value Share (%), By Segment 3, 2019 & 2027
Figure 40: Latin America Market Forecast (USD Billion), by Sub-Segment 1, 2016-2027
Figure 41: Latin America Market Forecast (USD Billion), by Sub-Segment 2, 2016-2027
Figure 42: Latin America Market Forecast (USD Billion), by Sub-Segment 3, 2016-2027
Figure 43: Latin America Market Forecast (USD Billion), by Others, 2016-2027
Figure 44: Latin America Market Forecast (USD Billion), by Brazil, 2016-2027
Figure 45: Latin America Market Forecast (USD Billion), by Mexico, 2016-2027
Figure 46: Latin America Market Forecast (USD Billion), by Rest of Latin America, 2016-2027
Figure 47: Europe Solid Phase Extraction Market Value Share (%), By Segment 1, 2019 & 2027
Figure 48: Europe Market Forecast (USD Billion), by Sub-Segment 1, 2016-2027
Figure 49: Europe Market Forecast (USD Billion), by Sub-Segment 2, 2016-2027
Figure 50: Europe Market Value Share (%), By Segment 2, 2019 & 2027
Figure 51: Europe Market Forecast (USD Billion), by Sub-Segment 1, 2016-2027
Figure 52: Europe Market Forecast (USD Billion), by Sub-Segment 2, 2016-2027
Figure 53: Europe Market Forecast (USD Billion), by Sub-Segment 3, 2016-2027
Figure 54: Europe Market Forecast (USD Billion), by Others, 2016-2027
Figure 55: Europe Market Value Share (%), By Segment 3, 2019 & 2027
Figure 56: Europe Market Forecast (USD Billion), by Sub-Segment 1, 2016-2027
Figure 57: Europe Market Forecast (USD Billion), by Sub-Segment 2, 2016-2027
Figure 58: Europe Market Forecast (USD Billion), by Sub-Segment 3, 2016-2027
Figure 59: Europe Market Forecast (USD Billion), by Others, 2016-2027
Figure 60: Europe Market Forecast (USD Billion), by U.K., 2016-2027
Figure 61: Europe Market Forecast (USD Billion), by Germany, 2016-2027
Figure 62: Europe Market Forecast (USD Billion), by France, 2016-2027
Figure 63: Europe Market Forecast (USD Billion), by Italy, 2016-2027
Figure 64: Europe Market Forecast (USD Billion), by Spain, 2016-2027
Figure 65: Europe Market Forecast (USD Billion), by Russia, 2016-2027
Figure 66: Europe Market Forecast (USD Billion), by Rest of Europe, 2016-2027
Figure 67: Asia Pacific Solid Phase Extraction Market Value Share (%), By Segment 1, 2019 & 2027
Figure 68: Asia Pacific Market Forecast (USD Billion), by Sub-Segment 1, 2016-2027
Figure 69: Asia Pacific Market Forecast (USD Billion), by Sub-Segment 2, 2016-2027
Figure 70: Asia Pacific Market Value Share (%), By Segment 2, 2019 & 2027
Figure 71: Asia Pacific Market Forecast (USD Billion), by Sub-Segment 1, 2016-2027
Figure 72: Asia Pacific Market Forecast (USD Billion), by Sub-Segment 2, 2016-2027
Figure 73: Asia Pacific Market Forecast (USD Billion), by Sub-Segment 3, 2016-2027
Figure 74: Asia Pacific Market Forecast (USD Billion), by Others, 2016-2027
Figure 75: Asia Pacific Market Value Share (%), By Segment 3, 2019 & 2027
Figure 76: Asia Pacific Market Forecast (USD Billion), by Sub-Segment 1, 2016-2027
Figure 77: Asia Pacific Market Forecast (USD Billion), by Sub-Segment 2, 2016-2027
Figure 78: Asia Pacific Market Forecast (USD Billion), by Sub-Segment 3, 2016-2027
Figure 79: Asia Pacific Market Forecast (USD Billion), by Others, 2016-2027
Figure 80: Asia Pacific Market Forecast (USD Billion), by China, 2016-2027
Figure 81: Asia Pacific Market Forecast (USD Billion), by India, 2016-2027
Figure 82: Asia Pacific Market Forecast (USD Billion), by Japan, 2016-2027
Figure 83: Asia Pacific Market Forecast (USD Billion), by Australia, 2016-2027
Figure 84: Asia Pacific Market Forecast (USD Billion), by Southeast Asia, 2016-2027
Figure 85: Asia Pacific Market Forecast (USD Billion), by Rest of Asia Pacific, 2016-2027
Figure 86: Middle East & Africa Solid Phase Extraction Market Value Share (%), By Segment 1, 2019 & 2027
Figure 87: Middle East & Africa Market Forecast (USD Billion), by Sub-Segment 1, 2016-2027
Figure 88: Middle East & Africa Market Forecast (USD Billion), by Sub-Segment 2, 2016-2027
Figure 89: Middle East & Africa Market Value Share (%), By Segment 2, 2019 & 2027
Figure 90: Middle East & Africa Market Forecast (USD Billion), by Sub-Segment 1, 2016-2027
Figure 91: Middle East & Africa Market Forecast (USD Billion), by Sub-Segment 2, 2016-2027
Figure 92: Middle East & Africa Market Forecast (USD Billion), by Sub-Segment 3, 2016-2027
Figure 93: Middle East & Africa Market Forecast (USD Billion), by Others, 2016-2027
Figure 94: Middle East & Africa Market Value Share (%), By Segment 3, 2019 & 2027
Figure 95: Middle East & Africa Market Forecast (USD Billion), by Sub-Segment 1, 2016-2027
Figure 96: Middle East & Africa Market Forecast (USD Billion), by Sub-Segment 2, 2016-2027
Figure 97: Middle East & Africa Market Forecast (USD Billion), by Sub-Segment 3, 2016-2027
Figure 98: Middle East & Africa Market Forecast (USD Billion), by Others, 2016-2027
Figure 99: Middle East & Africa Market Forecast (USD Billion), by GCC, 2016-2027
Figure 100: Middle East & Africa Market Forecast (USD Billion), by South Africa, 2016-2027
Figure 101: Middle East & Africa Market Forecast (USD Billion), by Rest of Middle East & Africa, 2016-2027
List of Tables
Table 1: Global Solid Phase Extraction Market Revenue (USD Billion) Forecast, by Segment 1, 2016-2027
Table 2: Global Market Revenue (USD Billion) Forecast, by Segment 2, 2016-2027
Table 3: Global Market Revenue (USD Billion) Forecast, by Segment 3, 2016-2027
Table 4: Global Market Revenue (USD Billion) Forecast, by Region, 2016-2027
Table 5: North America Solid Phase Extraction Market Revenue (USD Billion) Forecast, by Segment 1, 2016-2027
Table 6: North America Market Revenue (USD Billion) Forecast, by Segment 2, 2016-2027
Table 7: North America Market Revenue (USD Billion) Forecast, by Segment 3, 2016-2027
Table 8: North America Market Revenue (USD Billion) Forecast, by Country, 2016-2027
Table 9: Europe Solid Phase Extraction Market Revenue (USD Billion) Forecast, by Segment 1, 2016-2027
Table 10: Europe Market Revenue (USD Billion) Forecast, by Segment 2, 2016-2027
Table 11: Europe Market Revenue (USD Billion) Forecast, by Segment 3, 2016-2027
Table 12: Europe Market Revenue (USD Billion) Forecast, by Country, 2016-2027
Table 13: Latin America Solid Phase Extraction Market Revenue (USD Billion) Forecast, by Segment 1, 2016-2027
Table 14: Latin America Market Revenue (USD Billion) Forecast, by Segment 2, 2016-2027
Table 15: Latin America Market Revenue (USD Billion) Forecast, by Segment 3, 2016-2027
Table 16: Latin America Market Revenue (USD Billion) Forecast, by Country, 2016-2027
Table 17: Asia Pacific Solid Phase Extraction Market Revenue (USD Billion) Forecast, by Segment 1, 2016-2027
Table 18: Asia Pacific Market Revenue (USD Billion) Forecast, by Segment 2, 2016-2027
Table 19: Asia Pacific Market Revenue (USD Billion) Forecast, by Segment 3, 2016-2027
Table 20: Asia Pacific Market Revenue (USD Billion) Forecast, by Country, 2016-2027
Table 21: Middle East & Africa Solid Phase Extraction Market Revenue (USD Billion) Forecast, by Segment 1, 2016-2027
Table 22: Middle East & Africa Market Revenue (USD Billion) Forecast, by Segment 2, 2016-2027
Table 23: Middle East & Africa Market Revenue (USD Billion) Forecast, by Segment 3, 2016-2027
Table 24: Middle East & Africa Market Revenue (USD Billion) Forecast, by Country, 2016-2027