Theragnostics Market Overview and Analysis:

The global theragnostics market size is set to expand from USD 2.78 billion in 2026 to USD 11.27 billion by 2033, with a CAGR of 14.21% from 2026-2033.

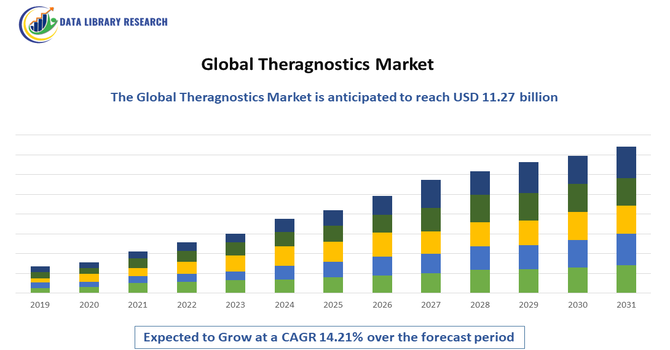
The global theragnostics market refers to the integrated field combining diagnostics and targeted therapy to enable personalized healthcare. It focuses on identifying specific biomarkers through advanced imaging, molecular diagnostics, and companion tests, then delivering therapies tailored to an individual patient’s disease profile. Widely applied in oncology, cardiology, neurology, and rare diseases, theragnostics improves treatment accuracy, reduces adverse effects, and enhances clinical outcomes. The market encompasses radiopharmaceuticals, imaging agents, diagnostic assays, and targeted therapeutics, supported by advances in genomics, artificial intelligence, and precision medicine.

Theragnostics Market Latest Trends

The global theragnostics market is driven by rapid advancements in precision medicine, molecular imaging, and biomarker discovery. Integration of artificial intelligence and machine learning enhances diagnostic accuracy and treatment decision-making. Increasing R&D in radiopharmaceuticals, coupled with regulatory approvals of novel theragnostic agents, bolsters market growth. Personalized oncology remains a key focus, with expanding applications in cardiovascular and neurological disorders. Collaboration between pharmaceutical and diagnostic firms accelerates companion diagnostic development.

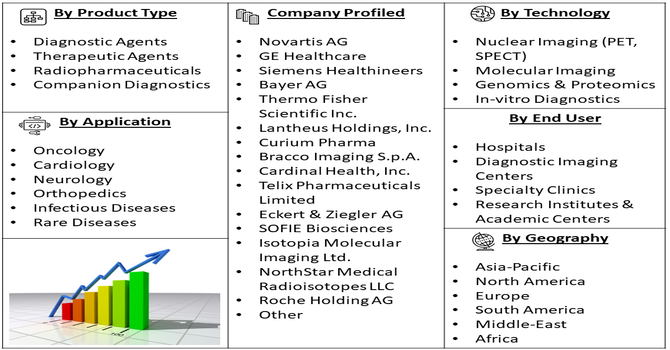
Segmentation: The global theragnostics market is segmented by Product Type (Diagnostic Agents, Therapeutic Agents, Radiopharmaceuticals and Companion Diagnostics), Technology (Nuclear Imaging (PET, SPECT), Molecular Imaging, Genomics & Proteomics and In-vitro Diagnostics), Application (Oncology, Cardiology, Neurology, Orthopedics, Infectious Diseases and Rare Diseases), End User (Hospitals, Diagnostic Imaging Centers, Specialty Clinics and Research Institutes & Academic Centers), and Geography (North America, Europe, Asia-Pacific, Middle East and Africa, and South America). The report provides the value (in USD million) for the above segments.

Market Drivers:

  • Rising Demand for Personalized Medicine

The growing shift toward personalized medicine is a major driver of the global theragnostics market. Healthcare providers increasingly focus on tailoring treatments based on a patient’s genetic, molecular, or biomarker profile to improve clinical outcomes. Theragnostics enables precise disease identification and targeted therapy selection, particularly in oncology, where treatment response varies significantly among patients. This approach reduces trial-and-error prescribing, minimizes adverse effects, and improves treatment efficiency. Increasing awareness among clinicians and patients about the benefits of individualized care, along with supportive regulatory frameworks for precision medicine, continues to accelerate adoption of theragnostic solutions worldwide.

  • Advancements in Imaging and Molecular Technologies

Rapid technological advancements in imaging systems, radiopharmaceuticals, genomics, and molecular diagnostics are strongly driving market growth. Innovations in PET and SPECT imaging, coupled with improved biomarkers and targeted radiotherapies, enhance diagnostic accuracy and therapeutic effectiveness. For instance, in December 2025, the collaboration between Telix and Varian advanced imaging and molecular technologies and boosted the global theragnostics market by integrating theranostics with radiation therapy, enhancing treatment precision, and supporting personalized oncology care.

Artificial intelligence and data analytics further support precise interpretation of complex diagnostic data. These advancements expand theragnostic applications beyond oncology into cardiology, neurology, and rare diseases. Continuous investment in research and development by pharmaceutical and biotechnology companies, along with academic collaborations, is accelerating innovation, improving clinical validation, and increasing the availability of advanced theragnostic products globally.

Market Restraints:

  • High Cost and Limited Accessibility

High development, production, and implementation costs remain a key restraint for the global theragnostics market. Advanced imaging equipment, radiopharmaceutical manufacturing, and specialized infrastructure require significant capital investment. Additionally, theragnostic procedures often involve complex regulatory approvals and skilled professionals, increasing overall healthcare costs. These factors limit adoption in low- and middle-income regions and smaller healthcare facilities. Reimbursement challenges and unequal access to advanced diagnostic technologies further restrict market penetration. Without broader insurance coverage and cost-effective solutions, the widespread adoption of theragnostics may remain uneven across different geographic and socioeconomic settings.

Socioeconomic Impact on Global Theragnostics Market 

Theragnostics significantly influences healthcare outcomes and economic frameworks by promoting personalized treatment, reducing ineffective therapies, and improving patient quality of life. Earlier and more precise diagnoses lower overall treatment costs through targeted interventions and reduced hospital stays. This approach benefits aging populations and patients with chronic diseases, particularly in oncology where tailored treatments enhance survival rates. Economies with advanced healthcare infrastructure see increased investment in high-tech diagnostics and skilled workforce development. However, equitable access remains a concern in lower-income regions due to high technology costs. Policymakers and stakeholders must address affordability and infrastructure gaps to ensure widespread socioeconomic benefits of theragnostics.

Segmental Analysis

  • Radiopharmaceuticals segment is expected to witness highest growth over the forecast period

The radiopharmaceuticals segment is expected to witness the highest growth over the forecast period due to increasing adoption of targeted nuclear therapies and advanced diagnostic imaging. These agents enable precise tumor localization, real-time disease monitoring, and targeted treatment delivery, especially in oncology. Growing approvals of novel radioligand therapies, rising investments in nuclear medicine infrastructure, and expanding clinical applications drive segment growth. Additionally, technological advancements in isotope production and imaging modalities such as PET and SPECT enhance clinical efficiency. Increasing prevalence of cancer and demand for personalized, minimally invasive treatment options further accelerate growth of the radiopharmaceuticals segment globally.

  • Genomics & Proteomics segment is expected to witness highest growth over the forecast period

The genomics and proteomics segment is expected to experience the highest growth over the forecast period due to its critical role in biomarker identification and precision medicine. Advances in sequencing technologies, bioinformatics, and molecular profiling enable accurate disease characterization and therapy selection. These tools support early diagnosis and prediction of treatment response, particularly in cancer and rare diseases. Declining sequencing costs, increasing research funding, and growing clinical adoption of companion diagnostics contribute to rapid expansion. Integration of genomics and proteomics with theragnostic platforms enhances personalized care, driving strong demand across healthcare and research settings.

  • Oncology segment is expected to witness highest growth over the forecast period

The oncology segment is projected to witness the highest growth over the forecast period, driven by the rising global cancer burden and increasing demand for targeted therapies. Theragnostics plays a crucial role in cancer care by enabling accurate tumor detection, patient stratification, and personalized treatment planning. Radioligand therapies and molecular diagnostics significantly improve treatment outcomes while reducing side effects. Growing clinical evidence supporting theragnostic approaches, along with increased investment in oncology research, accelerates adoption. Additionally, favorable regulatory support for cancer diagnostics and therapeutics further strengthens the growth of the oncology segment worldwide.

  • Hospitals segment is expected to witness highest growth over the forecast period

The hospitals segment is expected to witness the highest growth over the forecast period due to the increasing integration of advanced diagnostic and therapeutic technologies within hospital settings. Hospitals serve as primary centers for cancer diagnosis, imaging, and treatment, making them key end users of theragnostic solutions. Availability of skilled professionals, advanced infrastructure, and multidisciplinary care teams supports effective implementation. Rising patient volumes, increasing preference for centralized care, and expansion of nuclear medicine departments further drive growth. Additionally, improved reimbursement policies and hospital investments in precision medicine technologies enhance adoption of theragnostics in hospitals.

  • North America Region is expected to witness highest growth over the forecast period

North America is expected to witness the highest growth over the forecast period due to strong healthcare infrastructure, high adoption of advanced medical technologies, and significant investment in research and development. For instance, in October 2025, INITIO Medical’s recognition as the first ICPO Theranostics Clinical Center of Excellence in North America advanced imaging and molecular technologies by setting high standards in theranostic practices. This accreditation strengthened North America’s theragnostics market by promoting clinical excellence, supporting adoption of cutting-edge diagnostics and targeted therapies, and reinforcing the region’s leadership in precision, patient-centered cancer care.

The region benefits from early adoption of precision medicine, widespread availability of nuclear imaging facilities, and presence of leading market players. High cancer prevalence, favorable regulatory frameworks, and supportive reimbursement policies further drive market growth. For instance, in June 2025, The FDA granted RAD101 fast track designation to accelerate its development and review for distinguishing recurrent brain metastases from treatment effects, including leptomeningeal cases. Targeting fatty acid synthase (FASN), this approval advanced precision imaging, supporting faster clinical adoption and improving diagnostic accuracy in neuro-oncology theranostics.

Additionally, strong collaboration between pharmaceutical companies, research institutions, and healthcare providers accelerates innovation and commercialization of theragnostic solutions across the region.

Theragnostics Market Competitive Landscape

The global theragnostics market features competition among pharmaceutical companies, diagnostic developers, and biotechnology firms specializing in targeted therapies and imaging agents. Leading players invest heavily in R&D, strategic collaborations, and mergers to expand product portfolios and secure regulatory approvals. Competition centers on innovation in radiopharmaceuticals, companion diagnostics, and integrated treatment platforms. Larger multinational corporations often partner with academic institutions and research organizations to accelerate clinical trials. Market entry barriers include stringent regulatory pathways and substantial development costs. Emerging companies focus on niche applications and regional markets to differentiate. Ultimately, companies that deliver clinically validated, cost-effective, and scalable theragnostic solutions gain competitive advantage.

The major players for this market are:

  • Novartis AG
  • GE Healthcare
  • Siemens Healthineers
  • Bayer AG
  • Thermo Fisher Scientific Inc.
  • Lantheus Holdings, Inc.
  • Curium Pharma
  • Bracco Imaging S.p.A.
  • Cardinal Health, Inc.
  • Telix Pharmaceuticals Limited
  • Eckert & Ziegler AG
  • SOFIE Biosciences
  • Isotopia Molecular Imaging Ltd.
  • NorthStar Medical Radioisotopes LLC
  • Roche Holding AG
  • Illumina Inc.
  • QIAGEN N.V.
  • Philips Healthcare
  • NanoString Technologies, Inc.

Recent Development

  • In November 2025, The joint launch of the Molecular Imaging and Theranostics Centre by NUH and NUS Medicine strengthened the global theragnostics market by advancing integrated diagnostics, targeted therapy, and translational research. This development accelerated innovation in molecular imaging, enhanced clinical adoption of theragnostic solutions, and reinforced Singapore’s role as a leading hub for precision medicine and advanced healthcare technologies in the Asia-Pacific region.


  • In June 2025, GE HealthCare advanced the global theragnostics market by strengthening clinical and operational capabilities in molecular imaging through its AI-enabled imaging systems, radiopharmaceuticals, and workflow software. The introduction of LesionID™ Pro at SNMMI25 improved efficiency by reducing manual segmentation, enabling faster access to patient-specific insights and supporting confident, data-driven decision-making in precision theragnostic care worldwide.


Frequently Asked Questions (FAQ) :

Q1. What are the main growth-driving factors for this market?

The primary driver is the shift toward personalized medicine, where diagnosis and therapy are integrated into a single platform. Rising cancer prevalence and the success of radiopharmaceuticals in treating prostate and neuroendocrine tumors fuel growth. Additionally, advancements in molecular imaging and increased funding for precision oncology research accelerate market adoption.

Q2. What are the main restraining factors for this market?

Growth is hindered by the high cost of developing and implementing theragnostic procedures, which often require expensive specialized equipment and radionuclides. Complex regulatory pathways and the need for seamless coordination between diagnostic and therapeutic teams also pose challenges. Furthermore, limited availability of medical isotopes and specialized training for clinicians restricts widespread use.

Q3. Which segment is expected to witness high growth?

The Oncology segment, particularly Radiopharmaceuticals, is expected to see the highest growth. This is driven by the clinical success of "see-and-treat" pairings like Lutetium-177 for prostate cancer. As more targeted ligands are developed for various solid tumors, the demand for these precision-strike therapies continues to surge in clinical settings.

Q4. Who are the top major players for this market?

The market is led by global pharmaceutical and diagnostic giants. Key players include Novartis (Advanced Accelerator Applications), GE HealthCare, Siemens Healthineers, Thermo Fisher Scientific, and Lantheus Holdings. These companies dominate by securing patents for novel isotopes and integrating advanced imaging technology with innovative therapeutic drug delivery systems.

Q5. Which country is the largest player?

The United States is the largest player in the theragnostics market. Its dominance is supported by a highly advanced healthcare infrastructure, significant investment in biotechnology, and early adoption of FDA-approved radioligand therapies. The presence of leading research institutions and a strong focus on precision medicine keep the U.S. in the lead.

Theragnostics MARKET STUDY GLOBAL MARKET ANALYSIS, INSIGHTS AND FORECAST, 2020-2027

    1. Introduction

    • 1.1. Research Scope
    • 1.2. Market Segmentation
    • 1.3. Research Methodology
    • 1.4. Definitions and Assumptions

    2. Executive Summary

      3. Market Dynamics

      • 3.1. Market Drivers
      • 3.2. Market Restraints
      • 3.3. Market Opportunities

      4. Key Insights

      • 4.1. Key Emerging Trends – For Major Countries
      • 4.2. Latest Technological Advancement
      • 4.3. Regulatory Landscape
      • 4.4. Industry SWOT Analysis
      • 4.5. Porters Five Forces Analysis

      5. Global Theragnostics Market Analysis (USD Billion), Insights and Forecast, 2016-2027

      • 5.1. Key Findings / Summary
      • 5.2. Market Analysis, Insights and Forecast – By Segment 1
        • 5.2.1. Sub-Segment 1
        • 5.2.2. Sub-Segment 2
      • 5.3. Market Analysis, Insights and Forecast – By Segment 2
        • 5.3.1. Sub-Segment 1
        • 5.3.2. Sub-Segment 2
        • 5.3.3. Sub-Segment 3
        • 5.3.4. Others
      • 5.4. Market Analysis, Insights and Forecast – By Segment 3
        • 5.4.1. Sub-Segment 1
        • 5.4.2. Sub-Segment 2
        • 5.4.3. Sub-Segment 3
        • 5.4.4. Others
      • 5.5. Market Analysis, Insights and Forecast – By Region
        • 5.5.1. North America
        • 5.5.2. Latin America
        • 5.5.3. Europe
        • 5.5.4. Asia Pacific
        • 5.5.5. Middle East and Africa

      6. North America Theragnostics Market Analysis (USD Billion), Insights and Forecast, 2016-2027

      • 6.1. Key Findings / Summary
      • 6.2. Market Analysis, Insights and Forecast – By Segment 1
        • 6.2.1. Sub-Segment 1
        • 6.2.2. Sub-Segment 2
      • 6.3. Market Analysis, Insights and Forecast – By Segment 2
        • 6.3.1. Sub-Segment 1
        • 6.3.2. Sub-Segment 2
        • 6.3.3. Sub-Segment 3
        • 6.3.4. Others
      • 6.4. Market Analysis, Insights and Forecast – By Segment 3
        • 6.4.1. Sub-Segment 1
        • 6.4.2. Sub-Segment 2
        • 6.4.3. Sub-Segment 3
        • 6.4.4. Others
      • 6.5. Market Analysis, Insights and Forecast – By Country
        • 6.5.1. U.S.
        • 6.5.2. Canada

      7. Latin America Theragnostics Market Analysis (USD Billion), Insights and Forecast, 2016-2027

      • 7.1. Key Findings / Summary
      • 7.2. Market Analysis, Insights and Forecast – By Segment 1
        • 7.2.1. Sub-Segment 1
        • 7.2.2. Sub-Segment 2
      • 7.3. Market Analysis, Insights and Forecast – By Segment 2
        • 7.3.1. Sub-Segment 1
        • 7.3.2. Sub-Segment 2
        • 7.3.3. Sub-Segment 3
        • 7.3.4. Others
      • 7.4. Market Analysis, Insights and Forecast – By Segment 3
        • 7.4.1. Sub-Segment 1
        • 7.4.2. Sub-Segment 2
        • 7.4.3. Sub-Segment 3
        • 7.4.4. Others
      • 7.5. Insights and Forecast – By Country
        • 7.5.1. Brazil
        • 7.5.2. Mexico
        • 7.5.3. Rest of Latin America

      8. Europe Theragnostics Market Analysis (USD Billion), Insights and Forecast, 2016-2027

      • 8.1. Key Findings / Summary
      • 8.2. Market Analysis, Insights and Forecast – By Segment 1
        • 8.2.1. Sub-Segment 1
        • 8.2.2. Sub-Segment 2
      • 8.3. Market Analysis, Insights and Forecast – By Segment 2
        • 8.3.1. Sub-Segment 1
        • 8.3.2. Sub-Segment 2
        • 8.3.3. Sub-Segment 3
        • 8.3.4. Others
      • 8.4. Market Analysis, Insights and Forecast – By Segment 3
        • 8.4.1. Sub-Segment 1
        • 8.4.2. Sub-Segment 2
        • 8.4.3. Sub-Segment 3
        • 8.4.4. Others
      • 8.5. Market Analysis, Insights and Forecast – By Country
        • 8.5.1. UK
        • 8.5.2. Germany
        • 8.5.3. France
        • 8.5.4. Italy
        • 8.5.5. Spain
        • 8.5.6. Russia
        • 8.5.7. Rest of Europe

      9. Asia Pacific Theragnostics Market Analysis (USD Billion), Insights and Forecast, 2016-2027

      • 9.1. Key Findings / Summary
      • 9.2. Market Analysis, Insights and Forecast – By Segment 1
        • 9.2.1. Sub-Segment 1
        • 9.2.2. Sub-Segment 2
      • 9.3. Market Analysis, Insights and Forecast – By Segment 2
        • 9.3.1. Sub-Segment 1
        • 9.3.2. Sub-Segment 2
        • 9.3.3. Sub-Segment 3
        • 9.3.4. Others
      • 9.4. Market Analysis, Insights and Forecast – By Segment 3
        • 9.4.1. Sub-Segment 1
        • 9.4.2. Sub-Segment 2
        • 9.4.3. Sub-Segment 3
        • 9.4.4. Others
      • 9.5. Market Analysis, Insights and Forecast – By Country
        • 9.5.1. China
        • 9.5.2. India
        • 9.5.3. Japan
        • 9.5.4. Australia
        • 9.5.5. South East Asia
        • 9.5.6. Rest of Asia Pacific

      10. Middle East & Africa Theragnostics Market Analysis (USD Billion), Insights and Forecast, 2016-2027

      • 10.1. Key Findings / Summary
      • 10.2. Market Analysis, Insights and Forecast – By Segment 1
        • 10.2.1. Sub-Segment 1
        • 10.2.2. Sub-Segment 2
      • 10.3. Market Analysis, Insights and Forecast – By Segment 2
        • 10.3.1. Sub-Segment 1
        • 10.3.2. Sub-Segment 2
        • 10.3.3. Sub-Segment 3
        • 10.3.4. Others
      • 10.4. Market Analysis, Insights and Forecast – By Segment 3
        • 10.4.1. Sub-Segment 1
        • 10.4.2. Sub-Segment 2
        • 10.4.3. Sub-Segment 3
        • 10.4.4. Others
      • 10.5. Market Analysis, Insights and Forecast – By Country
        • 10.5.1. GCC
        • 10.5.2. South Africa
        • 10.5.3. Rest of Middle East & Africa

      11. Competitive Analysis

      • 11.1. Company Market Share Analysis, 2018
      • 11.2. Key Industry Developments
      • 11.3. Company Profile
        • 11.3.1. Company 1
          • 11.3.1.1. Business Overview
          • 11.3.1.2. Segment 1 & Service Offering
          • 11.3.1.3. Overall Revenue
          • 11.3.1.4. Geographic Presence
          • 11.3.1.5. Recent Development
        *Similar details will be provided for the following companies
        • 11.3.2. Company 2
        • 11.3.3. Company 3
        • 11.3.4. Company 4
        • 11.3.5. Company 5
        • 11.3.6. Company 6
        • 11.3.7. Company 7
        • 11.3.8. Company 8
        • 11.3.9. Company 9
        • 11.3.10. Company 10
        • 11.3.11. Company 11
        • 11.3.12. Company 12
      List of Figures

      Figure 1: Global Theragnostics Market Revenue Breakdown (USD Billion, %) by Region, 2019 & 2027
      Figure 2: Global Theragnostics Market Value Share (%), By Segment 1, 2019 & 2027
      Figure 3: Global Theragnostics Market Forecast (USD Billion), by Sub-Segment 1, 2016-2027
      Figure 4: Global Theragnostics Market Forecast (USD Billion), by Sub-Segment 2, 2016-2027
      Figure 5: Global Theragnostics Market Value Share (%), By Segment 2, 2019 & 2027
      Figure 6: Global Theragnostics Market Forecast (USD Billion), by Sub-Segment 1, 2016-2027
      Figure 7: Global Theragnostics Market Forecast (USD Billion), by Sub-Segment 2, 2016-2027
      Figure 8: Global Theragnostics Market Forecast (USD Billion), by Sub-Segment 3, 2016-2027
      Figure 9: Global Theragnostics Market Forecast (USD Billion), by Others, 2016-2027
      Figure 10: Global Theragnostics Market Value Share (%), By Segment 3, 2019 & 2027
      Figure 11: Global Theragnostics Market Forecast (USD Billion), by Sub-Segment 1, 2016-2027
      Figure 12: Global Theragnostics Market Forecast (USD Billion), by Sub-Segment 2, 2016-2027
      Figure 13: Global Theragnostics Market Forecast (USD Billion), by Sub-Segment 3, 2016-2027
      Figure 14: Global Theragnostics Market Forecast (USD Billion), by Others, 2016-2027
      Figure 15: Global Theragnostics Market Value (USD Billion), by Region, 2019 & 2027
      Figure 16: North America Theragnostics Market Value Share (%), By Segment 1, 2019 & 2027
      Figure 17: North America Theragnostics Market Forecast (USD Billion), by Sub-Segment 1, 2016-2027
      Figure 18: North America Theragnostics Market Forecast (USD Billion), by Sub-Segment 2, 2016-2027
      Figure 19: North America Theragnostics Market Value Share (%), By Segment 2, 2019 & 2027
      Figure 20: North America Theragnostics Market Forecast (USD Billion), by Sub-Segment 1, 2016-2027
      Figure 21: North America Theragnostics Market Forecast (USD Billion), by Sub-Segment 2, 2016-2027
      Figure 22: North America Theragnostics Market Forecast (USD Billion), by Sub-Segment 3, 2016-2027
      Figure 23: North America Theragnostics Market Forecast (USD Billion), by Others, 2016-2027
      Figure 24: North America Theragnostics Market Value Share (%), By Segment 3, 2019 & 2027
      Figure 25: North America Theragnostics Market Forecast (USD Billion), by Sub-Segment 1, 2016-2027
      Figure 26: North America Theragnostics Market Forecast (USD Billion), by Sub-Segment 2, 2016-2027
      Figure 27: North America Theragnostics Market Forecast (USD Billion), by Sub-Segment 3, 2016-2027
      Figure 28: North America Theragnostics Market Forecast (USD Billion), by Others, 2016-2027
      Figure 29: North America Theragnostics Market Forecast (USD Billion), by U.S., 2016-2027
      Figure 30: North America Theragnostics Market Forecast (USD Billion), by Canada, 2016-2027
      Figure 31: Latin America Theragnostics Market Value Share (%), By Segment 1, 2019 & 2027
      Figure 32: Latin America Theragnostics Market Forecast (USD Billion), by Sub-Segment 1, 2016-2027
      Figure 33: Latin America Theragnostics Market Forecast (USD Billion), by Sub-Segment 2, 2016-2027
      Figure 34: Latin America Theragnostics Market Value Share (%), By Segment 2, 2019 & 2027
      Figure 35: Latin America Theragnostics Market Forecast (USD Billion), by Sub-Segment 1, 2016-2027
      Figure 36: Latin America Theragnostics Market Forecast (USD Billion), by Sub-Segment 2, 2016-2027
      Figure 37: Latin America Theragnostics Market Forecast (USD Billion), by Sub-Segment 3, 2016-2027
      Figure 38: Latin America Theragnostics Market Forecast (USD Billion), by Others, 2016-2027
      Figure 39: Latin America Theragnostics Market Value Share (%), By Segment 3, 2019 & 2027
      Figure 40: Latin America Theragnostics Market Forecast (USD Billion), by Sub-Segment 1, 2016-2027
      Figure 41: Latin America Theragnostics Market Forecast (USD Billion), by Sub-Segment 2, 2016-2027
      Figure 42: Latin America Theragnostics Market Forecast (USD Billion), by Sub-Segment 3, 2016-2027
      Figure 43: Latin America Theragnostics Market Forecast (USD Billion), by Others, 2016-2027
      Figure 44: Latin America Theragnostics Market Forecast (USD Billion), by Brazil, 2016-2027
      Figure 45: Latin America Theragnostics Market Forecast (USD Billion), by Mexico, 2016-2027
      Figure 46: Latin America Theragnostics Market Forecast (USD Billion), by Rest of Latin America, 2016-2027
      Figure 47: Europe Theragnostics Market Value Share (%), By Segment 1, 2019 & 2027
      Figure 48: Europe Theragnostics Market Forecast (USD Billion), by Sub-Segment 1, 2016-2027
      Figure 49: Europe Theragnostics Market Forecast (USD Billion), by Sub-Segment 2, 2016-2027
      Figure 50: Europe Theragnostics Market Value Share (%), By Segment 2, 2019 & 2027
      Figure 51: Europe Theragnostics Market Forecast (USD Billion), by Sub-Segment 1, 2016-2027
      Figure 52: Europe Theragnostics Market Forecast (USD Billion), by Sub-Segment 2, 2016-2027
      Figure 53: Europe Theragnostics Market Forecast (USD Billion), by Sub-Segment 3, 2016-2027
      Figure 54: Europe Theragnostics Market Forecast (USD Billion), by Others, 2016-2027
      Figure 55: Europe Theragnostics Market Value Share (%), By Segment 3, 2019 & 2027
      Figure 56: Europe Theragnostics Market Forecast (USD Billion), by Sub-Segment 1, 2016-2027
      Figure 57: Europe Theragnostics Market Forecast (USD Billion), by Sub-Segment 2, 2016-2027
      Figure 58: Europe Theragnostics Market Forecast (USD Billion), by Sub-Segment 3, 2016-2027
      Figure 59: Europe Theragnostics Market Forecast (USD Billion), by Others, 2016-2027
      Figure 60: Europe Theragnostics Market Forecast (USD Billion), by U.K., 2016-2027
      Figure 61: Europe Theragnostics Market Forecast (USD Billion), by Germany, 2016-2027
      Figure 62: Europe Theragnostics Market Forecast (USD Billion), by France, 2016-2027
      Figure 63: Europe Theragnostics Market Forecast (USD Billion), by Italy, 2016-2027
      Figure 64: Europe Theragnostics Market Forecast (USD Billion), by Spain, 2016-2027
      Figure 65: Europe Theragnostics Market Forecast (USD Billion), by Russia, 2016-2027
      Figure 66: Europe Theragnostics Market Forecast (USD Billion), by Rest of Europe, 2016-2027
      Figure 67: Asia Pacific Theragnostics Market Value Share (%), By Segment 1, 2019 & 2027
      Figure 68: Asia Pacific Theragnostics Market Forecast (USD Billion), by Sub-Segment 1, 2016-2027
      Figure 69: Asia Pacific Theragnostics Market Forecast (USD Billion), by Sub-Segment 2, 2016-2027
      Figure 70: Asia Pacific Theragnostics Market Value Share (%), By Segment 2, 2019 & 2027
      Figure 71: Asia Pacific Theragnostics Market Forecast (USD Billion), by Sub-Segment 1, 2016-2027
      Figure 72: Asia Pacific Theragnostics Market Forecast (USD Billion), by Sub-Segment 2, 2016-2027
      Figure 73: Asia Pacific Theragnostics Market Forecast (USD Billion), by Sub-Segment 3, 2016-2027
      Figure 74: Asia Pacific Theragnostics Market Forecast (USD Billion), by Others, 2016-2027
      Figure 75: Asia Pacific Theragnostics Market Value Share (%), By Segment 3, 2019 & 2027
      Figure 76: Asia Pacific Theragnostics Market Forecast (USD Billion), by Sub-Segment 1, 2016-2027
      Figure 77: Asia Pacific Theragnostics Market Forecast (USD Billion), by Sub-Segment 2, 2016-2027
      Figure 78: Asia Pacific Theragnostics Market Forecast (USD Billion), by Sub-Segment 3, 2016-2027
      Figure 79: Asia Pacific Theragnostics Market Forecast (USD Billion), by Others, 2016-2027
      Figure 80: Asia Pacific Theragnostics Market Forecast (USD Billion), by China, 2016-2027
      Figure 81: Asia Pacific Theragnostics Market Forecast (USD Billion), by India, 2016-2027
      Figure 82: Asia Pacific Theragnostics Market Forecast (USD Billion), by Japan, 2016-2027
      Figure 83: Asia Pacific Theragnostics Market Forecast (USD Billion), by Australia, 2016-2027
      Figure 84: Asia Pacific Theragnostics Market Forecast (USD Billion), by Southeast Asia, 2016-2027
      Figure 85: Asia Pacific Theragnostics Market Forecast (USD Billion), by Rest of Asia Pacific, 2016-2027
      Figure 86: Middle East & Africa Theragnostics Market Value Share (%), By Segment 1, 2019 & 2027
      Figure 87: Middle East & Africa Theragnostics Market Forecast (USD Billion), by Sub-Segment 1, 2016-2027
      Figure 88: Middle East & Africa Theragnostics Market Forecast (USD Billion), by Sub-Segment 2, 2016-2027
      Figure 89: Middle East & Africa Theragnostics Market Value Share (%), By Segment 2, 2019 & 2027
      Figure 90: Middle East & Africa Theragnostics Market Forecast (USD Billion), by Sub-Segment 1, 2016-2027
      Figure 91: Middle East & Africa Theragnostics Market Forecast (USD Billion), by Sub-Segment 2, 2016-2027
      Figure 92: Middle East & Africa Theragnostics Market Forecast (USD Billion), by Sub-Segment 3, 2016-2027
      Figure 93: Middle East & Africa Theragnostics Market Forecast (USD Billion), by Others, 2016-2027
      Figure 94: Middle East & Africa Theragnostics Market Value Share (%), By Segment 3, 2019 & 2027
      Figure 95: Middle East & Africa Theragnostics Market Forecast (USD Billion), by Sub-Segment 1, 2016-2027
      Figure 96: Middle East & Africa Theragnostics Market Forecast (USD Billion), by Sub-Segment 2, 2016-2027
      Figure 97: Middle East & Africa Theragnostics Market Forecast (USD Billion), by Sub-Segment 3, 2016-2027
      Figure 98: Middle East & Africa Theragnostics Market Forecast (USD Billion), by Others, 2016-2027
      Figure 99: Middle East & Africa Theragnostics Market Forecast (USD Billion), by GCC, 2016-2027
      Figure 100: Middle East & Africa Theragnostics Market Forecast (USD Billion), by South Africa, 2016-2027
      Figure 101: Middle East & Africa Theragnostics Market Forecast (USD Billion), by Rest of Middle East & Africa, 2016-2027 
      List of Tables
      Table 1: Global Theragnostics Market Revenue (USD Billion) Forecast, by Segment 1, 2016-2027
      Table 2: Global Theragnostics Market Revenue (USD Billion) Forecast, by Segment 2, 2016-2027
      Table 3: Global Theragnostics Market Revenue (USD Billion) Forecast, by Segment 3, 2016-2027
      Table 4: Global Theragnostics Market Revenue (USD Billion) Forecast, by Region, 2016-2027
      Table 5: North America Theragnostics Market Revenue (USD Billion) Forecast, by Segment 1, 2016-2027
      Table 6: North America Theragnostics Market Revenue (USD Billion) Forecast, by Segment 2, 2016-2027
      Table 7: North America Theragnostics Market Revenue (USD Billion) Forecast, by Segment 3, 2016-2027
      Table 8: North America Theragnostics Market Revenue (USD Billion) Forecast, by Country, 2016-2027
      Table 9: Europe Theragnostics Market Revenue (USD Billion) Forecast, by Segment 1, 2016-2027
      Table 10: Europe Theragnostics Market Revenue (USD Billion) Forecast, by Segment 2, 2016-2027
      Table 11: Europe Theragnostics Market Revenue (USD Billion) Forecast, by Segment 3, 2016-2027
      Table 12: Europe Theragnostics Market Revenue (USD Billion) Forecast, by Country, 2016-2027
      Table 13: Latin America Theragnostics Market Revenue (USD Billion) Forecast, by Segment 1, 2016-2027
      Table 14: Latin America Theragnostics Market Revenue (USD Billion) Forecast, by Segment 2, 2016-2027
      Table 15: Latin America Theragnostics Market Revenue (USD Billion) Forecast, by Segment 3, 2016-2027
      Table 16: Latin America Theragnostics Market Revenue (USD Billion) Forecast, by Country, 2016-2027
      Table 17: Asia Pacific Theragnostics Market Revenue (USD Billion) Forecast, by Segment 1, 2016-2027
      Table 18: Asia Pacific Theragnostics Market Revenue (USD Billion) Forecast, by Segment 2, 2016-2027
      Table 19: Asia Pacific Theragnostics Market Revenue (USD Billion) Forecast, by Segment 3, 2016-2027
      Table 20: Asia Pacific Theragnostics Market Revenue (USD Billion) Forecast, by Country, 2016-2027
      Table 21: Middle East & Africa Theragnostics Market Revenue (USD Billion) Forecast, by Segment 1, 2016-2027
      Table 22: Middle East & Africa Theragnostics Market Revenue (USD Billion) Forecast, by Segment 2, 2016-2027
      Table 23: Middle East & Africa Theragnostics Market Revenue (USD Billion) Forecast, by Segment 3, 2016-2027
      Table 24: Middle East & Africa Theragnostics Market Revenue (USD Billion) Forecast, by Country, 2016-2027
      Research Process

      Data Library Research are conducted by industry experts who offer insight on industry structure, market segmentations technology assessment and competitive landscape (CL), and penetration, as well as on emerging trends. Their analysis is based on primary interviews (~ 80%) and secondary research (~ 20%) as well as years of professional expertise in their respective industries. Adding to this, by analysing historical trends and current market positions, our analysts predict where the market will be headed for the next five years. Furthermore, the varying trends of segment & categories geographically presented are also studied and the estimated based on the primary & secondary research.

      In this particular report from the supply side Data Library Research has conducted primary surveys (interviews) with the key level executives (VP, CEO’s, Marketing Director, Business Development Manager and SOFT) of the companies that active & prominent as well as the midsized organization

      FIGURE 1: DLR RESEARH PROCESS

      research-methodology1

      Primary Research

      Extensive primary research was conducted to gain a deeper insight of the market and industry performance. The analysis is based on both primary and secondary research as well as years of professional expertise in the respective industries.

      In addition to analysing current and historical trends, our analysts predict where the market is headed over the next five years.

      It varies by segment for these categories geographically presented in the list of market tables. Speaking about this particular report we have conducted primary surveys (interviews) with the key level executives (VP, CEO’s, Marketing Director, Business Development Manager and many more) of the major players active in the market.

      Secondary Research

      Secondary research was mainly used to collect and identify information useful for the extensive, technical, market-oriented, and Friend’s study of the Global Extra Neutral Alcohol. It was also used to obtain key information about major players, market classification and segmentation according to the industry trends, geographical markets, and developments related to the market and technology perspectives. For this study, analysts have gathered information from various credible sources, such as annual reports, sec filings, journals, white papers, SOFT presentations, and company web sites.

      Market Size Estimation

      Both, top-down and bottom-up approaches were used to estimate and validate the size of the Global market and to estimate the size of various other dependent submarkets in the overall Extra Neutral Alcohol. The key players in the market were identified through secondary research and their market contributions in the respective geographies were determined through primary and secondary research.

      Forecast Model

      research-methodology2