Voice-activated Sensor Switch Market Overview and Analysis
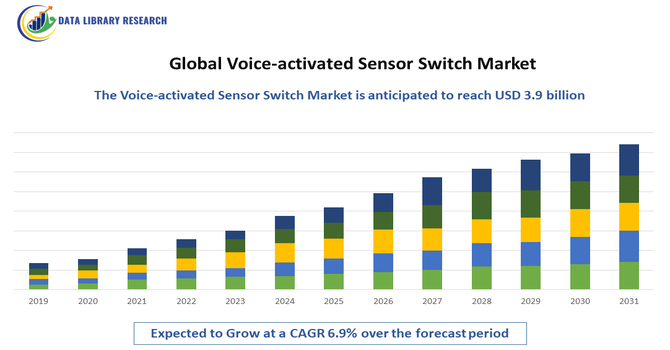
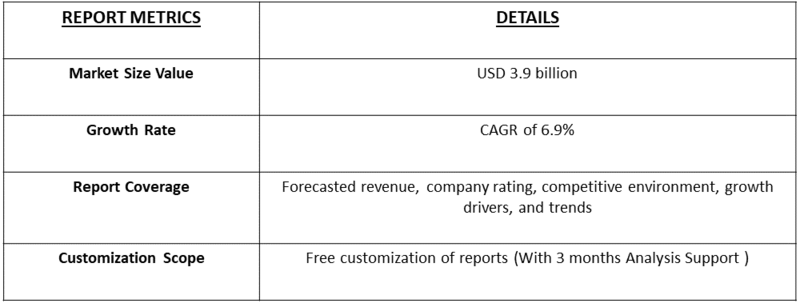
- The Global Voice-Activated Sensor Switch Market Revenue was valued at USD 1.8 billion in 2025 and is estimated to reach USD 3.9 billion by 2032, growing with a CAGR of 6.9% from 2025-2032.
Get Complete Analysis Of The Report - Download Updated Free Sample PDF
The Global Voice-Activated Sensor Switch Market refers to the industry focused on switches and control devices that respond to voice commands, allowing users to operate lighting, appliances, and electronic systems hands-free. These switches combine voice recognition technology with sensors to enhance convenience, energy efficiency, and accessibility.
The growth of the Global Voice-Activated Sensor Switch Market has been driven by increasing adoption of smart home and building automation technologies, rising consumer demand for convenience and hands-free control, and the need for energy-efficient solutions. Integration with IoT devices and virtual assistants, such as Alexa and Google Assistant, has enhanced functionality, while aging populations and accessibility requirements have expanded demand. Additionally, growing awareness of hygiene and touchless solutions has accelerated market adoption across residential, commercial, and industrial sectors.
Voice-activated Sensor Switch Market Latest Trends:
The Global Voice Activated Sensor Switch Market trended strongly toward edge first voice recognition, where devices process speech commands locally to improve privacy and reduce cloud dependence. Integration with major voice ecosystems like Alexa and Google Assistant remained critical, while vendors pushed for tighter interoperability with building automation standards (BACnet, Modbus, KNX). Industrial growth came from rugged, safety certified voice switches for hands free machine control.
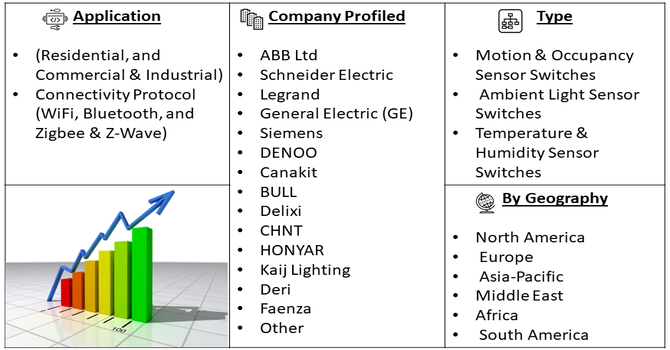
Segmentation: The Voice-activated Sensor Switch Market is segmented by Sensor Type (Motion & Occupancy Sensor Switches, Ambient Light Sensor Switches and Temperature & Humidity Sensor Switches), Application (Residential, and Commercial & Industrial), Connectivity Protocol (WiFi, Bluetooth, and Zigbee & Z-Wave), and Geography (North America, Europe, Asia-Pacific, Middle East and Africa, and South America). The report provides the value (in USD million) for the above segments.
For Detailed Market Segmentation - Get a Free Sample PDF
Market Drivers:
- Growing Smart Home Adoption
The increasing adoption of smart homes globally significantly drove the Voice-Activated Sensor Switch Market. Consumers preferred hands-free control for lighting, appliances, and security systems, enhancing convenience and energy efficiency. Integration with virtual assistants like Amazon Alexa, Google Assistant, and Apple HomeKit further fueled demand. Rising awareness of IoT-enabled devices and connected ecosystems encouraged households to replace conventional switches with smart, voice-controlled alternatives. Additionally, government incentives promoting energy-efficient solutions and smart building initiatives in residential and commercial spaces supported market growth, positioning voice-activated switches as essential components of modern automated environments.
- Demand for Touchless and Hygienic Solutions
Rising health awareness and the need for hygienic, touchless environments accelerated adoption of voice-activated sensor switches. Offices, hospitals, and public spaces preferred hands-free operation to reduce germ transmission and improve safety. Industrial and healthcare sectors increasingly relied on voice control for equipment operation and patient-room management. This trend also extended to luxury residential settings, where consumers sought modern, convenient, and safe smart home solutions. The combination of hygiene, accessibility, and user comfort positioned voice-activated switches as a premium, high-demand product, boosting market growth across multiple verticals and regions.
Market Restraints
- High Initial Cost and Integration Challenges
The market faced restraints due to the high initial cost of voice-activated sensor switches compared to conventional systems. Integration with existing electrical infrastructure and compatibility with multiple voice platforms often required technical expertise, limiting adoption in price-sensitive regions. Consumers and businesses were sometimes hesitant to invest in advanced switches without proven long-term benefits or clear ROI. Privacy and security concerns around voice recognition technology further slowed adoption, as potential users worried about unauthorized access and data collection. These financial, technical, and security challenges acted as significant barriers to rapid expansion in certain markets, particularly in developing regions.
Socio Economic Impact on Voice-activated Sensor Switch Market
Voice activated sensor switches positively impacted society by making environments more accessible, hygienic, and efficient. In healthcare and assisted living facilities, these switches enabled touchless control, reducing infection risks and improving patient autonomy. In industrial settings, they enhanced safety by allowing hands free machine operations, increasing productivity. For homes, they offered convenience and energy savings, contributing to sustainability efforts. Overall, the technology supported inclusive smart living, improved quality of life for the elderly or disabled, and backed green building trends by enabling smarter energy management.
Segmental Analysis:
- Motion & Occupancy Sensor Switches segment is expected to witness highest growth over the forecast period
The Motion & Occupancy Sensor Switches segment is expected to witness the highest growth over the forecast period due to increasing demand for energy-efficient and automated lighting solutions. These switches detect human presence and adjust lighting accordingly, reducing unnecessary power consumption in residential, commercial, and industrial settings. Growing adoption of smart building technologies and stricter government regulations on energy conservation have accelerated this segment's expansion. Moreover, advancements in sensor accuracy and affordability make motion and occupancy sensors increasingly attractive for retrofit projects and new constructions, boosting market penetration. This segment’s ability to enhance convenience and sustainability is driving widespread adoption, positioning it as a key growth area in the voice-activated sensor switch market.
- Commercial & Industrial segment is expected to witness highest growth over the forecast period
The Commercial & Industrial segment is projected to experience the highest growth during the forecast period, driven by increasing automation and smart infrastructure investments. Businesses are adopting voice-activated and sensor-enabled switches to improve operational efficiency, safety, and energy management. Industrial facilities benefit from hands-free control to enhance productivity and reduce contamination risks, especially in cleanroom and healthcare environments. Furthermore, commercial real estate developers and facility managers prioritize smart technologies to meet sustainability goals and comply with energy regulations. The rise in smart offices, factories, and warehouses adopting IoT solutions further propels this segment, making it a major driver in the global voice-activated sensor switch market’s expansion.
- Bluetooth segment is expected to witness highest growth over the forecast period
The Bluetooth segment is expected to register the highest growth over the forecast period due to its versatility, low power consumption, and ease of integration with various smart devices. Bluetooth-enabled voice-activated sensor switches offer seamless wireless connectivity and interoperability with smartphones, tablets, and home automation hubs. As consumer preference shifts toward smart homes with customizable, app-controlled systems, Bluetooth technology provides cost-effective, reliable solutions that enhance user experience. Additionally, Bluetooth mesh networking enables extended coverage and scalability in commercial and industrial environments. Increasing adoption of Bluetooth 5.0 and later versions, with improved speed and range, further supports market growth, making it a preferred communication protocol in the voice-activated sensor switch market.
- North America region is expected to witness highest growth over the forecast period
North America is expected to witness the highest growth in the voice-activated sensor switch market during the forecast period, driven by advanced technological adoption and rising smart home penetration. The region benefits from a strong presence of leading technology companies, extensive R&D investments, and high consumer awareness of smart devices. Government incentives promoting energy-efficient buildings and sustainable infrastructure further encourage market expansion.
Additionally, North America’s robust commercial and industrial sectors increasingly integrate voice-activated solutions to improve operational efficiency and safety. The region’s well-established IoT ecosystem, combined with demand for touchless control and automation, positions it as a dominant and rapidly growing market for voice-activated sensor switches globally.
Moreover, the growing emphasis on health and hygiene, especially post-pandemic, has accelerated the adoption of voice-activated sensor switches in North America. Facilities such as hospitals, offices, and public spaces prefer touchless technology to reduce the spread of germs, enhancing safety and user convenience. Collaborations between technology providers and construction firms to integrate voice-activated systems during building design and renovation also contribute to market growth. These factors collectively make North America a key hub for innovation and adoption in the global voice-activated sensor switch market, ensuring sustained expansion throughout the forecast period.
To Learn More About This Report - Request a Free Sample Copy
Voice-activated Sensor Switch Market Competitive Landscape
The competitive landscape included major smart home and automation companies, such as ABB, Schneider Electric, Legrand, and Eaton, all offering voice activated sensor switching solutions. Edge recognition specialists provided always listening modules with minimal cloud use, while industrial vendors developed rugged, safety rated voice switches. AI and voice biometrics firms also joined in, offering analytics, authentication, and enterprise voice platforms. Companies competed on hardware quality, protocol compatibility, privacy, and low power consumption, driving innovation in both consumer and commercial segments.
The major players for this market are:
- ABB Ltd
- Schneider Electric
- Legrand
- General Electric (GE)
- Siemens
- DENOO
- Canakit
- BULL
- Delixi
- CHNT
- HONYAR
- Kaij Lighting
- Deri
- Faenza
- CHDELE
- Rockfile
- Soben
- TD (company)
- Sensory, Inc.
- Alps Alpine
Recent Development
- In November 2025, SwitchBot, a provider of AI-enabled home robotics, launched its battery-powered Presence Sensor, featuring a 60Hz mmWave radar, Passive Infrared (PIR) sensor, and light sensor. The device addressed limitations of traditional motion sensors, offering more precise room detection, enhanced lighting automation, and improved energy efficiency. It enabled smarter, hands-free control in everyday home environments, optimizing convenience and reducing energy consumption while integrating seamlessly with other smart home systems.
- In August 2025, Researchers at the Indian Institute of Technology Guwahati, in collaboration with Ohio State University, developed an underwater vibration sensor enabling automated, contactless voice recognition. This technology aimed to provide an alternative communication method for individuals with voice disabilities who struggled with traditional voice systems. Its innovation expanded accessibility options and demonstrated potential to enhance the Global Voice-Activated Sensor Switch Market by fostering inclusive applications and driving demand for adaptive, advanced sensor technologies. @@@@@
Frequently Asked Questions (FAQ) :
Q1. What are the main growth-driving factors for this market?
The primary driver is the pervasive adoption of smart speakers (like Amazon Alexa and Google Home) which act as the control hub for these switches. Consumers are increasingly demanding hands-free control for lighting, fans, and security for convenience, especially in kitchens or for accessibility purposes. Furthermore, the push for energy efficiency in commercial and residential buildings, combined with falling prices of integrated IoT sensors and voice recognition modules, accelerates market expansion worldwide.
Q2. What are the main restraining factors for this market?
A key constraint is persistent consumer concerns over privacy and data security, as these devices continuously listen and transmit voice commands and usage data over the internet. Additionally, complex and often incompatible installation and setup processes can deter adoption, especially in older homes lacking neutral wiring. The market is also hindered by the fact that voice recognition accuracy can be negatively affected by ambient noise or varying accents, leading to user frustration.
Q3. Which segment is expected to witness high growth?
The Commercial and Industrial Segment (smart buildings) is expected to witness the highest growth. While residential adoption is high, commercial spaces, offices, and hotels are rapidly integrating these switches to meet sustainability mandates and reduce enormous energy waste. The return on investment is clear: voice-activated motion sensors optimize lighting schedules, minimize human error in energy use, and enhance facility management, driving large-scale procurement and fast growth.
Q4. Who are the top major players for this market?
The market is led by companies that provide both the smart home ecosystems and the essential electrical components. Top major players include Signify (Philips Hue), Legrand S.A., Honeywell International Inc., and Lutron Electronics. Competition centers on developing switches that offer seamless integration with major third-party platforms (like Alexa and Google Assistant) and ensuring high reliability, ease of installation, and robust security features to win trust in both the consumer and commercial markets.
Q5. Which country is the largest player?
The United States is the largest country player in the Global Voice-activated Sensor Switch Market. This dominance is due to the country's high penetration rates of both smart home devices and high-speed internet infrastructure. Early and rapid adoption of voice assistants, significant consumer investment in home automation gadgets, and strong regulatory frameworks supporting smart building initiatives ensure the U.S. remains the primary driver of market revenue and technological testing for new voice control products.
List of Figures
Figure 1: Global Voice-activated Sensor Switch Market Revenue Breakdown (USD Billion, %) by Region, 2022 & 2029
Figure 2: Global Voice-activated Sensor Switch Market Value Share (%), By Segment 1, 2022 & 2029
Figure 3: Global Voice-activated Sensor Switch Market Forecast (USD Billion), by Sub-Segment 1, 2018-2029
Figure 4: Global Voice-activated Sensor Switch Market Forecast (USD Billion), by Sub-Segment 2, 2018-2029
Figure 5: Global Voice-activated Sensor Switch Market Value Share (%), By Segment 2, 2022 & 2029
Figure 6: Global Voice-activated Sensor Switch Market Forecast (USD Billion), by Sub-Segment 1, 2018-2029
Figure 7: Global Voice-activated Sensor Switch Market Forecast (USD Billion), by Sub-Segment 2, 2018-2029
Figure 8: Global Voice-activated Sensor Switch Market Forecast (USD Billion), by Sub-Segment 3, 2018-2029
Figure 9: Global Voice-activated Sensor Switch Market Forecast (USD Billion), by Others, 2018-2029
Figure 10: Global Voice-activated Sensor Switch Market Value Share (%), By Segment 3, 2022 & 2029
Figure 11: Global Voice-activated Sensor Switch Market Forecast (USD Billion), by Sub-Segment 1, 2018-2029
Figure 12: Global Voice-activated Sensor Switch Market Forecast (USD Billion), by Sub-Segment 2, 2018-2029
Figure 13: Global Voice-activated Sensor Switch Market Forecast (USD Billion), by Sub-Segment 3, 2018-2029
Figure 14: Global Voice-activated Sensor Switch Market Forecast (USD Billion), by Others, 2018-2029
Figure 15: Global Voice-activated Sensor Switch Market Value (USD Billion), by Region, 2022 & 2029
Figure 16: North America Voice-activated Sensor Switch Market Value Share (%), By Segment 1, 2022 & 2029
Figure 17: North America Voice-activated Sensor Switch Market Forecast (USD Billion), by Sub-Segment 1, 2018-2029
Figure 18: North America Voice-activated Sensor Switch Market Forecast (USD Billion), by Sub-Segment 2, 2018-2029
Figure 19: North America Voice-activated Sensor Switch Market Value Share (%), By Segment 2, 2022 & 2029
Figure 20: North America Voice-activated Sensor Switch Market Forecast (USD Billion), by Sub-Segment 1, 2018-2029
Figure 21: North America Voice-activated Sensor Switch Market Forecast (USD Billion), by Sub-Segment 2, 2018-2029
Figure 22: North America Voice-activated Sensor Switch Market Forecast (USD Billion), by Sub-Segment 3, 2018-2029
Figure 23: North America Voice-activated Sensor Switch Market Forecast (USD Billion), by Others, 2018-2029
Figure 24: North America Voice-activated Sensor Switch Market Value Share (%), By Segment 3, 2022 & 2029
Figure 25: North America Voice-activated Sensor Switch Market Forecast (USD Billion), by Sub-Segment 1, 2018-2029
Figure 26: North America Voice-activated Sensor Switch Market Forecast (USD Billion), by Sub-Segment 2, 2018-2029
Figure 27: North America Voice-activated Sensor Switch Market Forecast (USD Billion), by Sub-Segment 3, 2018-2029
Figure 28: North America Voice-activated Sensor Switch Market Forecast (USD Billion), by Others, 2018-2029
Figure 29: North America Voice-activated Sensor Switch Market Forecast (USD Billion), by U.S., 2018-2029
Figure 30: North America Voice-activated Sensor Switch Market Forecast (USD Billion), by Canada, 2018-2029
Figure 31: Latin America Voice-activated Sensor Switch Market Value Share (%), By Segment 1, 2022 & 2029
Figure 32: Latin America Voice-activated Sensor Switch Market Forecast (USD Billion), by Sub-Segment 1, 2018-2029
Figure 33: Latin America Voice-activated Sensor Switch Market Forecast (USD Billion), by Sub-Segment 2, 2018-2029
Figure 34: Latin America Voice-activated Sensor Switch Market Value Share (%), By Segment 2, 2022 & 2029
Figure 35: Latin America Voice-activated Sensor Switch Market Forecast (USD Billion), by Sub-Segment 1, 2018-2029
Figure 36: Latin America Voice-activated Sensor Switch Market Forecast (USD Billion), by Sub-Segment 2, 2018-2029
Figure 37: Latin America Voice-activated Sensor Switch Market Forecast (USD Billion), by Sub-Segment 3, 2018-2029
Figure 38: Latin America Voice-activated Sensor Switch Market Forecast (USD Billion), by Others, 2018-2029
Figure 39: Latin America Voice-activated Sensor Switch Market Value Share (%), By Segment 3, 2022 & 2029
Figure 40: Latin America Voice-activated Sensor Switch Market Forecast (USD Billion), by Sub-Segment 1, 2018-2029
Figure 41: Latin America Voice-activated Sensor Switch Market Forecast (USD Billion), by Sub-Segment 2, 2018-2029
Figure 42: Latin America Voice-activated Sensor Switch Market Forecast (USD Billion), by Sub-Segment 3, 2018-2029
Figure 43: Latin America Voice-activated Sensor Switch Market Forecast (USD Billion), by Others, 2018-2029
Figure 44: Latin America Voice-activated Sensor Switch Market Forecast (USD Billion), by Brazil, 2018-2029
Figure 45: Latin America Voice-activated Sensor Switch Market Forecast (USD Billion), by Mexico, 2018-2029
Figure 46: Latin America Voice-activated Sensor Switch Market Forecast (USD Billion), by Rest of Latin America, 2018-2029
Figure 47: Europe Voice-activated Sensor Switch Market Value Share (%), By Segment 1, 2022 & 2029
Figure 48: Europe Voice-activated Sensor Switch Market Forecast (USD Billion), by Sub-Segment 1, 2018-2029
Figure 49: Europe Voice-activated Sensor Switch Market Forecast (USD Billion), by Sub-Segment 2, 2018-2029
Figure 50: Europe Voice-activated Sensor Switch Market Value Share (%), By Segment 2, 2022 & 2029
Figure 51: Europe Voice-activated Sensor Switch Market Forecast (USD Billion), by Sub-Segment 1, 2018-2029
Figure 52: Europe Voice-activated Sensor Switch Market Forecast (USD Billion), by Sub-Segment 2, 2018-2029
Figure 53: Europe Voice-activated Sensor Switch Market Forecast (USD Billion), by Sub-Segment 3, 2018-2029
Figure 54: Europe Voice-activated Sensor Switch Market Forecast (USD Billion), by Others, 2018-2029
Figure 55: Europe Voice-activated Sensor Switch Market Value Share (%), By Segment 3, 2022 & 2029
Figure 56: Europe Voice-activated Sensor Switch Market Forecast (USD Billion), by Sub-Segment 1, 2018-2029
Figure 57: Europe Voice-activated Sensor Switch Market Forecast (USD Billion), by Sub-Segment 2, 2018-2029
Figure 58: Europe Voice-activated Sensor Switch Market Forecast (USD Billion), by Sub-Segment 3, 2018-2029
Figure 59: Europe Voice-activated Sensor Switch Market Forecast (USD Billion), by Others, 2018-2029
Figure 60: Europe Voice-activated Sensor Switch Market Forecast (USD Billion), by U.K., 2018-2029
Figure 61: Europe Voice-activated Sensor Switch Market Forecast (USD Billion), by Germany, 2018-2029
Figure 62: Europe Voice-activated Sensor Switch Market Forecast (USD Billion), by France, 2018-2029
Figure 63: Europe Voice-activated Sensor Switch Market Forecast (USD Billion), by Italy, 2018-2029
Figure 64: Europe Voice-activated Sensor Switch Market Forecast (USD Billion), by Spain, 2018-2029
Figure 65: Europe Voice-activated Sensor Switch Market Forecast (USD Billion), by Russia, 2018-2029
Figure 66: Europe Voice-activated Sensor Switch Market Forecast (USD Billion), by Rest of Europe, 2018-2029
Figure 67: Asia Pacific Voice-activated Sensor Switch Market Value Share (%), By Segment 1, 2022 & 2029
Figure 68: Asia Pacific Voice-activated Sensor Switch Market Forecast (USD Billion), by Sub-Segment 1, 2018-2029
Figure 69: Asia Pacific Voice-activated Sensor Switch Market Forecast (USD Billion), by Sub-Segment 2, 2018-2029
Figure 70: Asia Pacific Voice-activated Sensor Switch Market Value Share (%), By Segment 2, 2022 & 2029
Figure 71: Asia Pacific Voice-activated Sensor Switch Market Forecast (USD Billion), by Sub-Segment 1, 2018-2029
Figure 72: Asia Pacific Voice-activated Sensor Switch Market Forecast (USD Billion), by Sub-Segment 2, 2018-2029
Figure 73: Asia Pacific Voice-activated Sensor Switch Market Forecast (USD Billion), by Sub-Segment 3, 2018-2029
Figure 74: Asia Pacific Voice-activated Sensor Switch Market Forecast (USD Billion), by Others, 2018-2029
Figure 75: Asia Pacific Voice-activated Sensor Switch Market Value Share (%), By Segment 3, 2022 & 2029
Figure 76: Asia Pacific Voice-activated Sensor Switch Market Forecast (USD Billion), by Sub-Segment 1, 2018-2029
Figure 77: Asia Pacific Voice-activated Sensor Switch Market Forecast (USD Billion), by Sub-Segment 2, 2018-2029
Figure 78: Asia Pacific Voice-activated Sensor Switch Market Forecast (USD Billion), by Sub-Segment 3, 2018-2029
Figure 79: Asia Pacific Voice-activated Sensor Switch Market Forecast (USD Billion), by Others, 2018-2029
Figure 80: Asia Pacific Voice-activated Sensor Switch Market Forecast (USD Billion), by China, 2018-2029
Figure 81: Asia Pacific Voice-activated Sensor Switch Market Forecast (USD Billion), by India, 2018-2029
Figure 82: Asia Pacific Voice-activated Sensor Switch Market Forecast (USD Billion), by Japan, 2018-2029
Figure 83: Asia Pacific Voice-activated Sensor Switch Market Forecast (USD Billion), by Australia, 2018-2029
Figure 84: Asia Pacific Voice-activated Sensor Switch Market Forecast (USD Billion), by Southeast Asia, 2018-2029
Figure 85: Asia Pacific Voice-activated Sensor Switch Market Forecast (USD Billion), by Rest of Asia Pacific, 2018-2029
Figure 86: Middle East & Africa Voice-activated Sensor Switch Market Value Share (%), By Segment 1, 2022 & 2029
Figure 87: Middle East & Africa Voice-activated Sensor Switch Market Forecast (USD Billion), by Sub-Segment 1, 2018-2029
Figure 88: Middle East & Africa Voice-activated Sensor Switch Market Forecast (USD Billion), by Sub-Segment 2, 2018-2029
Figure 89: Middle East & Africa Voice-activated Sensor Switch Market Value Share (%), By Segment 2, 2022 & 2029
Figure 90: Middle East & Africa Voice-activated Sensor Switch Market Forecast (USD Billion), by Sub-Segment 1, 2018-2029
Figure 91: Middle East & Africa Voice-activated Sensor Switch Market Forecast (USD Billion), by Sub-Segment 2, 2018-2029
Figure 92: Middle East & Africa Voice-activated Sensor Switch Market Forecast (USD Billion), by Sub-Segment 3, 2018-2029
Figure 93: Middle East & Africa Voice-activated Sensor Switch Market Forecast (USD Billion), by Others, 2018-2029
Figure 94: Middle East & Africa Voice-activated Sensor Switch Market Value Share (%), By Segment 3, 2022 & 2029
Figure 95: Middle East & Africa Voice-activated Sensor Switch Market Forecast (USD Billion), by Sub-Segment 1, 2018-2029
Figure 96: Middle East & Africa Voice-activated Sensor Switch Market Forecast (USD Billion), by Sub-Segment 2, 2018-2029
Figure 97: Middle East & Africa Voice-activated Sensor Switch Market Forecast (USD Billion), by Sub-Segment 3, 2018-2029
Figure 98: Middle East & Africa Voice-activated Sensor Switch Market Forecast (USD Billion), by Others, 2018-2029
Figure 99: Middle East & Africa Voice-activated Sensor Switch Market Forecast (USD Billion), by GCC, 2018-2029
Figure 100: Middle East & Africa Voice-activated Sensor Switch Market Forecast (USD Billion), by South Africa, 2018-2029
Figure 101: Middle East & Africa Voice-activated Sensor Switch Market Forecast (USD Billion), by Rest of Middle East & Africa, 2018-2029
List of Tables
Table 1: Global Voice-activated Sensor Switch Market Revenue (USD Billion) Forecast, by Segment 1, 2018-2029
Table 2: Global Voice-activated Sensor Switch Market Revenue (USD Billion) Forecast, by Segment 2, 2018-2029
Table 3: Global Voice-activated Sensor Switch Market Revenue (USD Billion) Forecast, by Segment 3, 2018-2029
Table 4: Global Voice-activated Sensor Switch Market Revenue (USD Billion) Forecast, by Region, 2018-2029
Table 5: North America Voice-activated Sensor Switch Market Revenue (USD Billion) Forecast, by Segment 1, 2018-2029
Table 6: North America Voice-activated Sensor Switch Market Revenue (USD Billion) Forecast, by Segment 2, 2018-2029
Table 7: North America Voice-activated Sensor Switch Market Revenue (USD Billion) Forecast, by Segment 3, 2018-2029
Table 8: North America Voice-activated Sensor Switch Market Revenue (USD Billion) Forecast, by Country, 2018-2029
Table 9: Europe Voice-activated Sensor Switch Market Revenue (USD Billion) Forecast, by Segment 1, 2018-2029
Table 10: Europe Voice-activated Sensor Switch Market Revenue (USD Billion) Forecast, by Segment 2, 2018-2029
Table 11: Europe Voice-activated Sensor Switch Market Revenue (USD Billion) Forecast, by Segment 3, 2018-2029
Table 12: Europe Voice-activated Sensor Switch Market Revenue (USD Billion) Forecast, by Country, 2018-2029
Table 13: Latin America Voice-activated Sensor Switch Market Revenue (USD Billion) Forecast, by Segment 1, 2018-2029
Table 14: Latin America Voice-activated Sensor Switch Market Revenue (USD Billion) Forecast, by Segment 2, 2018-2029
Table 15: Latin America Voice-activated Sensor Switch Market Revenue (USD Billion) Forecast, by Segment 3, 2018-2029
Table 16: Latin America Voice-activated Sensor Switch Market Revenue (USD Billion) Forecast, by Country, 2018-2029
Table 17: Asia Pacific Voice-activated Sensor Switch Market Revenue (USD Billion) Forecast, by Segment 1, 2018-2029
Table 18: Asia Pacific Voice-activated Sensor Switch Market Revenue (USD Billion) Forecast, by Segment 2, 2018-2029
Table 19: Asia Pacific Voice-activated Sensor Switch Market Revenue (USD Billion) Forecast, by Segment 3, 2018-2029
Table 20: Asia Pacific Voice-activated Sensor Switch Market Revenue (USD Billion) Forecast, by Country, 2018-2029
Table 21: Middle East & Africa Voice-activated Sensor Switch Market Revenue (USD Billion) Forecast, by Segment 1, 2018-2029
Table 22: Middle East & Africa Voice-activated Sensor Switch Market Revenue (USD Billion) Forecast, by Segment 2, 2018-2029
Table 23: Middle East & Africa Voice-activated Sensor Switch Market Revenue (USD Billion) Forecast, by Segment 3, 2018-2029
Table 24: Middle East & Africa Voice-activated Sensor Switch Market Revenue (USD Billion) Forecast, by Country, 2018-2029
Research Process
Data Library Research are conducted by industry experts who offer insight on
industry structure, market segmentations technology assessment and competitive landscape (CL), and penetration, as well as on emerging trends. Their analysis is based on primary interviews (~ 80%) and secondary research (~ 20%) as well as years of professional expertise in their respective industries. Adding to this, by analysing historical trends and current market positions, our analysts predict where the market will be headed for the next five years. Furthermore, the varying trends of segment & categories geographically presented are also studied and the estimated based on the primary & secondary research.
In this particular report from the supply side Data Library Research has conducted primary surveys (interviews) with the key level executives (VP, CEO’s, Marketing Director, Business Development Manager
and SOFT) of the companies that active & prominent as well as the midsized organization
FIGURE 1: DLR RESEARH PROCESS
![research-methodology1]()
Primary Research
Extensive primary research was conducted to gain a deeper insight of the market and industry performance. The analysis is based on both primary and secondary research as well as years of professional expertise in the respective industries.
In addition to analysing current and historical trends, our analysts predict where the market is headed over the next five years.
It varies by segment for these categories geographically presented in the list of market tables. Speaking about this particular report we have conducted primary surveys (interviews) with the key level executives (VP, CEO’s, Marketing Director, Business Development Manager and many more) of the major players active in the market.
Secondary Research
Secondary research was mainly used to collect and identify information useful for the extensive, technical, market-oriented, and Friend’s study of the Global Extra Neutral Alcohol. It was also used to obtain key information about major players, market classification and segmentation according to the industry trends, geographical markets, and developments related to the market and technology perspectives. For this study, analysts have gathered information from various credible sources, such as annual reports, sec filings, journals, white papers, SOFT presentations, and company web sites.
Market Size Estimation
Both, top-down and bottom-up approaches were used to estimate and validate the size of the Global market and to estimate the size of various other dependent submarkets in the overall Extra Neutral Alcohol. The key players in the market were identified through secondary research and their market contributions in the respective geographies were determined through primary and secondary research.
Forecast Model
![research-methodology2]()