Global Inertial Sensor Fusion Market Overview and Analysis

The Global Inertial Sensor Fusion Market size is estimated at USD 6.36 billion in 2024 and is anticipated to reach around USD 62.69 billion by 2034, growing at a CAGR of 7.98% from 2025-2032.

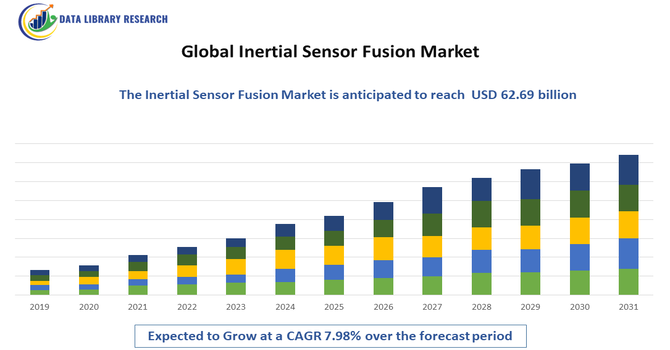
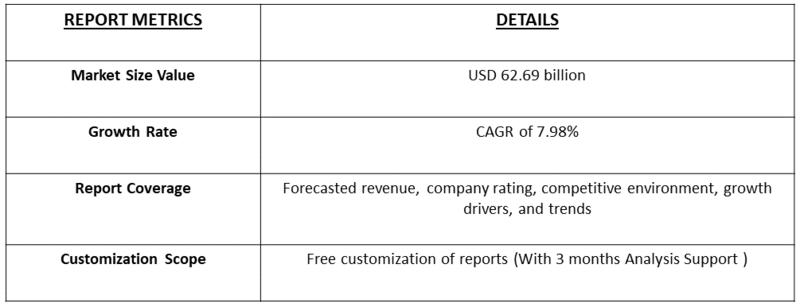
The Inertial Sensor Fusion Market involves the integration of data from multiple inertial sensors—such as accelerometers, gyroscopes, and magnetometers—to enhance motion tracking, navigation, and orientation accuracy. Widely used in automotive, consumer electronics, aerospace, and robotics, the market is driven by demand for precise, real-time positioning and advanced wearable and IoT applications.

The Inertial Sensor Fusion Market is driven by the growing demand for accurate motion tracking and navigation across industries such as automotive, aerospace, consumer electronics, and robotics. Rising adoption of advanced driver-assistance systems (ADAS), autonomous vehicles, and drones requires precise orientation and positioning, boosting sensor fusion applications. Additionally, the proliferation of wearable devices, IoT technologies, and smart mobile devices has intensified the need for real-time, low-power, and highly reliable sensor fusion solutions.

Global Inertial Sensor Fusion Market Trends

The Inertial Sensor Fusion Market is witnessing trends such as the increasing integration of AI and machine learning algorithms to enhance sensor accuracy and predictive capabilities. There is a growing shift toward miniaturized, low-power MEMS sensors for use in wearable devices, drones, and consumer electronics. Adoption of multi-sensor fusion techniques combining accelerometers, gyroscopes, magnetometers, and GNSS is rising to improve real-time positioning and navigation. Additionally, the expansion of autonomous vehicles, robotics, and AR/VR applications is driving demand for advanced fusion solutions that offer high reliability, low latency, and seamless operation across diverse environments.

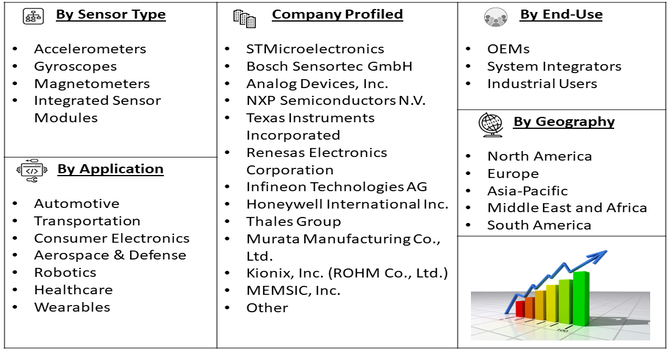
Market Segment: The Inertial Sensor Fusion Market can be segmented by Sensor Type (Accelerometers, Gyroscopes, Magnetometers, and Integrated Sensor Modules), Application (Automotive & Transportation, Consumer Electronics, Aerospace & Defense, Robotics, and Healthcare & Wearables), End User (OEMs, System Integrators, and Industrial Users) and Geography (North America, Europe, Asia-Pacific, Middle East and Africa, and South America). The report provides the value (in USD million) for the above segments.

Market Drivers

  • Rising Adoption in Automotive and Autonomous Vehicles

The growing adoption of inertial sensor fusion technology in automotive and autonomous vehicle applications is a major driver for the global market. Advanced driver-assistance systems (ADAS) and self-driving vehicles require highly accurate and real-time positioning, orientation, and navigation capabilities, which sensor fusion delivers by integrating accelerometers, gyroscopes, and magnetometers. Increasing consumer demand for safety features, such as lane departure warnings, collision avoidance, and adaptive cruise control, further fuels adoption. Additionally, governments are promoting autonomous and semi-autonomous vehicle development through supportive policies and regulations, encouraging automakers to invest in precise sensor fusion technologies.

  • Expansion of Consumer Electronics and Wearable Devices

The proliferation of consumer electronics and wearable devices has become another key driver for the inertial sensor fusion market. Smartphones, smartwatches, fitness trackers, AR/VR headsets, and drones increasingly rely on accurate motion detection and orientation tracking for enhanced user experience. Sensor fusion technology combines multiple inertial sensors to provide precise movement data, enabling improved navigation, gesture recognition, and immersive augmented reality experiences. The rising demand for IoT-enabled devices and connected ecosystems further supports market growth.

Market Restraint

  • High Cost and Complexity of Implementation

A primary restraint for the global inertial sensor fusion market is the high cost and complexity associated with implementing these technologies. Integrating multiple sensors with sophisticated algorithms requires advanced hardware, software, and calibration processes, which can increase overall production costs. Additionally, achieving accurate and stable performance across diverse environmental conditions, such as temperature variations, vibrations, and electromagnetic interference, poses technical challenges. Small-scale manufacturers and cost-sensitive industries may hesitate to adopt sensor fusion solutions due to these barriers.

Socio Economic Impact on Global Inertial Sensor Fusion Market

The global inertial sensor fusion market has significant socioeconomic impact by driving innovation, efficiency, and safety across multiple industries. In automotive and transportation, it enhances vehicle safety through advanced driver-assistance systems, reducing accidents and saving lives. In consumer electronics and wearables, it improves mobility, accessibility, and user experience, contributing to digital inclusion. The market also supports job creation in engineering, software development, and manufacturing sectors. Moreover, its applications in aerospace, defense, and healthcare promote technological advancement, infrastructure development, and economic growth. Thus, inertial sensor fusion fosters skill development, industrial competitiveness, and improved quality of life, reflecting a broad societal and economic influence.

Segmental Analysis:

  • Integrated Sensor Modules Segment is Expected to Witness Significant Growth Over the Forecast Period

The integrated sensor modules segment is expected to witness significant growth over the forecast period due to the rising demand for compact, energy-efficient, and high-performance solutions in multiple industries. These modules combine accelerometers, gyroscopes, and magnetometers into a single unit, offering precise motion tracking, orientation, and navigation with minimal space and power requirements. Advancements in MEMS technology and AI-based signal processing further enhance their accuracy and reliability. Increasing adoption in consumer electronics, wearable devices, drones, and autonomous systems is fueling market expansion. The convenience of plug-and-play solutions and reduced system integration complexity positions integrated sensor modules as a preferred choice, driving strong growth globally.

  • Aerospace & Defense Segment is Expected to Witness Significant Growth Over the Forecast Period

The aerospace and defense segment is expected to experience significant growth over the forecast period due to the increasing demand for accurate navigation, guidance, and positioning systems in military and commercial aviation. Inertial sensor fusion enables precise real-time tracking for aircraft, drones, missiles, and naval systems, enhancing operational safety and mission success. Growing defense budgets, modernization programs, and the rise of unmanned systems further drive adoption. Additionally, advancements in AI and sensor miniaturization allow integration into compact systems without compromising performance. These trends, combined with stringent performance and reliability requirements, make aerospace and defense a key growth segment for the inertial sensor fusion market.

  • OEMs Segment is Expected to Witness Significant Growth Over the Forecast Period

The OEMs segment is projected to witness significant growth over the forecast period as manufacturers increasingly integrate inertial sensor fusion technologies into vehicles, consumer electronics, and industrial equipment. OEMs benefit from turnkey solutions that combine accelerometers, gyroscopes, and magnetometers, enabling enhanced navigation, motion sensing, and safety features. The growing demand for autonomous vehicles, smart devices, and robotics drives OEM investment in sensor fusion systems to improve product differentiation and performance. Moreover, OEMs’ collaboration with sensor suppliers accelerates innovation, reduces development cycles, and ensures compliance with industry standards. Consequently, OEM adoption is a major factor propelling the global inertial sensor fusion market.

  • Asia Pacific Region is Expected to Witness Significant Growth Over the Forecast Period

The Asia Pacific region is expected to witness significant growth in the inertial sensor fusion market over the forecast period, driven by rapid industrialization, urbanization, and technology adoption. Rising demand for autonomous vehicles, drones, smart electronics, and wearable devices in countries such as China, Japan, South Korea, and India fuels regional growth.

Strong investments in aerospace, defense, and robotics further contribute to market expansion. Additionally, the presence of key manufacturers, favorable government policies, and increased R&D activities in the region support innovation and production of advanced sensor fusion solutions. These factors collectively position Asia Pacific as a high-growth market segment globally.

Global Inertial Sensor Fusion Market Competitive Analysis

The competitive landscape of the global inertial sensor fusion market is highly dynamic, comprising established sensor manufacturers, semiconductor companies, and technology integrators competing through innovation, product quality, and strategic partnerships. Key players focus on developing advanced MEMS-based sensor modules, AI-enabled signal processing algorithms, and compact, low-power solutions to cater to automotive, aerospace, consumer electronics, and industrial applications. Collaborations with OEMs, startups, and defense organizations are common to expand market reach and enhance technological capabilities. Companies also emphasize mergers, acquisitions, and regional expansions to strengthen their presence. Continuous R&D and differentiation in accuracy, reliability, and integration flexibility intensify competition across the market.

The major players for above market are:

  • STMicroelectronics
  • InvenSense (TDK Corporation)
  • Bosch Sensortec GmbH
  • Analog Devices, Inc.
  • NXP Semiconductors N.V.
  • Texas Instruments Incorporated
  • Renesas Electronics Corporation
  • Infineon Technologies AG
  • Honeywell International Inc.
  • Thales Group
  • Northrop Grumman Corporation
  • Murata Manufacturing Co., Ltd.
  • Kionix, Inc. (ROHM Co., Ltd.)
  • MEMSIC, Inc.
  • Sensonor AS (Safran Sensing Technologies Norway)
  • KVH Industries, Inc.
  • Trimble Inc.
  • Qualcomm Technologies, Inc.
  • TE Connectivity Ltd.
  • Hillcrest Labs

Recent Development

  • In Febraury 2025, Scientists at General Atomics (GA) celebrated after receiving funding from the U.S. Department of Energy (DOE) for advanced fusion energy research. As part of the Fusion Innovative Research Engine (FIRE) Collaboratives, the DOE awarded over $107 million to six pioneering projects nationwide, including GA’s Collaborative Target Injector Nexus for Experimental Development (TINEX), aimed at addressing critical challenges in developing and scaling inertial fusion power plants. GA also contributed expertise to two additional funded initiatives, reinforcing its leadership in fusion energy research.


  • In April 2024, The LSM6DSV32X 6-axis inertial module from STMicroelectronics featured a 32g accelerometer and 4000 dps gyroscope, enabling precise measurement of intense movements, freefall, and impacts. Supporting edge-AI applications, it enhanced battery life and functionality in wearables, asset trackers, and worker safety alarms. This innovation boosted the global inertial sensor fusion market by driving demand for high-performance, compact, and energy-efficient sensor modules across consumer, industrial, and IoT applications.


Frequently Asked Questions (FAQ) :

Q1. What the main growth driving factors for this market?

The primary growth driver is the increasing adoption of autonomous and semi-autonomous systems, most notably in the automotive sector for Advanced Driver Assistance Systems (ADAS) and self-driving cars. Inertial sensor fusion is crucial here for reliable navigation and stability control, especially when GPS signals are weak. Another significant factor is the rapid proliferation of smart consumer electronics, including smartphones and wearables, which heavily rely on compact and low-power inertial sensors (like IMUs) to enable motion tracking, gesture recognition, and enhanced user experiences.

Q2. What are the main restraining factors for this market?

the main restraints is the high cost and complexity associated with advanced inertial sensor fusion modules and their integration. These sophisticated systems often require specialized expertise for design, calibration, and maintenance, which can be challenging and costly, particularly for new or smaller market entrants. Additionally, the industry faces issues with a lack of standardization in software and hardware platforms, which can increase development and maintenance costs, thus hindering broader market growth.

Q3. Which segment is expected to witness high growth?

The Automotive end-use segment is expected to witness remarkably high growth. This is fundamentally driven by the global move toward Level 3 and higher autonomous driving and the integration of advanced safety features like ADAS. Sensor fusion, particularly combining Inertial Measurement Units (IMUs) with other sensors like GPS, radar, and cameras, is essential for achieving the required safety and precision for vehicle localization and collision avoidance, positioning it as a key area for investment and expansion.

Q4. Who are the top major players for this market?

The inertial sensor fusion market is dominated by several key semiconductor and technology companies. The top major players include Robert Bosch (Bosch Sensortec), known for its MEMS-based solutions widely used in consumer electronics and automotive applications. Other significant players are STMicroelectronics, Analog Devices Inc. (ADI), NXP Semiconductors, and Infineon Technologies. In the high-precision aerospace and defense applications, companies like Honeywell International and Northrop Grumman are also major forces.

Q5. Which country is the largest player?

The Asia-Pacific region holds the largest share, with China being a dominant country player within this region. China's market leadership is propelled by its massive manufacturing sector, particularly for consumer electronics (smartphones, wearables), its increasing investment in automotive technologies (including electric and autonomous vehicles), and significant government initiatives supporting smart city projects and digitalization.

Inertial Sensor Fusion MARKET STUDY GLOBAL MARKET ANALYSIS, INSIGHTS AND FORECAST, 2022-2029

    1. Introduction

    • 1.1. Research Scope
    • 1.2. Market Segmentation
    • 1.3. Research Methodology
    • 1.4. Definitions and Assumptions

    2. Executive Summary

      3. Market Dynamics

      • 3.1. Market Drivers
      • 3.2. Market Restraints
      • 3.3. Market Opportunities

      4. Key Insights

      • 4.1. Key Emerging Trends – For Major Countries
      • 4.2. Latest Technological Advancement
      • 4.3. Regulatory Landscape
      • 4.4. Industry SWOT Analysis
      • 4.5. Porters Five Forces Analysis

      5. Global Inertial Sensor Fusion Market Analysis (USD Billion), Insights and Forecast, 2018-2029

      • 5.1. Key Findings / Summary
      • 5.2. Market Analysis, Insights and Forecast – By Segment 1
        • 5.2.1. Sub-Segment 1
        • 5.2.2. Sub-Segment 2
      • 5.3. Market Analysis, Insights and Forecast – By Segment 2
        • 5.3.1. Sub-Segment 1
        • 5.3.2. Sub-Segment 2
        • 5.3.3. Sub-Segment 3
        • 5.3.4. Others
      • 5.4. Market Analysis, Insights and Forecast – By Segment 3
        • 5.4.1. Sub-Segment 1
        • 5.4.2. Sub-Segment 2
        • 5.4.3. Sub-Segment 3
        • 5.4.4. Others
      • 5.5. Market Analysis, Insights and Forecast – By Region
        • 5.5.1. North America
        • 5.5.2. Latin America
        • 5.5.3. Europe
        • 5.5.4. Asia Pacific
        • 5.5.5. Middle East and Africa

      6. North America Inertial Sensor Fusion Market Analysis (USD Billion), Insights and Forecast, 2018-2029

      • 6.1. Key Findings / Summary
      • 6.2. Market Analysis, Insights and Forecast – By Segment 1
        • 6.2.1. Sub-Segment 1
        • 6.2.2. Sub-Segment 2
      • 6.3. Market Analysis, Insights and Forecast – By Segment 2
        • 6.3.1. Sub-Segment 1
        • 6.3.2. Sub-Segment 2
        • 6.3.3. Sub-Segment 3
        • 6.3.4. Others
      • 6.4. Market Analysis, Insights and Forecast – By Segment 3
        • 6.4.1. Sub-Segment 1
        • 6.4.2. Sub-Segment 2
        • 6.4.3. Sub-Segment 3
        • 6.4.4. Others
      • 6.5. Market Analysis, Insights and Forecast – By Country
        • 6.5.1. U.S.
        • 6.5.2. Canada

      7. Latin America Inertial Sensor Fusion Market Analysis (USD Billion), Insights and Forecast, 2018-2029

      • 7.1. Key Findings / Summary
      • 7.2. Market Analysis, Insights and Forecast – By Segment 1
        • 7.2.1. Sub-Segment 1
        • 7.2.2. Sub-Segment 2
      • 7.3. Market Analysis, Insights and Forecast – By Segment 2
        • 7.3.1. Sub-Segment 1
        • 7.3.2. Sub-Segment 2
        • 7.3.3. Sub-Segment 3
        • 7.3.4. Others
      • 7.4. Market Analysis, Insights and Forecast – By Segment 3
        • 7.4.1. Sub-Segment 1
        • 7.4.2. Sub-Segment 2
        • 7.4.3. Sub-Segment 3
        • 7.4.4. Others
      • 7.5. Insights and Forecast – By Country
        • 7.5.1. Brazil
        • 7.5.2. Mexico
        • 7.5.3. Rest of Latin America

      8. Europe Inertial Sensor Fusion Market Analysis (USD Billion), Insights and Forecast, 2018-2029

      • 8.1. Key Findings / Summary
      • 8.2. Market Analysis, Insights and Forecast – By Segment 1
        • 8.2.1. Sub-Segment 1
        • 8.2.2. Sub-Segment 2
      • 8.3. Market Analysis, Insights and Forecast – By Segment 2
        • 8.3.1. Sub-Segment 1
        • 8.3.2. Sub-Segment 2
        • 8.3.3. Sub-Segment 3
        • 8.3.4. Others
      • 8.4. Market Analysis, Insights and Forecast – By Segment 3
        • 8.4.1. Sub-Segment 1
        • 8.4.2. Sub-Segment 2
        • 8.4.3. Sub-Segment 3
        • 8.4.4. Others
      • 8.5. Market Analysis, Insights and Forecast – By Country
        • 8.5.1. UK
        • 8.5.2. Germany
        • 8.5.3. France
        • 8.5.4. Italy
        • 8.5.5. Spain
        • 8.5.6. Russia
        • 8.5.7. Rest of Europe

      9. Asia Pacific Inertial Sensor Fusion Market Analysis (USD Billion), Insights and Forecast, 2018-2029

      • 9.1. Key Findings / Summary
      • 9.2. Market Analysis, Insights and Forecast – By Segment 1
        • 9.2.1. Sub-Segment 1
        • 9.2.2. Sub-Segment 2
      • 9.3. Market Analysis, Insights and Forecast – By Segment 2
        • 9.3.1. Sub-Segment 1
        • 9.3.2. Sub-Segment 2
        • 9.3.3. Sub-Segment 3
        • 9.3.4. Others
      • 9.4. Market Analysis, Insights and Forecast – By Segment 3
        • 9.4.1. Sub-Segment 1
        • 9.4.2. Sub-Segment 2
        • 9.4.3. Sub-Segment 3
        • 9.4.4. Others
      • 9.5. Market Analysis, Insights and Forecast – By Country
        • 9.5.1. China
        • 9.5.2. India
        • 9.5.3. Japan
        • 9.5.4. Australia
        • 9.5.5. South East Asia
        • 9.5.6. Rest of Asia Pacific

      10. Middle East & Africa Inertial Sensor Fusion Market Analysis (USD Billion), Insights and Forecast, 2018-2029

      • 10.1. Key Findings / Summary
      • 10.2. Market Analysis, Insights and Forecast – By Segment 1
        • 10.2.1. Sub-Segment 1
        • 10.2.2. Sub-Segment 2
      • 10.3. Market Analysis, Insights and Forecast – By Segment 2
        • 10.3.1. Sub-Segment 1
        • 10.3.2. Sub-Segment 2
        • 10.3.3. Sub-Segment 3
        • 10.3.4. Others
      • 10.4. Market Analysis, Insights and Forecast – By Segment 3
        • 10.4.1. Sub-Segment 1
        • 10.4.2. Sub-Segment 2
        • 10.4.3. Sub-Segment 3
        • 10.4.4. Others
      • 10.5. Market Analysis, Insights and Forecast – By Country
        • 10.5.1. GCC
        • 10.5.2. South Africa
        • 10.5.3. Rest of Middle East & Africa

      11. Competitive Analysis

      • 11.1. Company Market Share Analysis, 2018
      • 11.2. Key Industry Developments
      • 11.3. Company Profile
        • 11.3.1. Company 1
          • 11.3.1.1. Business Overview
          • 11.3.1.2. Segment 1 & Service Offering
          • 11.3.1.3. Overall Revenue
          • 11.3.1.4. Geographic Presence
          • 11.3.1.5. Recent Development
        *Similar details will be provided for the following companies
        • 11.3.2. Company 2
        • 11.3.3. Company 3
        • 11.3.4. Company 4
        • 11.3.5. Company 5
        • 11.3.6. Company 6
        • 11.3.7. Company 7
        • 11.3.8. Company 8
        • 11.3.9. Company 9
        • 11.3.10. Company 10
        • 11.3.11. Company 11
        • 11.3.12. Company 12
      List of Figures

      Figure 1: Global Inertial Sensor Fusion Market Revenue Breakdown (USD Billion, %) by Region, 2022 & 2029
      Figure 2: Global Inertial Sensor Fusion Market Value Share (%), By Segment 1, 2022 & 2029
      Figure 3: Global Inertial Sensor Fusion Market Forecast (USD Billion), by Sub-Segment 1, 2018-2029
      Figure 4: Global Inertial Sensor Fusion Market Forecast (USD Billion), by Sub-Segment 2, 2018-2029
      Figure 5: Global Inertial Sensor Fusion Market Value Share (%), By Segment 2, 2022 & 2029
      Figure 6: Global Inertial Sensor Fusion Market Forecast (USD Billion), by Sub-Segment 1, 2018-2029
      Figure 7: Global Inertial Sensor Fusion Market Forecast (USD Billion), by Sub-Segment 2, 2018-2029
      Figure 8: Global Inertial Sensor Fusion Market Forecast (USD Billion), by Sub-Segment 3, 2018-2029
      Figure 9: Global Inertial Sensor Fusion Market Forecast (USD Billion), by Others, 2018-2029
      Figure 10: Global Inertial Sensor Fusion Market Value Share (%), By Segment 3, 2022 & 2029
      Figure 11: Global Inertial Sensor Fusion Market Forecast (USD Billion), by Sub-Segment 1, 2018-2029
      Figure 12: Global Inertial Sensor Fusion Market Forecast (USD Billion), by Sub-Segment 2, 2018-2029
      Figure 13: Global Inertial Sensor Fusion Market Forecast (USD Billion), by Sub-Segment 3, 2018-2029
      Figure 14: Global Inertial Sensor Fusion Market Forecast (USD Billion), by Others, 2018-2029
      Figure 15: Global Inertial Sensor Fusion Market Value (USD Billion), by Region, 2022 & 2029
      Figure 16: North America Inertial Sensor Fusion Market Value Share (%), By Segment 1, 2022 & 2029
      Figure 17: North America Inertial Sensor Fusion Market Forecast (USD Billion), by Sub-Segment 1, 2018-2029
      Figure 18: North America Inertial Sensor Fusion Market Forecast (USD Billion), by Sub-Segment 2, 2018-2029
      Figure 19: North America Inertial Sensor Fusion Market Value Share (%), By Segment 2, 2022 & 2029
      Figure 20: North America Inertial Sensor Fusion Market Forecast (USD Billion), by Sub-Segment 1, 2018-2029
      Figure 21: North America Inertial Sensor Fusion Market Forecast (USD Billion), by Sub-Segment 2, 2018-2029
      Figure 22: North America Inertial Sensor Fusion Market Forecast (USD Billion), by Sub-Segment 3, 2018-2029
      Figure 23: North America Inertial Sensor Fusion Market Forecast (USD Billion), by Others, 2018-2029
      Figure 24: North America Inertial Sensor Fusion Market Value Share (%), By Segment 3, 2022 & 2029
      Figure 25: North America Inertial Sensor Fusion Market Forecast (USD Billion), by Sub-Segment 1, 2018-2029
      Figure 26: North America Inertial Sensor Fusion Market Forecast (USD Billion), by Sub-Segment 2, 2018-2029
      Figure 27: North America Inertial Sensor Fusion Market Forecast (USD Billion), by Sub-Segment 3, 2018-2029
      Figure 28: North America Inertial Sensor Fusion Market Forecast (USD Billion), by Others, 2018-2029
      Figure 29: North America Inertial Sensor Fusion Market Forecast (USD Billion), by U.S., 2018-2029
      Figure 30: North America Inertial Sensor Fusion Market Forecast (USD Billion), by Canada, 2018-2029
      Figure 31: Latin America Inertial Sensor Fusion Market Value Share (%), By Segment 1, 2022 & 2029
      Figure 32: Latin America Inertial Sensor Fusion Market Forecast (USD Billion), by Sub-Segment 1, 2018-2029
      Figure 33: Latin America Inertial Sensor Fusion Market Forecast (USD Billion), by Sub-Segment 2, 2018-2029
      Figure 34: Latin America Inertial Sensor Fusion Market Value Share (%), By Segment 2, 2022 & 2029
      Figure 35: Latin America Inertial Sensor Fusion Market Forecast (USD Billion), by Sub-Segment 1, 2018-2029
      Figure 36: Latin America Inertial Sensor Fusion Market Forecast (USD Billion), by Sub-Segment 2, 2018-2029
      Figure 37: Latin America Inertial Sensor Fusion Market Forecast (USD Billion), by Sub-Segment 3, 2018-2029
      Figure 38: Latin America Inertial Sensor Fusion Market Forecast (USD Billion), by Others, 2018-2029
      Figure 39: Latin America Inertial Sensor Fusion Market Value Share (%), By Segment 3, 2022 & 2029
      Figure 40: Latin America Inertial Sensor Fusion Market Forecast (USD Billion), by Sub-Segment 1, 2018-2029
      Figure 41: Latin America Inertial Sensor Fusion Market Forecast (USD Billion), by Sub-Segment 2, 2018-2029
      Figure 42: Latin America Inertial Sensor Fusion Market Forecast (USD Billion), by Sub-Segment 3, 2018-2029
      Figure 43: Latin America Inertial Sensor Fusion Market Forecast (USD Billion), by Others, 2018-2029
      Figure 44: Latin America Inertial Sensor Fusion Market Forecast (USD Billion), by Brazil, 2018-2029
      Figure 45: Latin America Inertial Sensor Fusion Market Forecast (USD Billion), by Mexico, 2018-2029
      Figure 46: Latin America Inertial Sensor Fusion Market Forecast (USD Billion), by Rest of Latin America, 2018-2029
      Figure 47: Europe Inertial Sensor Fusion Market Value Share (%), By Segment 1, 2022 & 2029
      Figure 48: Europe Inertial Sensor Fusion Market Forecast (USD Billion), by Sub-Segment 1, 2018-2029
      Figure 49: Europe Inertial Sensor Fusion Market Forecast (USD Billion), by Sub-Segment 2, 2018-2029
      Figure 50: Europe Inertial Sensor Fusion Market Value Share (%), By Segment 2, 2022 & 2029
      Figure 51: Europe Inertial Sensor Fusion Market Forecast (USD Billion), by Sub-Segment 1, 2018-2029
      Figure 52: Europe Inertial Sensor Fusion Market Forecast (USD Billion), by Sub-Segment 2, 2018-2029
      Figure 53: Europe Inertial Sensor Fusion Market Forecast (USD Billion), by Sub-Segment 3, 2018-2029
      Figure 54: Europe Inertial Sensor Fusion Market Forecast (USD Billion), by Others, 2018-2029
      Figure 55: Europe Inertial Sensor Fusion Market Value Share (%), By Segment 3, 2022 & 2029
      Figure 56: Europe Inertial Sensor Fusion Market Forecast (USD Billion), by Sub-Segment 1, 2018-2029
      Figure 57: Europe Inertial Sensor Fusion Market Forecast (USD Billion), by Sub-Segment 2, 2018-2029
      Figure 58: Europe Inertial Sensor Fusion Market Forecast (USD Billion), by Sub-Segment 3, 2018-2029
      Figure 59: Europe Inertial Sensor Fusion Market Forecast (USD Billion), by Others, 2018-2029
      Figure 60: Europe Inertial Sensor Fusion Market Forecast (USD Billion), by U.K., 2018-2029
      Figure 61: Europe Inertial Sensor Fusion Market Forecast (USD Billion), by Germany, 2018-2029
      Figure 62: Europe Inertial Sensor Fusion Market Forecast (USD Billion), by France, 2018-2029
      Figure 63: Europe Inertial Sensor Fusion Market Forecast (USD Billion), by Italy, 2018-2029
      Figure 64: Europe Inertial Sensor Fusion Market Forecast (USD Billion), by Spain, 2018-2029
      Figure 65: Europe Inertial Sensor Fusion Market Forecast (USD Billion), by Russia, 2018-2029
      Figure 66: Europe Inertial Sensor Fusion Market Forecast (USD Billion), by Rest of Europe, 2018-2029
      Figure 67: Asia Pacific Inertial Sensor Fusion Market Value Share (%), By Segment 1, 2022 & 2029
      Figure 68: Asia Pacific Inertial Sensor Fusion Market Forecast (USD Billion), by Sub-Segment 1, 2018-2029
      Figure 69: Asia Pacific Inertial Sensor Fusion Market Forecast (USD Billion), by Sub-Segment 2, 2018-2029
      Figure 70: Asia Pacific Inertial Sensor Fusion Market Value Share (%), By Segment 2, 2022 & 2029
      Figure 71: Asia Pacific Inertial Sensor Fusion Market Forecast (USD Billion), by Sub-Segment 1, 2018-2029
      Figure 72: Asia Pacific Inertial Sensor Fusion Market Forecast (USD Billion), by Sub-Segment 2, 2018-2029
      Figure 73: Asia Pacific Inertial Sensor Fusion Market Forecast (USD Billion), by Sub-Segment 3, 2018-2029
      Figure 74: Asia Pacific Inertial Sensor Fusion Market Forecast (USD Billion), by Others, 2018-2029
      Figure 75: Asia Pacific Inertial Sensor Fusion Market Value Share (%), By Segment 3, 2022 & 2029
      Figure 76: Asia Pacific Inertial Sensor Fusion Market Forecast (USD Billion), by Sub-Segment 1, 2018-2029
      Figure 77: Asia Pacific Inertial Sensor Fusion Market Forecast (USD Billion), by Sub-Segment 2, 2018-2029
      Figure 78: Asia Pacific Inertial Sensor Fusion Market Forecast (USD Billion), by Sub-Segment 3, 2018-2029
      Figure 79: Asia Pacific Inertial Sensor Fusion Market Forecast (USD Billion), by Others, 2018-2029
      Figure 80: Asia Pacific Inertial Sensor Fusion Market Forecast (USD Billion), by China, 2018-2029
      Figure 81: Asia Pacific Inertial Sensor Fusion Market Forecast (USD Billion), by India, 2018-2029
      Figure 82: Asia Pacific Inertial Sensor Fusion Market Forecast (USD Billion), by Japan, 2018-2029
      Figure 83: Asia Pacific Inertial Sensor Fusion Market Forecast (USD Billion), by Australia, 2018-2029
      Figure 84: Asia Pacific Inertial Sensor Fusion Market Forecast (USD Billion), by Southeast Asia, 2018-2029
      Figure 85: Asia Pacific Inertial Sensor Fusion Market Forecast (USD Billion), by Rest of Asia Pacific, 2018-2029
      Figure 86: Middle East & Africa Inertial Sensor Fusion Market Value Share (%), By Segment 1, 2022 & 2029
      Figure 87: Middle East & Africa Inertial Sensor Fusion Market Forecast (USD Billion), by Sub-Segment 1, 2018-2029
      Figure 88: Middle East & Africa Inertial Sensor Fusion Market Forecast (USD Billion), by Sub-Segment 2, 2018-2029
      Figure 89: Middle East & Africa Inertial Sensor Fusion Market Value Share (%), By Segment 2, 2022 & 2029
      Figure 90: Middle East & Africa Inertial Sensor Fusion Market Forecast (USD Billion), by Sub-Segment 1, 2018-2029
      Figure 91: Middle East & Africa Inertial Sensor Fusion Market Forecast (USD Billion), by Sub-Segment 2, 2018-2029
      Figure 92: Middle East & Africa Inertial Sensor Fusion Market Forecast (USD Billion), by Sub-Segment 3, 2018-2029
      Figure 93: Middle East & Africa Inertial Sensor Fusion Market Forecast (USD Billion), by Others, 2018-2029
      Figure 94: Middle East & Africa Inertial Sensor Fusion Market Value Share (%), By Segment 3, 2022 & 2029
      Figure 95: Middle East & Africa Inertial Sensor Fusion Market Forecast (USD Billion), by Sub-Segment 1, 2018-2029
      Figure 96: Middle East & Africa Inertial Sensor Fusion Market Forecast (USD Billion), by Sub-Segment 2, 2018-2029
      Figure 97: Middle East & Africa Inertial Sensor Fusion Market Forecast (USD Billion), by Sub-Segment 3, 2018-2029
      Figure 98: Middle East & Africa Inertial Sensor Fusion Market Forecast (USD Billion), by Others, 2018-2029
      Figure 99: Middle East & Africa Inertial Sensor Fusion Market Forecast (USD Billion), by GCC, 2018-2029
      Figure 100: Middle East & Africa Inertial Sensor Fusion Market Forecast (USD Billion), by South Africa, 2018-2029
      Figure 101: Middle East & Africa Inertial Sensor Fusion Market Forecast (USD Billion), by Rest of Middle East & Africa, 2018-2029 
      List of Tables
      Table 1: Global Inertial Sensor Fusion Market Revenue (USD Billion) Forecast, by Segment 1, 2018-2029
      Table 2: Global Inertial Sensor Fusion Market Revenue (USD Billion) Forecast, by Segment 2, 2018-2029
      Table 3: Global Inertial Sensor Fusion Market Revenue (USD Billion) Forecast, by Segment 3, 2018-2029
      Table 4: Global Inertial Sensor Fusion Market Revenue (USD Billion) Forecast, by Region, 2018-2029
      Table 5: North America Inertial Sensor Fusion Market Revenue (USD Billion) Forecast, by Segment 1, 2018-2029
      Table 6: North America Inertial Sensor Fusion Market Revenue (USD Billion) Forecast, by Segment 2, 2018-2029
      Table 7: North America Inertial Sensor Fusion Market Revenue (USD Billion) Forecast, by Segment 3, 2018-2029
      Table 8: North America Inertial Sensor Fusion Market Revenue (USD Billion) Forecast, by Country, 2018-2029
      Table 9: Europe Inertial Sensor Fusion Market Revenue (USD Billion) Forecast, by Segment 1, 2018-2029
      Table 10: Europe Inertial Sensor Fusion Market Revenue (USD Billion) Forecast, by Segment 2, 2018-2029
      Table 11: Europe Inertial Sensor Fusion Market Revenue (USD Billion) Forecast, by Segment 3, 2018-2029
      Table 12: Europe Inertial Sensor Fusion Market Revenue (USD Billion) Forecast, by Country, 2018-2029
      Table 13: Latin America Inertial Sensor Fusion Market Revenue (USD Billion) Forecast, by Segment 1, 2018-2029
      Table 14: Latin America Inertial Sensor Fusion Market Revenue (USD Billion) Forecast, by Segment 2, 2018-2029
      Table 15: Latin America Inertial Sensor Fusion Market Revenue (USD Billion) Forecast, by Segment 3, 2018-2029
      Table 16: Latin America Inertial Sensor Fusion Market Revenue (USD Billion) Forecast, by Country, 2018-2029
      Table 17: Asia Pacific Inertial Sensor Fusion Market Revenue (USD Billion) Forecast, by Segment 1, 2018-2029
      Table 18: Asia Pacific Inertial Sensor Fusion Market Revenue (USD Billion) Forecast, by Segment 2, 2018-2029
      Table 19: Asia Pacific Inertial Sensor Fusion Market Revenue (USD Billion) Forecast, by Segment 3, 2018-2029
      Table 20: Asia Pacific Inertial Sensor Fusion Market Revenue (USD Billion) Forecast, by Country, 2018-2029
      Table 21: Middle East & Africa Inertial Sensor Fusion Market Revenue (USD Billion) Forecast, by Segment 1, 2018-2029
      Table 22: Middle East & Africa Inertial Sensor Fusion Market Revenue (USD Billion) Forecast, by Segment 2, 2018-2029
      Table 23: Middle East & Africa Inertial Sensor Fusion Market Revenue (USD Billion) Forecast, by Segment 3, 2018-2029
      Table 24: Middle East & Africa Inertial Sensor Fusion Market Revenue (USD Billion) Forecast, by Country, 2018-2029
      Research Process

      Data Library Research are conducted by industry experts who offer insight on industry structure, market segmentations technology assessment and competitive landscape (CL), and penetration, as well as on emerging trends. Their analysis is based on primary interviews (~ 80%) and secondary research (~ 20%) as well as years of professional expertise in their respective industries. Adding to this, by analysing historical trends and current market positions, our analysts predict where the market will be headed for the next five years. Furthermore, the varying trends of segment & categories geographically presented are also studied and the estimated based on the primary & secondary research.

      In this particular report from the supply side Data Library Research has conducted primary surveys (interviews) with the key level executives (VP, CEO’s, Marketing Director, Business Development Manager and SOFT) of the companies that active & prominent as well as the midsized organization

      FIGURE 1: DLR RESEARH PROCESS

      research-methodology1

      Primary Research

      Extensive primary research was conducted to gain a deeper insight of the market and industry performance. The analysis is based on both primary and secondary research as well as years of professional expertise in the respective industries.

      In addition to analysing current and historical trends, our analysts predict where the market is headed over the next five years.

      It varies by segment for these categories geographically presented in the list of market tables. Speaking about this particular report we have conducted primary surveys (interviews) with the key level executives (VP, CEO’s, Marketing Director, Business Development Manager and many more) of the major players active in the market.

      Secondary Research

      Secondary research was mainly used to collect and identify information useful for the extensive, technical, market-oriented, and Friend’s study of the Global Extra Neutral Alcohol. It was also used to obtain key information about major players, market classification and segmentation according to the industry trends, geographical markets, and developments related to the market and technology perspectives. For this study, analysts have gathered information from various credible sources, such as annual reports, sec filings, journals, white papers, SOFT presentations, and company web sites.

      Market Size Estimation

      Both, top-down and bottom-up approaches were used to estimate and validate the size of the Global market and to estimate the size of various other dependent submarkets in the overall Extra Neutral Alcohol. The key players in the market were identified through secondary research and their market contributions in the respective geographies were determined through primary and secondary research.

      Forecast Model

      research-methodology2