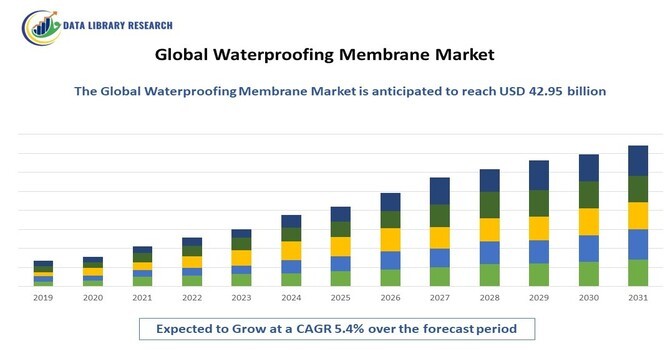
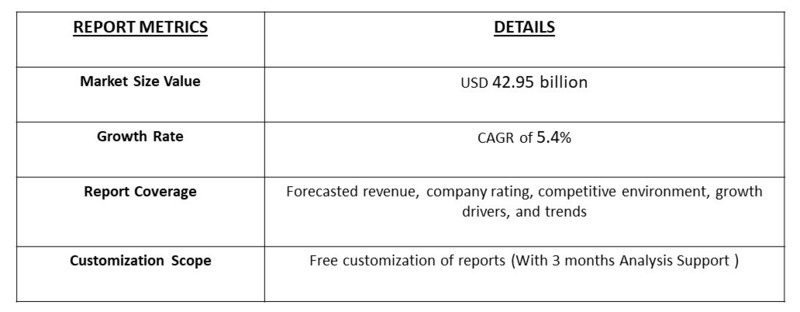
The global waterproofing membrane market size was estimated at USD 26.87 billion in 2025 and is projected to reach USD 42.95 billion by 2032, growing with a CAGR of 5.4%
Get Complete Analysis Of The Report - Download Updated Free Sample PDF
A waterproofing membrane is a thin protective layer applied to surfaces to prevent water from penetrating structures, ensuring durability and longevity. Commonly used in basements, roofs, tunnels, water tanks, and foundations, it acts as a barrier against moisture, seepage, and water damage. These membranes can be sheet-based or liquid-applied, forming a continuous and seamless waterproof layer once cured. Made from materials like bitumen, PVC, EPDM, or polyurethane, they provide flexibility, chemical resistance, and crack-bridging properties. Waterproofing membranes are essential in construction to protect structural integrity, prevent corrosion, and reduce maintenance costs by safeguarding buildings from water-related deterioration over time.
The waterproofing membrane market has been witnessing steady growth, driven by rising infrastructure development, rapid urbanization, and increasing investments in residential and commercial construction worldwide. Demand is further fueled by growing awareness about building longevity and the need to prevent water-related structural damage. Technological advancements have led to the development of eco-friendly, durable, and easy-to-apply membranes, which are gaining popularity among contractors and builders. Additionally, stringent building safety regulations and climate change–induced extreme weather conditions have pushed the adoption of high-performance waterproofing solutions. Emerging economies in the Asia-Pacific and the Middle East are becoming key growth hubs, offering lucrative opportunities for market expansion.
Segmentation:
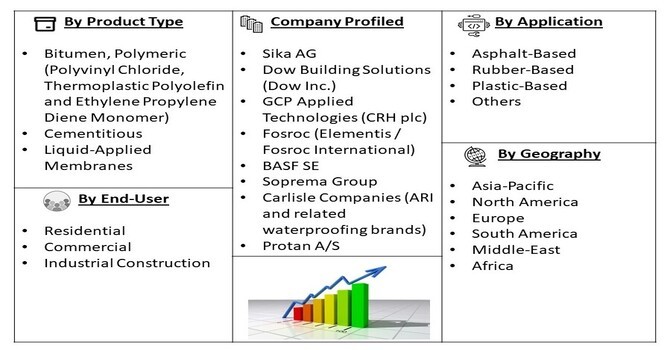
The waterproofing membrane market can be segmented by Type (Bitumen, Polymeric (Polyvinyl Chloride, Thermoplastic Polyolefin and Ethylene Propylene Diene Monomer), Cementitious, and Liquid-Applied Membranes), Material (Asphalt-Based, Rubber-Based, Plastic-Based, and Others), End-User (Residential, Commercial, and Industrial Construction) and Geography (North America, Europe, Asia-Pacific, Middle East and Africa, and South America). The report provides the value (in USD million) for the above segments.
For Detailed Market Segmentation - Get a Free Sample PDF
Market Drivers:
The relentless pace of global construction, fueled by rapid urbanization and population growth, stands as a primary driver for the waterproofing membrane market. As cities expand and infrastructure projects proliferate to accommodate burgeoning populations, the demand for robust and durable construction materials escalates.
Modern architectural designs often incorporate complex structures and subterranean elements, necessitating advanced waterproofing solutions to prevent structural damage, mold growth, and associated repair costs. For instance, in July 2025, Indian Government, under Pradhan Mantri Gram SadakYojana (PMGSY) sanctioned, a total of 56,875 km of road and 43,700 km completed using waste plastic under various PMGSY verticals. To promote green technologies, the Ministry had issued the “Vision Document on New Technology Initiatives Guidelines-2022,” mandating the use of waste plastic in 70% of eligible PMGSY roads. This development drove innovation in waterproofing membranes, as integrating waste plastics into road construction spurred demand for durable, water-resistant materials, encouraging advancements and broader adoption of sustainable membrane technologies. Furthermore, increasing disposable incomes in emerging economies lead to higher standards in housing and commercial spaces, emphasizing the need for quality waterproofing to ensure comfort and longevity of buildings, thereby directly stimulating market growth.
There is a significantly heightened awareness among developers, builders, and end-users regarding the critical importance of building durability and asset protection through effective waterproofing. Water ingress can lead to severe structural deterioration, leading to costly repairs, reduced property value, and potential health hazards from mold and dampness. Consequently, property owners and investors are increasingly prioritizing the long-term integrity and performance of their assets. This shift in perception drives the demand for high-quality, reliable waterproofing membranes that offer sustained protection against moisture damage, thereby contributing to the market's expansion as proactive measures are favored over reactive repairs.
Market Restraints:
A significant restraint for the market is the high volatility in the prices of key raw materials, primarily petroleum-based products like bitumen and various polymers (e.g., PVC, HDPE, EVA). Fluctuations in crude oil prices directly impact production costs, squeezing profit margins for manufacturers and creating pricing instability for end-users. This uncertainty can lead to project delays as budgets are reassessed and can hinder the adoption of premium membrane systems in favor of cheaper, often inferior, alternatives in cost-sensitive markets.
The waterproofing membrane market has had a notable socio-economic impact by enhancing the durability and safety of infrastructure, thereby reducing long-term maintenance costs and safeguarding public investments. Its adoption has created employment opportunities across manufacturing, construction, and installation sectors, supporting local economies and skill development. Improved waterproofing has also contributed to healthier living environments by preventing mold growth and water-related damage in buildings, thereby improving public health and quality of life. Pre-COVID, the market grew steadily with urban development, while post-COVID, it gained further momentum as governments increased infrastructure spending to stimulate economic recovery and create resilient, sustainable structures. @@ Segmental Analysis.
The bitumen segment of the waterproofing membrane market is poised for considerable growth due to its cost-effectiveness and long-standing familiarity within the construction industry. Bitumen, derived from petroleum, is a robust and reliable material for waterproofing, especially in roofing and foundation applications. Its ease of application, particularly with modified bitumen sheets, makes it a preferred choice for many construction projects where budget is a key consideration.
Furthermore, advancements in bitumen technology, such as polymer modification, have enhanced its flexibility, durability, and performance in extreme temperatures. For instance, in June 2025, Asphalt Worxx LLC announced a major expansion of its operations to meet the growing infrastructure demands across Ocean and Monmouth Counties, driven by Toms River Township’s large-scale capital improvement plan. Backed by USD 8.2 million in road paving funding under a broader USD 14.7 million bond ordinance, the township’s push for modern equipment had prompted Asphalt Worxx to invest in an upgraded fleet, including a high-performance milling machine and next-generation paver. These enhancements had positioned the company to compete on large municipal projects while continuing to serve residential and commercial clients effectively. This development boosted demand for bitumen-based waterproofing membranes, as expanded roadwork activity and advanced paving machinery increased consumption of high-quality bituminous materials for long-lasting, water-resistant infrastructure. The continuous demand from developing economies for affordable and proven waterproofing solutions ensures that the bitumen segment will remain a strong contributor to the overall market's expansion.
The rubber-based segment, particularly EPDM (Ethylene Propylene Diene Monomer) and modified rubber membranes, is anticipated to experience robust growth. These materials offer exceptional durability, flexibility, and resistance to UV radiation and extreme weather conditions, making them ideal for long-term roofing and wall applications. EPDM's ability to withstand significant thermal expansion and contraction without cracking or tearing provides superior protection. The increasing emphasis on sustainable and low-maintenance building solutions also favors rubber-based membranes, as they boast a long service life and require minimal upkeep. As construction standards evolve and demand for high-performance, weather-resistant materials increases, the rubber-based segment is set to capture a larger market share.The
The industrial construction segment is forecast to be a high-growth area due to the global expansion of manufacturing, logistics, and energy sectors, which require large, durable facilities. These structures, such as factories, warehouses, power plants, and chemical processing units, have expansive flat roofs and critical below-ground infrastructure that demand robust, chemical-resistant, and high-performance waterproofing solutions to protect valuable assets and ensure uninterrupted operations. Stringent safety and environmental regulations governing industrial sites further mandate the use of reliable membrane systems to prevent leaks and contamination, fueling investment in advanced waterproofing technologies tailored for the demanding industrial environment.
The Asia Pacific region is projected to witness the most significant growth, primarily fueled by massive urbanization, population growth, and extensive government-led infrastructure investments in nations like China, India, and Southeast Asian countries.
Rapid development in residential and commercial construction, coupled with ambitious projects for smart cities, transportation networks (metro rails, airports), and water management systems, creates immense demand for waterproofing membranes. For instance, Japan’s bitumen consumption rose by 7.9% in FY 2020–21 to 1.95 million tonnes, driven by steady road construction despite Covid-19 lockdowns. March 2021 saw the highest monthly use at 203,869 tonnes, as contractors rushed to utilize public budgets. About 80% went to roadworks, the rest to power generation. This rise boosted demand for bitumen-based waterproofing membranes, as expanding road projects spurred the use of durable water-resistant layers to extend pavement life in Japan.
Furthermore, increasing awareness about building quality and the need to protect structures from extreme weather conditions is shifting preference from traditional methods to modern membrane systems, establishing APAC as the dominant and fastest-growing market.
To Learn More About This Report - Request a Free Sample Copy
The waterproofing membrane market exhibits a fragmented yet competitive landscape, characterized by a mix of large, established global players and numerous regional and specialized manufacturers. Key industry participants focus on developing innovative, high-performance, and sustainable membrane solutions to cater to diverse construction needs, from residential buildings to large-scale infrastructure projects. Competition intensifies through product differentiation based on material type (e.g., bitumen, PVC, TPO, EPDM), application methods (self-adhesive, torch-on, liquid-applied), and performance characteristics like durability, flexibility, and environmental impact. Strategic partnerships, mergers and acquisitions, and expanding distribution networks are common strategies employed by companies to gain market share and geographic reach, with a growing emphasis on offering integrated waterproofing systems rather than standalone products.
Ten major players in the Waterproofing Membrane market:
Recent Developments:
Q1. What are the main growth-driving factors for this market?
The primary drivers are the global surge in construction and infrastructure development, stringent government building regulations, increasing demand for effective moisture protection in residential and commercial buildings, and the need for renovation and repair of aging structures, especially in developed economies.
Q2. What are the main restraining factors for this market?
Key restraints include the volatility in raw material prices (e.g., bitumen, polymers), the high initial cost of advanced membrane systems, and the presence of low-quality, inexpensive products in price-sensitive markets, which can hinder the adoption of premium solutions.
Q3. Which segment is expected to witness high growth?
The liquid-applied membranes segment is anticipated to experience high growth due to its seamless application, excellent adhesion, flexibility, and suitability for complex structures, making it increasingly preferred over traditional sheet membranes in modern construction.
Q4. Who are the top major players for this market?
The top major players include Sika AG, BASF SE (Master Builders Solutions), GCP Applied Technologies Inc., Carlisle Companies Inc., Saint-Gobain (Weber), Dow Chemical Company, Fosroc International Ltd., Mapei S.p.A., Pidilite Industries Ltd. (Dr. Fixit), and GAF Materials Corporation.
Q5. Which country is the largest player?
China is the largest country player, driven by its massive and continuous construction boom, extensive infrastructure projects, government initiatives, and the presence of major manufacturing hubs supplying both domestic and global markets.
Data Library Research are conducted by industry experts who offer insight on industry structure, market segmentations technology assessment and competitive landscape (CL), and penetration, as well as on emerging trends. Their analysis is based on primary interviews (~ 80%) and secondary research (~ 20%) as well as years of professional expertise in their respective industries. Adding to this, by analysing historical trends and current market positions, our analysts predict where the market will be headed for the next five years. Furthermore, the varying trends of segment & categories geographically presented are also studied and the estimated based on the primary & secondary research.
In this particular report from the supply side Data Library Research has conducted primary surveys (interviews) with the key level executives (VP, CEO’s, Marketing Director, Business Development Manager and SOFT) of the companies that active & prominent as well as the midsized organization
FIGURE 1: DLR RESEARH PROCESS
Extensive primary research was conducted to gain a deeper insight of the market and industry performance. The analysis is based on both primary and secondary research as well as years of professional expertise in the respective industries.
In addition to analysing current and historical trends, our analysts predict where the market is headed over the next five years.
It varies by segment for these categories geographically presented in the list of market tables. Speaking about this particular report we have conducted primary surveys (interviews) with the key level executives (VP, CEO’s, Marketing Director, Business Development Manager and many more) of the major players active in the market.
Secondary ResearchSecondary research was mainly used to collect and identify information useful for the extensive, technical, market-oriented, and Friend’s study of the Global Extra Neutral Alcohol. It was also used to obtain key information about major players, market classification and segmentation according to the industry trends, geographical markets, and developments related to the market and technology perspectives. For this study, analysts have gathered information from various credible sources, such as annual reports, sec filings, journals, white papers, SOFT presentations, and company web sites.
Market Size EstimationBoth, top-down and bottom-up approaches were used to estimate and validate the size of the Global market and to estimate the size of various other dependent submarkets in the overall Extra Neutral Alcohol. The key players in the market were identified through secondary research and their market contributions in the respective geographies were determined through primary and secondary research.
Forecast Model