Automotive 3D Digital Instrument Cluster Market Overview and Analysis
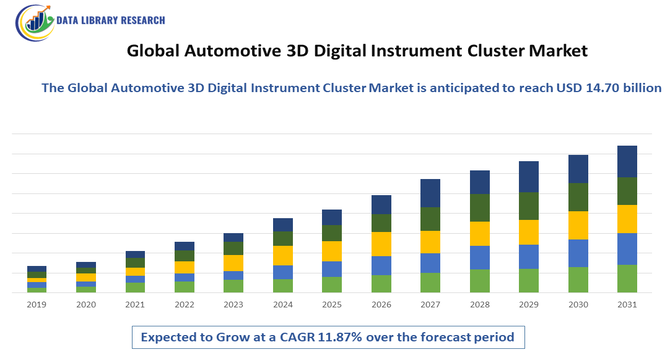
- The global automotive 3D digital instrument cluster market is projected to reach approximately USD 14.70 billion by 2032, expanding from a 2025 value of about USD 5.60 billion. This significant growth is expected to be driven by a robust Compound Annual Growth Rate (CAGR) of around 10.12% over the forecast period, 2025-2032.
Get Complete Analysis Of The Report - Download Updated Free Sample PDF
The Global Automotive 3D Digital Instrument Cluster Market is experiencing strong growth, primarily driven by the rising demand for advanced in-vehicle technologies that enhance safety, user experience, and driving convenience. The rapid adoption of connected and autonomous vehicles, coupled with advancements in display technologies such as OLED, TFT-LCD, and AR-based interfaces, is further accelerating market expansion.
Automotive 3D Digital Instrument Cluster Market Latest Trends
The Global Automotive 3D Digital Instrument Cluster Market is witnessing several notable trends that are reshaping the in-vehicle digital experience. One of the most prominent trends is the integration of augmented reality (AR) and advanced graphics, enabling clusters to display intuitive 3D navigation, ADAS alerts, and real-time driving information with enhanced depth perception. Automakers are increasingly adopting larger, high-resolution OLED and next-generation TFT displays to deliver immersive visual quality and premium aesthetics. Personalization has also become a key trend, with modern clusters allowing drivers to customize themes, layouts, widgets, and graphic styles for a more tailored user experience.
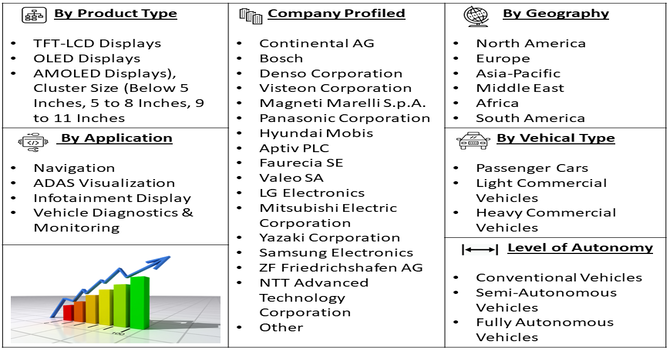
Segmentation: Global Automotive 3D Digital Instrument Cluster Market is segmented By Display Type (TFT-LCD Displays, OLED Displays, AMOLED Displays), Cluster Size (Below 5 Inches, 5 to 8 Inches, 9 to 11 Inches), Vehicle Type (Passenger Cars, Light Commercial Vehicles, Heavy Commercial Vehicles), Level of Autonomy (Conventional Vehicles, Semi-Autonomous Vehicles, Fully Autonomous Vehicles), Application (Navigation, ADAS Visualization, Infotainment Display, Vehicle Diagnostics & Monitoring), and Geography (North America, Europe, Asia-Pacific, Middle East and Africa, and South America). The report provides the value (in USD million) for the above segments.
For Detailed Market Segmentation - Get a Free Sample PDF
Market Drivers:
- Rising Integration of Advanced Driver Assistance Systems (ADAS) and Safety Technologies
The increasing adoption of ADAS features—such as lane-keeping assist, adaptive cruise control, blind-spot detection, forward-collision warnings, and autonomous driving functions—is significantly driving the demand for 3D digital instrument clusters. Modern vehicles require advanced displays capable of representing complex real-time information in a visually clear and intuitive manner. 3D clusters enhance depth perception, improve visualization of ADAS alerts, and reduce driver cognitive load by presenting layered graphics with better spatial awareness. As safety regulations tighten globally and consumers prioritize safer driving experiences, automakers are shifting from traditional analog and 2D clusters to immersive 3D digital dashboards that can better support advanced safety alerts and autonomous navigation cues. This rising dependence on 3D-enabled interfaces for safety-critical data is a major factor accelerating market growth.
- Growing Demand for Premium, Connected, and Personalized In-Vehicle Experiences
Consumers increasingly expect vehicles—especially premium, electric, and connected models—to offer high-end digital interfaces with rich graphics, flexible customization, and seamless infotainment integration. 3D digital instrument clusters provide a modern, futuristic cockpit experience with visually engaging displays, real-time vehicle analytics, customizable layouts, and detailed 3D animations. The shift toward connected car ecosystems, where navigation, media, vehicle health monitoring, smartphone integration, and cloud-based services converge, is further boosting the adoption of advanced display technologies. Additionally, the rise of electric vehicles (EVs) is amplifying the need for sophisticated clusters capable of displaying detailed energy consumption data, charging status, battery temperature, and range calculations. Automakers are responding to this demand by incorporating 3D clusters to differentiate their models, enhance brand appeal, and deliver a more intelligent and personalized user experience—thus driving substantial growth in the market.
Market Restraints:
- High Cost of Advanced 3D Display Components
The high cost of advanced 3D display components, such as OLED and AR-enabled panels, which increases the overall vehicle production cost and limits widespread adoption, especially in budget and entry-level vehicle segments. Additionally, the complex integration requirements involving software, sensors, and graphic processing units create challenges for OEMs and Tier-1 suppliers, often leading to longer development cycles and higher engineering expenses. Another restraint is the risk of driver distraction, as overly complex 3D graphics or animations may overwhelm certain drivers, prompting regulators to scrutinize digital cockpit designs more closely.
Socioeconomic Impact on Automotive 3D Digital Instrument Cluster Market
The Global Automotive 3D Digital Instrument Cluster Market has generated notable socioeconomic impact by accelerating technological advancement, job creation, and value generation across the automotive and electronics sectors. As consumer demand for enhanced safety, real-time vehicle information, and premium in-car experiences increases, automakers and suppliers invest heavily in digital cockpit innovation. This growth supports employment in software development, semiconductor manufacturing, UX design, and system integration. The adoption of 3D clusters also stimulates competition among vehicle manufacturers, driving modernization across both luxury and mass-market segments. Additionally, advanced digital interfaces contribute to safer driving behavior, supporting broader societal goals around road safety and transportation efficiency.
Segmental Analysis:
- OLED Displays segment is expected to witness highest growth over the forecast period
OLED displays are gaining traction due to their superior visual clarity, high contrast ratios, and ability to deliver immersive 3D graphics. Their flexibility, thin profile, and vibrant color reproduction make them the preferred choice for premium vehicles and next-generation digital cockpits, driving their increasing adoption across the automotive sector.
- 9 to 11 Inches segment is expected to witness highest growth over the forecast period
Clusters in the 9 to 11-inch range are witnessing strong demand as automakers shift toward larger and more feature-rich instrument panels. This size range offers an optimal balance between dashboard integration and visibility, making it ideal for displaying complex data such as navigation overlays, ADAS alerts, and EV performance metrics.
- Passenger Cars segment is expected to witness highest growth over the forecast period
Passenger cars account for the largest adoption of 3D digital instrument clusters, driven by growing consumer preference for technologically advanced and aesthetically appealing interiors. The rising integration of connectivity features, personalization options, and advanced safety systems in passenger vehicles further accelerates the adoption of digital clusters.
- Semi-Autonomous Vehicles segment is expected to witness highest growth over the forecast period
Semi-autonomous vehicles rely heavily on real-time visualization of driving assistance features, and 3D digital instrument clusters play a crucial role in delivering clear, interactive representations of lane guidance, adaptive cruise control, and traffic monitoring. The evolution of ADAS and increased demand for enhanced situational awareness are boosting this segment.
- ADAS Visualization segment is expected to witness highest growth over the forecast period
ADAS visualization is emerging as one of the most important applications, as 3D clusters provide intuitive displays of forward collision warnings, blind-spot alerts, and lane-keeping assistance. Enhanced depth perception and improved readability significantly strengthen driver safety and decision-making.
Moreover, the integration of real-time sensor data with 3D graphical interfaces enables drivers to better understand their surroundings, especially in complex traffic environments. By presenting spatial information more naturally, 3D clusters reduce cognitive load and help drivers react more quickly to potential hazards. Automakers are increasingly leveraging these capabilities to differentiate their vehicles and comply with stricter safety regulations.
- Asia-Pacific region is expected to witness highest growth over the forecast period
The Asia-Pacific region is expected to witness the highest growth in the Global Automotive 3D Digital Instrument Cluster Market due to rapid expansion of the automotive industry, rising consumer preference for advanced in-car technologies, and strong economic growth across key markets such as China, Japan, India, and South Korea. For instance, in August 2025, Mainland China’s rapid shift toward EVs, autonomous driving, and centralized vehicle architectures significantly strengthened demand for advanced cockpit and ADAS SoCs. With forecasts showing Greater China leading global ADC and cockpit SoC adoption by 2030, this momentum greatly supported the Asia-Pacific Automotive 3D Digital Instrument Cluster Market by accelerating integration of high-performance, intelligence-driven digital displays across next-generation vehicles.
Increasing vehicle production, growing adoption of electric and connected vehicles, and supportive government initiatives for automotive modernization further accelerate demand for digital cockpit solutions. Additionally, the presence of major electronic component manufacturers and competitive labor costs enhances the region’s capability for large-scale production. Rising disposable incomes and a shift toward premium vehicle features also strengthen adoption, positioning Asia-Pacific as the fastest-growing market.
| Market Size Value |
USD 14.70 billion |
| Growth Rate |
CAGR of 10.12% |
| Forecast |
2026-2033 |
| Historical data |
2021-2024 |
| Base Year |
2025 |
| Report Coverage |
Forecasted revenue, company rating, competitive environment, growth drivers, and trends |
| Segment Coverage |
Type, Application, End-User, Geography |
| Regional Scope |
North America, Europe, Asia Pacific, Middle East |
| Customized scope |
Free customization of reports (With 3 months' analysis support) |
| To Learn More About This Report |
Request a Free Sample Copy |
Automotive 3D Digital Instrument Cluster Market Competitive Landscape
The Global Automotive 3D Digital Instrument Cluster Market is highly competitive, characterized by continuous innovation, strategic partnerships, and technological advancements by key players to meet the growing demand for sophisticated in-vehicle display solutions. Companies are focusing on developing high-resolution, customizable, and AR-integrated clusters to cater to the evolving preferences of automakers and consumers. Moreover, collaborations with automotive OEMs, investments in R&D, and expansion into emerging markets are prominent strategies being employed to strengthen market presence. The competitive environment is further intensified by the rising adoption of electric and autonomous vehicles, which require advanced digital cluster systems. The market includes a mix of established automotive electronics suppliers and emerging tech innovators, all striving to gain a competitive edge through cutting-edge technology and differentiation in design and functionality.
Key Companies:
- Continental AG
- Bosch
- Denso Corporation
- Visteon Corporation
- Magneti Marelli S.p.A.
- Panasonic Corporation
- Hyundai Mobis
- Aptiv PLC
- Faurecia SE
- Valeo SA
- LG Electronics
- Mitsubishi Electric Corporation
- Yazaki Corporation
- Samsung Electronics
- ZF Friedrichshafen AG
- NTT Advanced Technology Corporation
- Renesas Electronics Corporation
- Hitachi Automotive Systems
- Johnson Controls
- Pioneer Corporation
Recent Development
- In April 2025, Visteon and Qualcomm Technologies announced a collaboration at Auto Shanghai 2025 to deliver a high-performance cockpit system powered by cognitoAI and the Snapdragon Cockpit Elite Platform. This advancement strengthened the Global Automotive 3D Digital Instrument Cluster Market by accelerating innovation in intelligent displays, enhancing processing capability, and supporting more immersive, AI-driven driver information experiences across next-generation vehicles.
- In November 2025, Genesis introduced the G70 Prestige Graphite trim for the North American market, emphasizing enhanced design, premium craftsmanship, and a more dynamic driving experience. This launch positively influenced the Global Automotive 3D Digital Instrument Cluster Market by reinforcing consumer expectations for advanced, visually rich digital displays and encouraging broader adoption of high-end cockpit technologies in performance-oriented vehicles.
Frequently Asked Questions (FAQ) :
Q1. What are the main growth-driving factors for this market?
The market is primarily driven by the increasing integration of advanced technology in vehicles, such as connected cars and autonomous driving systems. Consumers are demanding enhanced safety features and a better user experience, which 3D digital clusters provide through customizable, high-resolution displays and intuitive Human-Machine Interaction (HMI) interfaces.
Q2. What are the main restraining factors for this market?
The main obstacle is the high initial cost of digital and 3D cluster technology, which includes complex display screens and integrated circuits. This high cost limits adoption, especially in budget or entry-level vehicles. Additionally, the risk of cyberattacks targeting these connected digital systems poses a significant security challenge.
Q3. Which segment is expected to witness high growth?
The highest growth is anticipated in the Passenger Car segment. This growth is fueled by Original Equipment Manufacturers (OEMs) increasingly installing digital clusters, even in mid-range models, to enhance the vehicle's interior appeal and functionality. The rapid growth of the Electric Vehicle (EV) market further accelerates this trend.
Q4. Who are the top major players for this market?
The market is dominated by major automotive technology suppliers who invest heavily in digital cockpit innovation. Key players include established companies such as Robert Bosch GmbH, Continental AG, Denso Corporation, and Visteon Corporation. These companies compete on advanced graphics, integration capabilities, and display resolution.
Q5. Which country is the largest player?
The Asia Pacific region, led by countries like China and Japan, currently holds the largest market share. This dominance is attributed to high vehicle production volumes, increasing disposable income leading to greater adoption of luxury and premium cars, and supportive government initiatives for adopting advanced automotive technologies.
List of Figures
Figure 1: Global Automotive 3D Digital Instrument Cluster Market Revenue Breakdown (USD Billion, %) by Region, 2022 & 2029
Figure 2: Global Automotive 3D Digital Instrument Cluster Market Value Share (%), By Segment 1, 2022 & 2029
Figure 3: Global Automotive 3D Digital Instrument Cluster Market Forecast (USD Billion), by Sub-Segment 1, 2018-2029
Figure 4: Global Automotive 3D Digital Instrument Cluster Market Forecast (USD Billion), by Sub-Segment 2, 2018-2029
Figure 5: Global Automotive 3D Digital Instrument Cluster Market Value Share (%), By Segment 2, 2022 & 2029
Figure 6: Global Automotive 3D Digital Instrument Cluster Market Forecast (USD Billion), by Sub-Segment 1, 2018-2029
Figure 7: Global Automotive 3D Digital Instrument Cluster Market Forecast (USD Billion), by Sub-Segment 2, 2018-2029
Figure 8: Global Automotive 3D Digital Instrument Cluster Market Forecast (USD Billion), by Sub-Segment 3, 2018-2029
Figure 9: Global Automotive 3D Digital Instrument Cluster Market Forecast (USD Billion), by Others, 2018-2029
Figure 10: Global Automotive 3D Digital Instrument Cluster Market Value Share (%), By Segment 3, 2022 & 2029
Figure 11: Global Automotive 3D Digital Instrument Cluster Market Forecast (USD Billion), by Sub-Segment 1, 2018-2029
Figure 12: Global Automotive 3D Digital Instrument Cluster Market Forecast (USD Billion), by Sub-Segment 2, 2018-2029
Figure 13: Global Automotive 3D Digital Instrument Cluster Market Forecast (USD Billion), by Sub-Segment 3, 2018-2029
Figure 14: Global Automotive 3D Digital Instrument Cluster Market Forecast (USD Billion), by Others, 2018-2029
Figure 15: Global Automotive 3D Digital Instrument Cluster Market Value (USD Billion), by Region, 2022 & 2029
Figure 16: North America Automotive 3D Digital Instrument Cluster Market Value Share (%), By Segment 1, 2022 & 2029
Figure 17: North America Automotive 3D Digital Instrument Cluster Market Forecast (USD Billion), by Sub-Segment 1, 2018-2029
Figure 18: North America Automotive 3D Digital Instrument Cluster Market Forecast (USD Billion), by Sub-Segment 2, 2018-2029
Figure 19: North America Automotive 3D Digital Instrument Cluster Market Value Share (%), By Segment 2, 2022 & 2029
Figure 20: North America Automotive 3D Digital Instrument Cluster Market Forecast (USD Billion), by Sub-Segment 1, 2018-2029
Figure 21: North America Automotive 3D Digital Instrument Cluster Market Forecast (USD Billion), by Sub-Segment 2, 2018-2029
Figure 22: North America Automotive 3D Digital Instrument Cluster Market Forecast (USD Billion), by Sub-Segment 3, 2018-2029
Figure 23: North America Automotive 3D Digital Instrument Cluster Market Forecast (USD Billion), by Others, 2018-2029
Figure 24: North America Automotive 3D Digital Instrument Cluster Market Value Share (%), By Segment 3, 2022 & 2029
Figure 25: North America Automotive 3D Digital Instrument Cluster Market Forecast (USD Billion), by Sub-Segment 1, 2018-2029
Figure 26: North America Automotive 3D Digital Instrument Cluster Market Forecast (USD Billion), by Sub-Segment 2, 2018-2029
Figure 27: North America Automotive 3D Digital Instrument Cluster Market Forecast (USD Billion), by Sub-Segment 3, 2018-2029
Figure 28: North America Automotive 3D Digital Instrument Cluster Market Forecast (USD Billion), by Others, 2018-2029
Figure 29: North America Automotive 3D Digital Instrument Cluster Market Forecast (USD Billion), by U.S., 2018-2029
Figure 30: North America Automotive 3D Digital Instrument Cluster Market Forecast (USD Billion), by Canada, 2018-2029
Figure 31: Latin America Automotive 3D Digital Instrument Cluster Market Value Share (%), By Segment 1, 2022 & 2029
Figure 32: Latin America Automotive 3D Digital Instrument Cluster Market Forecast (USD Billion), by Sub-Segment 1, 2018-2029
Figure 33: Latin America Automotive 3D Digital Instrument Cluster Market Forecast (USD Billion), by Sub-Segment 2, 2018-2029
Figure 34: Latin America Automotive 3D Digital Instrument Cluster Market Value Share (%), By Segment 2, 2022 & 2029
Figure 35: Latin America Automotive 3D Digital Instrument Cluster Market Forecast (USD Billion), by Sub-Segment 1, 2018-2029
Figure 36: Latin America Automotive 3D Digital Instrument Cluster Market Forecast (USD Billion), by Sub-Segment 2, 2018-2029
Figure 37: Latin America Automotive 3D Digital Instrument Cluster Market Forecast (USD Billion), by Sub-Segment 3, 2018-2029
Figure 38: Latin America Automotive 3D Digital Instrument Cluster Market Forecast (USD Billion), by Others, 2018-2029
Figure 39: Latin America Automotive 3D Digital Instrument Cluster Market Value Share (%), By Segment 3, 2022 & 2029
Figure 40: Latin America Automotive 3D Digital Instrument Cluster Market Forecast (USD Billion), by Sub-Segment 1, 2018-2029
Figure 41: Latin America Automotive 3D Digital Instrument Cluster Market Forecast (USD Billion), by Sub-Segment 2, 2018-2029
Figure 42: Latin America Automotive 3D Digital Instrument Cluster Market Forecast (USD Billion), by Sub-Segment 3, 2018-2029
Figure 43: Latin America Automotive 3D Digital Instrument Cluster Market Forecast (USD Billion), by Others, 2018-2029
Figure 44: Latin America Automotive 3D Digital Instrument Cluster Market Forecast (USD Billion), by Brazil, 2018-2029
Figure 45: Latin America Automotive 3D Digital Instrument Cluster Market Forecast (USD Billion), by Mexico, 2018-2029
Figure 46: Latin America Automotive 3D Digital Instrument Cluster Market Forecast (USD Billion), by Rest of Latin America, 2018-2029
Figure 47: Europe Automotive 3D Digital Instrument Cluster Market Value Share (%), By Segment 1, 2022 & 2029
Figure 48: Europe Automotive 3D Digital Instrument Cluster Market Forecast (USD Billion), by Sub-Segment 1, 2018-2029
Figure 49: Europe Automotive 3D Digital Instrument Cluster Market Forecast (USD Billion), by Sub-Segment 2, 2018-2029
Figure 50: Europe Automotive 3D Digital Instrument Cluster Market Value Share (%), By Segment 2, 2022 & 2029
Figure 51: Europe Automotive 3D Digital Instrument Cluster Market Forecast (USD Billion), by Sub-Segment 1, 2018-2029
Figure 52: Europe Automotive 3D Digital Instrument Cluster Market Forecast (USD Billion), by Sub-Segment 2, 2018-2029
Figure 53: Europe Automotive 3D Digital Instrument Cluster Market Forecast (USD Billion), by Sub-Segment 3, 2018-2029
Figure 54: Europe Automotive 3D Digital Instrument Cluster Market Forecast (USD Billion), by Others, 2018-2029
Figure 55: Europe Automotive 3D Digital Instrument Cluster Market Value Share (%), By Segment 3, 2022 & 2029
Figure 56: Europe Automotive 3D Digital Instrument Cluster Market Forecast (USD Billion), by Sub-Segment 1, 2018-2029
Figure 57: Europe Automotive 3D Digital Instrument Cluster Market Forecast (USD Billion), by Sub-Segment 2, 2018-2029
Figure 58: Europe Automotive 3D Digital Instrument Cluster Market Forecast (USD Billion), by Sub-Segment 3, 2018-2029
Figure 59: Europe Automotive 3D Digital Instrument Cluster Market Forecast (USD Billion), by Others, 2018-2029
Figure 60: Europe Automotive 3D Digital Instrument Cluster Market Forecast (USD Billion), by U.K., 2018-2029
Figure 61: Europe Automotive 3D Digital Instrument Cluster Market Forecast (USD Billion), by Germany, 2018-2029
Figure 62: Europe Automotive 3D Digital Instrument Cluster Market Forecast (USD Billion), by France, 2018-2029
Figure 63: Europe Automotive 3D Digital Instrument Cluster Market Forecast (USD Billion), by Italy, 2018-2029
Figure 64: Europe Automotive 3D Digital Instrument Cluster Market Forecast (USD Billion), by Spain, 2018-2029
Figure 65: Europe Automotive 3D Digital Instrument Cluster Market Forecast (USD Billion), by Russia, 2018-2029
Figure 66: Europe Automotive 3D Digital Instrument Cluster Market Forecast (USD Billion), by Rest of Europe, 2018-2029
Figure 67: Asia Pacific Automotive 3D Digital Instrument Cluster Market Value Share (%), By Segment 1, 2022 & 2029
Figure 68: Asia Pacific Automotive 3D Digital Instrument Cluster Market Forecast (USD Billion), by Sub-Segment 1, 2018-2029
Figure 69: Asia Pacific Automotive 3D Digital Instrument Cluster Market Forecast (USD Billion), by Sub-Segment 2, 2018-2029
Figure 70: Asia Pacific Automotive 3D Digital Instrument Cluster Market Value Share (%), By Segment 2, 2022 & 2029
Figure 71: Asia Pacific Automotive 3D Digital Instrument Cluster Market Forecast (USD Billion), by Sub-Segment 1, 2018-2029
Figure 72: Asia Pacific Automotive 3D Digital Instrument Cluster Market Forecast (USD Billion), by Sub-Segment 2, 2018-2029
Figure 73: Asia Pacific Automotive 3D Digital Instrument Cluster Market Forecast (USD Billion), by Sub-Segment 3, 2018-2029
Figure 74: Asia Pacific Automotive 3D Digital Instrument Cluster Market Forecast (USD Billion), by Others, 2018-2029
Figure 75: Asia Pacific Automotive 3D Digital Instrument Cluster Market Value Share (%), By Segment 3, 2022 & 2029
Figure 76: Asia Pacific Automotive 3D Digital Instrument Cluster Market Forecast (USD Billion), by Sub-Segment 1, 2018-2029
Figure 77: Asia Pacific Automotive 3D Digital Instrument Cluster Market Forecast (USD Billion), by Sub-Segment 2, 2018-2029
Figure 78: Asia Pacific Automotive 3D Digital Instrument Cluster Market Forecast (USD Billion), by Sub-Segment 3, 2018-2029
Figure 79: Asia Pacific Automotive 3D Digital Instrument Cluster Market Forecast (USD Billion), by Others, 2018-2029
Figure 80: Asia Pacific Automotive 3D Digital Instrument Cluster Market Forecast (USD Billion), by China, 2018-2029
Figure 81: Asia Pacific Automotive 3D Digital Instrument Cluster Market Forecast (USD Billion), by India, 2018-2029
Figure 82: Asia Pacific Automotive 3D Digital Instrument Cluster Market Forecast (USD Billion), by Japan, 2018-2029
Figure 83: Asia Pacific Automotive 3D Digital Instrument Cluster Market Forecast (USD Billion), by Australia, 2018-2029
Figure 84: Asia Pacific Automotive 3D Digital Instrument Cluster Market Forecast (USD Billion), by Southeast Asia, 2018-2029
Figure 85: Asia Pacific Automotive 3D Digital Instrument Cluster Market Forecast (USD Billion), by Rest of Asia Pacific, 2018-2029
Figure 86: Middle East & Africa Automotive 3D Digital Instrument Cluster Market Value Share (%), By Segment 1, 2022 & 2029
Figure 87: Middle East & Africa Automotive 3D Digital Instrument Cluster Market Forecast (USD Billion), by Sub-Segment 1, 2018-2029
Figure 88: Middle East & Africa Automotive 3D Digital Instrument Cluster Market Forecast (USD Billion), by Sub-Segment 2, 2018-2029
Figure 89: Middle East & Africa Automotive 3D Digital Instrument Cluster Market Value Share (%), By Segment 2, 2022 & 2029
Figure 90: Middle East & Africa Automotive 3D Digital Instrument Cluster Market Forecast (USD Billion), by Sub-Segment 1, 2018-2029
Figure 91: Middle East & Africa Automotive 3D Digital Instrument Cluster Market Forecast (USD Billion), by Sub-Segment 2, 2018-2029
Figure 92: Middle East & Africa Automotive 3D Digital Instrument Cluster Market Forecast (USD Billion), by Sub-Segment 3, 2018-2029
Figure 93: Middle East & Africa Automotive 3D Digital Instrument Cluster Market Forecast (USD Billion), by Others, 2018-2029
Figure 94: Middle East & Africa Automotive 3D Digital Instrument Cluster Market Value Share (%), By Segment 3, 2022 & 2029
Figure 95: Middle East & Africa Automotive 3D Digital Instrument Cluster Market Forecast (USD Billion), by Sub-Segment 1, 2018-2029
Figure 96: Middle East & Africa Automotive 3D Digital Instrument Cluster Market Forecast (USD Billion), by Sub-Segment 2, 2018-2029
Figure 97: Middle East & Africa Automotive 3D Digital Instrument Cluster Market Forecast (USD Billion), by Sub-Segment 3, 2018-2029
Figure 98: Middle East & Africa Automotive 3D Digital Instrument Cluster Market Forecast (USD Billion), by Others, 2018-2029
Figure 99: Middle East & Africa Automotive 3D Digital Instrument Cluster Market Forecast (USD Billion), by GCC, 2018-2029
Figure 100: Middle East & Africa Automotive 3D Digital Instrument Cluster Market Forecast (USD Billion), by South Africa, 2018-2029
Figure 101: Middle East & Africa Automotive 3D Digital Instrument Cluster Market Forecast (USD Billion), by Rest of Middle East & Africa, 2018-2029
List of Tables
Table 1: Global Automotive 3D Digital Instrument Cluster Market Revenue (USD Billion) Forecast, by Segment 1, 2018-2029
Table 2: Global Automotive 3D Digital Instrument Cluster Market Revenue (USD Billion) Forecast, by Segment 2, 2018-2029
Table 3: Global Automotive 3D Digital Instrument Cluster Market Revenue (USD Billion) Forecast, by Segment 3, 2018-2029
Table 4: Global Automotive 3D Digital Instrument Cluster Market Revenue (USD Billion) Forecast, by Region, 2018-2029
Table 5: North America Automotive 3D Digital Instrument Cluster Market Revenue (USD Billion) Forecast, by Segment 1, 2018-2029
Table 6: North America Automotive 3D Digital Instrument Cluster Market Revenue (USD Billion) Forecast, by Segment 2, 2018-2029
Table 7: North America Automotive 3D Digital Instrument Cluster Market Revenue (USD Billion) Forecast, by Segment 3, 2018-2029
Table 8: North America Automotive 3D Digital Instrument Cluster Market Revenue (USD Billion) Forecast, by Country, 2018-2029
Table 9: Europe Automotive 3D Digital Instrument Cluster Market Revenue (USD Billion) Forecast, by Segment 1, 2018-2029
Table 10: Europe Automotive 3D Digital Instrument Cluster Market Revenue (USD Billion) Forecast, by Segment 2, 2018-2029
Table 11: Europe Automotive 3D Digital Instrument Cluster Market Revenue (USD Billion) Forecast, by Segment 3, 2018-2029
Table 12: Europe Automotive 3D Digital Instrument Cluster Market Revenue (USD Billion) Forecast, by Country, 2018-2029
Table 13: Latin America Automotive 3D Digital Instrument Cluster Market Revenue (USD Billion) Forecast, by Segment 1, 2018-2029
Table 14: Latin America Automotive 3D Digital Instrument Cluster Market Revenue (USD Billion) Forecast, by Segment 2, 2018-2029
Table 15: Latin America Automotive 3D Digital Instrument Cluster Market Revenue (USD Billion) Forecast, by Segment 3, 2018-2029
Table 16: Latin America Automotive 3D Digital Instrument Cluster Market Revenue (USD Billion) Forecast, by Country, 2018-2029
Table 17: Asia Pacific Automotive 3D Digital Instrument Cluster Market Revenue (USD Billion) Forecast, by Segment 1, 2018-2029
Table 18: Asia Pacific Automotive 3D Digital Instrument Cluster Market Revenue (USD Billion) Forecast, by Segment 2, 2018-2029
Table 19: Asia Pacific Automotive 3D Digital Instrument Cluster Market Revenue (USD Billion) Forecast, by Segment 3, 2018-2029
Table 20: Asia Pacific Automotive 3D Digital Instrument Cluster Market Revenue (USD Billion) Forecast, by Country, 2018-2029
Table 21: Middle East & Africa Automotive 3D Digital Instrument Cluster Market Revenue (USD Billion) Forecast, by Segment 1, 2018-2029
Table 22: Middle East & Africa Automotive 3D Digital Instrument Cluster Market Revenue (USD Billion) Forecast, by Segment 2, 2018-2029
Table 23: Middle East & Africa Automotive 3D Digital Instrument Cluster Market Revenue (USD Billion) Forecast, by Segment 3, 2018-2029
Table 24: Middle East & Africa Automotive 3D Digital Instrument Cluster Market Revenue (USD Billion) Forecast, by Country, 2018-2029
Research Process
Data Library Research are conducted by industry experts who offer insight on
industry structure, market segmentations technology assessment and competitive landscape (CL), and penetration, as well as on emerging trends. Their analysis is based on primary interviews (~ 80%) and secondary research (~ 20%) as well as years of professional expertise in their respective industries. Adding to this, by analysing historical trends and current market positions, our analysts predict where the market will be headed for the next five years. Furthermore, the varying trends of segment & categories geographically presented are also studied and the estimated based on the primary & secondary research.
In this particular report from the supply side Data Library Research has conducted primary surveys (interviews) with the key level executives (VP, CEO’s, Marketing Director, Business Development Manager
and SOFT) of the companies that active & prominent as well as the midsized organization
FIGURE 1: DLR RESEARH PROCESS
![research-methodology1]()
Primary Research
Extensive primary research was conducted to gain a deeper insight of the market and industry performance. The analysis is based on both primary and secondary research as well as years of professional expertise in the respective industries.
In addition to analysing current and historical trends, our analysts predict where the market is headed over the next five years.
It varies by segment for these categories geographically presented in the list of market tables. Speaking about this particular report we have conducted primary surveys (interviews) with the key level executives (VP, CEO’s, Marketing Director, Business Development Manager and many more) of the major players active in the market.
Secondary Research
Secondary research was mainly used to collect and identify information useful for the extensive, technical, market-oriented, and Friend’s study of the Global Extra Neutral Alcohol. It was also used to obtain key information about major players, market classification and segmentation according to the industry trends, geographical markets, and developments related to the market and technology perspectives. For this study, analysts have gathered information from various credible sources, such as annual reports, sec filings, journals, white papers, SOFT presentations, and company web sites.
Market Size Estimation
Both, top-down and bottom-up approaches were used to estimate and validate the size of the Global market and to estimate the size of various other dependent submarkets in the overall Extra Neutral Alcohol. The key players in the market were identified through secondary research and their market contributions in the respective geographies were determined through primary and secondary research.
Forecast Model
![research-methodology2]()