Superconducting Magnetic Resonance Instrument Market Overview and Analysis

The global superconducting magnetic resonance (Superconducting MR) instrument market is booming, projected to reach USD 4.5 billion by 2032, from USD 1.9 billion in 2025 at an 8.9% CAGR 2025-2032.

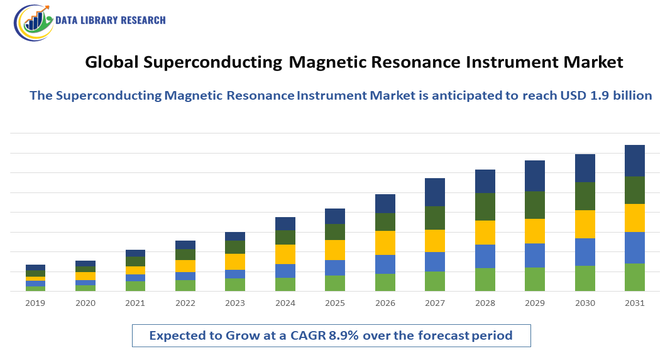
The Global Superconducting Magnetic Resonance Instrument Market comprises advanced imaging and analytical systems that use superconducting magnets to generate high magnetic fields for applications in healthcare, research, and industrial diagnostics. These instruments enable high-resolution MRI scans, molecular analysis, and material characterization. Market growth is driven by rising medical imaging demand, technological advancements, and expanding research in biotechnology, pharmaceuticals, and materials science.

The growth of the Global Superconducting Magnetic Resonance Instrument Market is driven by increasing demand for high-resolution imaging in healthcare, expanding applications in biotechnology and pharmaceutical research, and rising investments in advanced diagnostic technologies. Technological advancements in superconducting magnets, improved system stability, and enhanced imaging accuracy further accelerate adoption. Additionally, the growing prevalence of chronic diseases, the need for precise molecular analysis, and expanding research activities in materials science significantly contribute to market expansion.

Superconducting Magnetic Resonance Instrument Market Latest Trends

 The Global Superconducting Magnetic Resonance Instrument Market is witnessing strong growth driven by rising demand for high-resolution imaging and advanced analytical tools. Healthcare systems are increasingly adopting superconducting MRI machines for superior accuracy in diagnosing neurological, cardiovascular, and musculoskeletal disorders. In research, the use of high-field NMR and spectroscopy systems is expanding, especially in pharmaceuticals, biotechnology, and materials science. Another key trend is the shift toward cryogen-free superconducting magnets, which lower operating costs and reduce dependence on liquid helium.

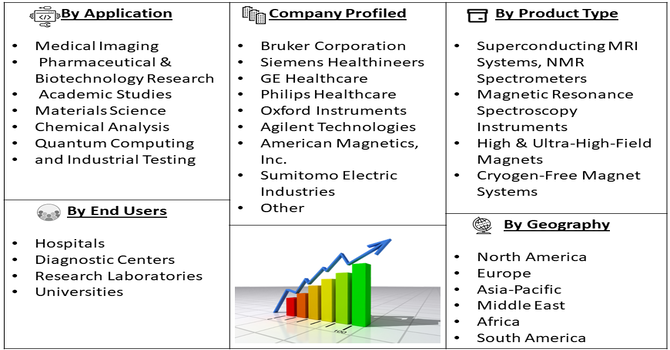
Segmentation: The Global Superconducting Magnetic Resonance Instrument Market is segmented by Product Type (Superconducting MRI Systems, NMR Spectrometers, Magnetic Resonance Spectroscopy Instruments, High & Ultra-High-Field Magnets, and Cryogen-Free Magnet Systems), Magnetic Field Strength (Low, Mid, High, and Ultra-High-Field Instruments), Cooling Technology (Liquid Helium, Liquid Nitrogen, and Cryogen-Free Systems), Application (Medical Imaging, Pharmaceutical & Biotechnology Research, Academic Studies, Materials Science, Chemical Analysis, Quantum Computing, and Industrial Testing), End Users (Hospitals, Diagnostic Centers, Research Laboratories, Universities, Government Institutes, and Industrial Facilities), and Geography (North America, Europe, Asia-Pacific, Middle East and Africa, and South America). The report provides the value (in USD million) for the above segments.

Market Drivers:

  • Rising Demand for High-Resolution Diagnostic Imaging

A major driver of the global superconducting magnetic resonance market is the growing need for high-resolution diagnostic imaging in healthcare. Superconducting MRI systems offer superior magnetic field strength, enabling clearer, more accurate visualization of soft tissues, neurological structures, and cardiovascular conditions. As chronic diseases rise worldwide, hospitals increasingly rely on advanced imaging to support early diagnosis and personalized treatment. Technological advancements, including improved magnet stability and integration with AI-enhanced image analysis, further strengthen adoption. The expansion of healthcare infrastructure in developing regions and rising patient awareness also contribute to market growth, making superconducting MRI an essential diagnostic tool globally.

  • Expanding Applications in Research and Biotechnology

Another key driver is the increasing use of superconducting magnetic resonance instruments in pharmaceuticals, biotechnology, and materials science. High-field NMR and magnetic resonance spectroscopy systems enable precise molecular characterization, supporting drug discovery, biomarker identification, and advanced chemical analysis. Growing investment in life sciences research, coupled with expanding academic–industry collaborations, has accelerated the adoption of these instruments. For instance, in March 2025, Andhra Pradesh’s Health Minister, Y. Satya Kumar, met Union Minister Dr. Jitendra Singh in the national capital to discuss enhancing collaboration in biotechnology. They explored ways to upscale state biotechnology projects and strengthen ongoing initiatives with central support. Satya Kumar emphasized Andhra Pradesh’s commitment to leveraging biotechnology for healthcare and industrial applications. This focus boosted the global superconducting magnetic resonance instrument market, as increased biotechnology initiatives drive demand for advanced research tools and expand applications in molecular analysis and scientific research.

Market Restraints:

  • High Installation and Operational Costs

Despite strong demand, the global market faces a significant restraint due to the high installation, operation, and maintenance costs associated with superconducting magnetic resonance instruments. These systems require complex cooling infrastructure, often involving cryogenic technologies, which increases overall ownership expenses. Smaller hospitals, diagnostic centers, and research labs struggle to afford such advanced equipment, limiting widespread adoption. Additionally, the need for specialized technical expertise for operation and maintenance further elevates costs and slows implementation. Budgetary constraints in developing regions and fluctuating funding for research infrastructure also hinder growth, creating a financial barrier that restricts broader market penetration despite technological advantages.

Socio Economic Impact on Superconducting Magnetic Resonance Instrument Market

The market’s expansion carries significant socio-economic benefits by enabling earlier disease detection, improving treatment outcomes, and reducing long-term healthcare expenditures. Wider access to advanced medical imaging strengthens public health infrastructure, particularly in developing economies. The growth of superconducting resonance technology also supports high-skilled job creation in engineering, medical physics, and research. Increased investment in superconducting instruments stimulates innovation across healthcare, biotechnology, and materials science, fostering regional competitiveness. Additionally, advancements in these systems contribute to scientific breakthroughs, promoting knowledge-based economic development and encouraging government funding in cutting-edge research fields that rely on ultra-precise analytical capabilities.

Segmental Analysis:

  • Superconducting MRI Systems segment is expected to witness highest growth over the forecast period

The superconducting MRI systems segment is expected to witness the highest growth over the forecast period due to increasing global demand for advanced, high-resolution diagnostic imaging. These systems provide superior magnetic field strength, enabling precise visualization of neurological disorders, musculoskeletal conditions, and cardiovascular diseases. Rising prevalence of chronic illnesses, technological improvements in imaging clarity, and expanding hospital infrastructure are further driving adoption. Additionally, growing integration of AI-based imaging analytics and the shift toward minimally invasive diagnostics support wider use of superconducting MRI systems. Government investments in modernizing healthcare facilities and the need for faster, more accurate diagnoses also contribute significantly to segment growth.

  • Ultra-High-Field Instruments segment is expected to witness highest growth over the forecast period

The ultra-high-field instruments segment is projected to experience the fastest growth thanks to escalating demand for deeper molecular insights in research and advanced clinical diagnostics. Instruments operating above 7T provide unmatched resolution and sensitivity, supporting cutting-edge studies in neuroimaging, metabolomics, structural biology, and materials science. As pharmaceutical and biotechnology companies increase investment in complex molecular research, the need for ultra-high-field NMR and MRI technologies rises. Academic institutions and research centers are also adopting these systems to accelerate discoveries in quantum physics and life sciences. Continuous advancements in magnet stability and data-processing capabilities further enhance usability, making ultra-high-field systems indispensable in next-generation scientific exploration.

  • Cryogen-Free Systems segment is expected to witness highest growth over the forecast period

The cryogen-free systems segment is poised for substantial growth as users seek cost-effective, low-maintenance alternatives to traditional liquid helium–cooled superconducting instruments. These systems eliminate dependency on scarce and expensive cryogens, making them more accessible for smaller laboratories and institutions with limited budgets. Their compact design, improved energy efficiency, and easier installation also appeal to a wider range of applications in research and industrial testing. Growing environmental concerns and supply-chain volatility surrounding helium further accelerate the push toward cryogen-free technologies. Additionally, advancements in closed-cycle cryocoolers enhance cooling reliability, expanding adoption across spectroscopy, materials analysis, and emerging quantum research fields.

  • Medical Imaging segment is expected to witness highest growth over the forecast period

The medical imaging segment is expected to witness the highest growth due to increasing demand for precise, non-invasive diagnostic solutions worldwide. Superconducting MRI systems have become essential for detecting complex neurological, oncological, and cardiovascular conditions with high accuracy. Rising healthcare expenditure, advancements in imaging technologies, and growing awareness of early diagnosis contribute significantly to market expansion. Aging populations and the rising burden of chronic diseases further drive adoption. Moreover, hospitals and diagnostic centers are increasingly upgrading to high-field MRI systems for better throughput and diagnostic reliability. Government healthcare modernization programs and technological integration, including AI-assisted imaging tools, also fuel sustained growth in this segment.

  • Research Laboratories segment is expected to witness highest growth over the forecast period

The research laboratories segment is set to grow rapidly as global investment in scientific research intensifies across pharmaceuticals, biotechnology, materials science, and quantum technology. Superconducting magnetic resonance instruments, especially high-field NMR and spectroscopy systems, play a crucial role in molecular characterization, drug discovery, and structural analysis. Universities, government-funded research institutes, and private R&D organizations are expanding their infrastructure to support advanced studies requiring high magnetic precision. Increased grants and research collaborations further boost demand. Additionally, innovations in magnet stability, data processing, and cryogen-free technologies make superconducting instruments more accessible to academic labs, enabling broader adoption and accelerating scientific breakthroughs.

  • North America region is expected to witness highest growth over the forecast period

North America is expected to witness the highest growth over the forecast period due to strong healthcare infrastructure, significant investment in medical imaging technologies, and a robust presence of leading manufacturers. The region has a high adoption rate of advanced MRI, NMR, and spectroscopy systems driven by increasing chronic disease prevalence and emphasis on early diagnosis.

Additionally, the U.S. leads in R&D spending across pharmaceuticals, biotechnology, and quantum technology, fueling demand for high-field superconducting instruments. For instance, in Apil 2025, At the Joint ENC-ISMAR Conference 2025, Bruker Corporation announced the successful development and testing of the world’s first high-resolution 1.3 GHz NMR spectrometer featuring a stable, standard-bore 54 mm superconducting magnet. This groundbreaking ultra-high-field system pushed the limits of NMR research, offering unprecedented dispersion and resolution. The innovation strengthened the global superconducting magnetic resonance instrument market by driving demand for ultra-high-field systems in advanced research, pharmaceutical development, and molecular-level studies. Supportive government funding, well-established academic research institutions, and continuous technological advancements further strengthen market expansion. The presence of skilled professionals and favorable regulatory standards also contribute to sustained regional growth.

Thus, such factors are driving the growth of above market in this region.

Superconducting Magnetic Resonance Instrument Market Competitive Landscape:

The competitive landscape is characterized by the presence of major global players specializing in superconducting magnets, MRI systems, and high-field NMR instruments. Companies compete through continuous R&D investment, focusing on enhancing magnetic field stability, imaging resolution, and overall system efficiency. Leading manufacturers emphasize cryogen-free technologies and improved cooling systems to lower ownership costs. Strategic partnerships with universities, research institutes, and healthcare providers strengthen product development pipelines. Market competition also centers on offering integrated software, superior service support, and customizable solutions. As demand from healthcare, pharmaceuticals, and materials science grows, companies are expanding their portfolios to maintain technological leadership.

The major players for above market are:

  • Bruker Corporation
  • Siemens Healthineers
  • GE Healthcare
  • Philips Healthcare
  • Oxford Instruments
  • Agilent Technologies
  • American Magnetics, Inc.
  • Sumitomo Electric Industries
  • Cryomagnetics, Inc.
  • Tesla Engineering Ltd.
  • Quantum Design, Inc.
  • ASG Superconductors S.p.A.
  • Jastec Co., Ltd. (Japan Superconductor Technology)
  • Western Superconducting Technologies (China)
  • Cryogenic Ltd.
  • Advanced Magnet Lab, Inc.
  • Magnex Scientific
  • Bilfinger SE (Noell)
  • SuNAM Co., Ltd.
  • Magnetica Limited


Recent Development

  • In March 2025, Oxford Instruments NanoScience launched the TeslatronPT Plus, a superconducting magnet measurement system with open architecture and remote control, integrating Lake Shore’s M81 and M91 controllers for flexible, scalable measurements. Demonstrated at the APS Global Physics Summit 2025, it showcased automated operation and real-time data visualization. This launch boosted the global superconducting magnetic resonance instrument market by enhancing research capabilities and encouraging adoption in academic and materials science laboratories.


  • In February 2025, Wellumio enrolled the first patient in a feasibility, safety, and usability study of its Axana 0.1T portable MRI device, designed to detect acute stroke in emergency department patients. The device’s compact, bedside design enabled rapid assessment of brain tissue and identification of stroke biomarkers, including diffusion-weighted imaging. A hospital in Melbourne, Australia, conducted the first scan on a 77-year-old patient. This development enhanced the global superconducting magnetic resonance instrument market by expanding portable, point-of-care MRI applications and driving adoption in emergency and clinical settings.


Frequently Asked Questions (FAQ) :

Q1. What are the main growth-driving factors for this market?

The market is primarily driven by the increasing global burden of chronic diseases, such as cancer, neurological disorders, and cardiovascular issues, where MRI offers superior soft-tissue contrast for accurate diagnosis. Furthermore, the aging global population requires more advanced diagnostic imaging services. Technological advancements, including the development of ultra-high-field (UHF) MRI systems (7 Tesla and above) and the integration of Artificial Intelligence (AI) for faster processing and enhanced image quality, are continually expanding the clinical utility and demand for these instruments.

Q2. What are the main restraining factors for this market?

The main challenge facing this market is the prohibitively high capital cost associated with purchasing and installing superconducting MRI instruments. These machines, especially high-field systems, require significant financial investment and specialized infrastructure, including cryogen management and radio-frequency shielding. Additionally, the scarcity of skilled professionals like MR physicists and certified radiographers needed to operate and maintain these complex systems effectively in certain regions acts as a major barrier to wider adoption in emerging economies.

Q3. Which segment is expected to witness high growth?

The Clinical Applications segment, specifically for neuroimaging and oncology, is expected to witness the highest growth. Neuroimaging, which utilizes the detailed soft-tissue contrast of MRI to diagnose conditions like Alzheimer's, stroke, and multiple sclerosis, is expanding rapidly due to rising neurological disease rates. The continuous advancement in techniques like fMRI (functional MRI) and diffusion tensor imaging (DTI) further solidifies MRI's role as the gold standard diagnostic tool, ensuring sustained demand from hospitals and specialized diagnostic centers globally.

Q4. Who are the top major players for this market?

The Superconducting Magnetic Resonance Instrument market is highly consolidated, dominated by a few global medical imaging giants. The top major players include Siemens Healthineers, General Electric (GE) Healthcare, Philips Healthcare, and Canon Medical Systems. These companies leverage their extensive research and development capabilities, global distribution networks, and large installed bases to maintain market leadership. They compete primarily on field strength, technological innovation (like helium-free magnet designs), and service agreements.

Q5. Which country is the largest player?

The United States holds the position as the largest market player, both in terms of revenue generation and installed base. This dominance is due to a combination of factors: high healthcare expenditure, the presence of leading academic research institutions heavily invested in ultra-high-field MRI, and rapid adoption of the latest diagnostic technologies. Furthermore, the strong operational presence and R&D facilities of the major global vendors within the U.S. contribute significantly to its market size and influence over technological trends.

Superconducting Magnetic Resonance Instrument MARKET STUDY GLOBAL MARKET ANALYSIS, INSIGHTS AND FORECAST, 2022-2029

    1. Introduction

    • 1.1. Research Scope
    • 1.2. Market Segmentation
    • 1.3. Research Methodology
    • 1.4. Definitions and Assumptions

    2. Executive Summary

      3. Market Dynamics

      • 3.1. Market Drivers
      • 3.2. Market Restraints
      • 3.3. Market Opportunities

      4. Key Insights

      • 4.1. Key Emerging Trends – For Major Countries
      • 4.2. Latest Technological Advancement
      • 4.3. Regulatory Landscape
      • 4.4. Industry SWOT Analysis
      • 4.5. Porters Five Forces Analysis

      5. Global Superconducting Magnetic Resonance Instrument Market Analysis (USD Billion), Insights and Forecast, 2018-2029

      • 5.1. Key Findings / Summary
      • 5.2. Market Analysis, Insights and Forecast – By Segment 1
        • 5.2.1. Sub-Segment 1
        • 5.2.2. Sub-Segment 2
      • 5.3. Market Analysis, Insights and Forecast – By Segment 2
        • 5.3.1. Sub-Segment 1
        • 5.3.2. Sub-Segment 2
        • 5.3.3. Sub-Segment 3
        • 5.3.4. Others
      • 5.4. Market Analysis, Insights and Forecast – By Segment 3
        • 5.4.1. Sub-Segment 1
        • 5.4.2. Sub-Segment 2
        • 5.4.3. Sub-Segment 3
        • 5.4.4. Others
      • 5.5. Market Analysis, Insights and Forecast – By Region
        • 5.5.1. North America
        • 5.5.2. Latin America
        • 5.5.3. Europe
        • 5.5.4. Asia Pacific
        • 5.5.5. Middle East and Africa

      6. North America Superconducting Magnetic Resonance Instrument Market Analysis (USD Billion), Insights and Forecast, 2018-2029

      • 6.1. Key Findings / Summary
      • 6.2. Market Analysis, Insights and Forecast – By Segment 1
        • 6.2.1. Sub-Segment 1
        • 6.2.2. Sub-Segment 2
      • 6.3. Market Analysis, Insights and Forecast – By Segment 2
        • 6.3.1. Sub-Segment 1
        • 6.3.2. Sub-Segment 2
        • 6.3.3. Sub-Segment 3
        • 6.3.4. Others
      • 6.4. Market Analysis, Insights and Forecast – By Segment 3
        • 6.4.1. Sub-Segment 1
        • 6.4.2. Sub-Segment 2
        • 6.4.3. Sub-Segment 3
        • 6.4.4. Others
      • 6.5. Market Analysis, Insights and Forecast – By Country
        • 6.5.1. U.S.
        • 6.5.2. Canada

      7. Latin America Superconducting Magnetic Resonance Instrument Market Analysis (USD Billion), Insights and Forecast, 2018-2029

      • 7.1. Key Findings / Summary
      • 7.2. Market Analysis, Insights and Forecast – By Segment 1
        • 7.2.1. Sub-Segment 1
        • 7.2.2. Sub-Segment 2
      • 7.3. Market Analysis, Insights and Forecast – By Segment 2
        • 7.3.1. Sub-Segment 1
        • 7.3.2. Sub-Segment 2
        • 7.3.3. Sub-Segment 3
        • 7.3.4. Others
      • 7.4. Market Analysis, Insights and Forecast – By Segment 3
        • 7.4.1. Sub-Segment 1
        • 7.4.2. Sub-Segment 2
        • 7.4.3. Sub-Segment 3
        • 7.4.4. Others
      • 7.5. Insights and Forecast – By Country
        • 7.5.1. Brazil
        • 7.5.2. Mexico
        • 7.5.3. Rest of Latin America

      8. Europe Superconducting Magnetic Resonance Instrument Market Analysis (USD Billion), Insights and Forecast, 2018-2029

      • 8.1. Key Findings / Summary
      • 8.2. Market Analysis, Insights and Forecast – By Segment 1
        • 8.2.1. Sub-Segment 1
        • 8.2.2. Sub-Segment 2
      • 8.3. Market Analysis, Insights and Forecast – By Segment 2
        • 8.3.1. Sub-Segment 1
        • 8.3.2. Sub-Segment 2
        • 8.3.3. Sub-Segment 3
        • 8.3.4. Others
      • 8.4. Market Analysis, Insights and Forecast – By Segment 3
        • 8.4.1. Sub-Segment 1
        • 8.4.2. Sub-Segment 2
        • 8.4.3. Sub-Segment 3
        • 8.4.4. Others
      • 8.5. Market Analysis, Insights and Forecast – By Country
        • 8.5.1. UK
        • 8.5.2. Germany
        • 8.5.3. France
        • 8.5.4. Italy
        • 8.5.5. Spain
        • 8.5.6. Russia
        • 8.5.7. Rest of Europe

      9. Asia Pacific Superconducting Magnetic Resonance Instrument Market Analysis (USD Billion), Insights and Forecast, 2018-2029

      • 9.1. Key Findings / Summary
      • 9.2. Market Analysis, Insights and Forecast – By Segment 1
        • 9.2.1. Sub-Segment 1
        • 9.2.2. Sub-Segment 2
      • 9.3. Market Analysis, Insights and Forecast – By Segment 2
        • 9.3.1. Sub-Segment 1
        • 9.3.2. Sub-Segment 2
        • 9.3.3. Sub-Segment 3
        • 9.3.4. Others
      • 9.4. Market Analysis, Insights and Forecast – By Segment 3
        • 9.4.1. Sub-Segment 1
        • 9.4.2. Sub-Segment 2
        • 9.4.3. Sub-Segment 3
        • 9.4.4. Others
      • 9.5. Market Analysis, Insights and Forecast – By Country
        • 9.5.1. China
        • 9.5.2. India
        • 9.5.3. Japan
        • 9.5.4. Australia
        • 9.5.5. South East Asia
        • 9.5.6. Rest of Asia Pacific

      10. Middle East & Africa Superconducting Magnetic Resonance Instrument Market Analysis (USD Billion), Insights and Forecast, 2018-2029

      • 10.1. Key Findings / Summary
      • 10.2. Market Analysis, Insights and Forecast – By Segment 1
        • 10.2.1. Sub-Segment 1
        • 10.2.2. Sub-Segment 2
      • 10.3. Market Analysis, Insights and Forecast – By Segment 2
        • 10.3.1. Sub-Segment 1
        • 10.3.2. Sub-Segment 2
        • 10.3.3. Sub-Segment 3
        • 10.3.4. Others
      • 10.4. Market Analysis, Insights and Forecast – By Segment 3
        • 10.4.1. Sub-Segment 1
        • 10.4.2. Sub-Segment 2
        • 10.4.3. Sub-Segment 3
        • 10.4.4. Others
      • 10.5. Market Analysis, Insights and Forecast – By Country
        • 10.5.1. GCC
        • 10.5.2. South Africa
        • 10.5.3. Rest of Middle East & Africa

      11. Competitive Analysis

      • 11.1. Company Market Share Analysis, 2018
      • 11.2. Key Industry Developments
      • 11.3. Company Profile
        • 11.3.1. Company 1
          • 11.3.1.1. Business Overview
          • 11.3.1.2. Segment 1 & Service Offering
          • 11.3.1.3. Overall Revenue
          • 11.3.1.4. Geographic Presence
          • 11.3.1.5. Recent Development
        *Similar details will be provided for the following companies
        • 11.3.2. Company 2
        • 11.3.3. Company 3
        • 11.3.4. Company 4
        • 11.3.5. Company 5
        • 11.3.6. Company 6
        • 11.3.7. Company 7
        • 11.3.8. Company 8
        • 11.3.9. Company 9
        • 11.3.10. Company 10
        • 11.3.11. Company 11
        • 11.3.12. Company 12
      List of Figures

      Figure 1: Global Superconducting Magnetic Resonance Instrument Market Revenue Breakdown (USD Billion, %) by Region, 2022 & 2029
      Figure 2: Global Superconducting Magnetic Resonance Instrument Market Value Share (%), By Segment 1, 2022 & 2029
      Figure 3: Global Superconducting Magnetic Resonance Instrument Market Forecast (USD Billion), by Sub-Segment 1, 2018-2029
      Figure 4: Global Superconducting Magnetic Resonance Instrument Market Forecast (USD Billion), by Sub-Segment 2, 2018-2029
      Figure 5: Global Superconducting Magnetic Resonance Instrument Market Value Share (%), By Segment 2, 2022 & 2029
      Figure 6: Global Superconducting Magnetic Resonance Instrument Market Forecast (USD Billion), by Sub-Segment 1, 2018-2029
      Figure 7: Global Superconducting Magnetic Resonance Instrument Market Forecast (USD Billion), by Sub-Segment 2, 2018-2029
      Figure 8: Global Superconducting Magnetic Resonance Instrument Market Forecast (USD Billion), by Sub-Segment 3, 2018-2029
      Figure 9: Global Superconducting Magnetic Resonance Instrument Market Forecast (USD Billion), by Others, 2018-2029
      Figure 10: Global Superconducting Magnetic Resonance Instrument Market Value Share (%), By Segment 3, 2022 & 2029
      Figure 11: Global Superconducting Magnetic Resonance Instrument Market Forecast (USD Billion), by Sub-Segment 1, 2018-2029
      Figure 12: Global Superconducting Magnetic Resonance Instrument Market Forecast (USD Billion), by Sub-Segment 2, 2018-2029
      Figure 13: Global Superconducting Magnetic Resonance Instrument Market Forecast (USD Billion), by Sub-Segment 3, 2018-2029
      Figure 14: Global Superconducting Magnetic Resonance Instrument Market Forecast (USD Billion), by Others, 2018-2029
      Figure 15: Global Superconducting Magnetic Resonance Instrument Market Value (USD Billion), by Region, 2022 & 2029
      Figure 16: North America Superconducting Magnetic Resonance Instrument Market Value Share (%), By Segment 1, 2022 & 2029
      Figure 17: North America Superconducting Magnetic Resonance Instrument Market Forecast (USD Billion), by Sub-Segment 1, 2018-2029
      Figure 18: North America Superconducting Magnetic Resonance Instrument Market Forecast (USD Billion), by Sub-Segment 2, 2018-2029
      Figure 19: North America Superconducting Magnetic Resonance Instrument Market Value Share (%), By Segment 2, 2022 & 2029
      Figure 20: North America Superconducting Magnetic Resonance Instrument Market Forecast (USD Billion), by Sub-Segment 1, 2018-2029
      Figure 21: North America Superconducting Magnetic Resonance Instrument Market Forecast (USD Billion), by Sub-Segment 2, 2018-2029
      Figure 22: North America Superconducting Magnetic Resonance Instrument Market Forecast (USD Billion), by Sub-Segment 3, 2018-2029
      Figure 23: North America Superconducting Magnetic Resonance Instrument Market Forecast (USD Billion), by Others, 2018-2029
      Figure 24: North America Superconducting Magnetic Resonance Instrument Market Value Share (%), By Segment 3, 2022 & 2029
      Figure 25: North America Superconducting Magnetic Resonance Instrument Market Forecast (USD Billion), by Sub-Segment 1, 2018-2029
      Figure 26: North America Superconducting Magnetic Resonance Instrument Market Forecast (USD Billion), by Sub-Segment 2, 2018-2029
      Figure 27: North America Superconducting Magnetic Resonance Instrument Market Forecast (USD Billion), by Sub-Segment 3, 2018-2029
      Figure 28: North America Superconducting Magnetic Resonance Instrument Market Forecast (USD Billion), by Others, 2018-2029
      Figure 29: North America Superconducting Magnetic Resonance Instrument Market Forecast (USD Billion), by U.S., 2018-2029
      Figure 30: North America Superconducting Magnetic Resonance Instrument Market Forecast (USD Billion), by Canada, 2018-2029
      Figure 31: Latin America Superconducting Magnetic Resonance Instrument Market Value Share (%), By Segment 1, 2022 & 2029
      Figure 32: Latin America Superconducting Magnetic Resonance Instrument Market Forecast (USD Billion), by Sub-Segment 1, 2018-2029
      Figure 33: Latin America Superconducting Magnetic Resonance Instrument Market Forecast (USD Billion), by Sub-Segment 2, 2018-2029
      Figure 34: Latin America Superconducting Magnetic Resonance Instrument Market Value Share (%), By Segment 2, 2022 & 2029
      Figure 35: Latin America Superconducting Magnetic Resonance Instrument Market Forecast (USD Billion), by Sub-Segment 1, 2018-2029
      Figure 36: Latin America Superconducting Magnetic Resonance Instrument Market Forecast (USD Billion), by Sub-Segment 2, 2018-2029
      Figure 37: Latin America Superconducting Magnetic Resonance Instrument Market Forecast (USD Billion), by Sub-Segment 3, 2018-2029
      Figure 38: Latin America Superconducting Magnetic Resonance Instrument Market Forecast (USD Billion), by Others, 2018-2029
      Figure 39: Latin America Superconducting Magnetic Resonance Instrument Market Value Share (%), By Segment 3, 2022 & 2029
      Figure 40: Latin America Superconducting Magnetic Resonance Instrument Market Forecast (USD Billion), by Sub-Segment 1, 2018-2029
      Figure 41: Latin America Superconducting Magnetic Resonance Instrument Market Forecast (USD Billion), by Sub-Segment 2, 2018-2029
      Figure 42: Latin America Superconducting Magnetic Resonance Instrument Market Forecast (USD Billion), by Sub-Segment 3, 2018-2029
      Figure 43: Latin America Superconducting Magnetic Resonance Instrument Market Forecast (USD Billion), by Others, 2018-2029
      Figure 44: Latin America Superconducting Magnetic Resonance Instrument Market Forecast (USD Billion), by Brazil, 2018-2029
      Figure 45: Latin America Superconducting Magnetic Resonance Instrument Market Forecast (USD Billion), by Mexico, 2018-2029
      Figure 46: Latin America Superconducting Magnetic Resonance Instrument Market Forecast (USD Billion), by Rest of Latin America, 2018-2029
      Figure 47: Europe Superconducting Magnetic Resonance Instrument Market Value Share (%), By Segment 1, 2022 & 2029
      Figure 48: Europe Superconducting Magnetic Resonance Instrument Market Forecast (USD Billion), by Sub-Segment 1, 2018-2029
      Figure 49: Europe Superconducting Magnetic Resonance Instrument Market Forecast (USD Billion), by Sub-Segment 2, 2018-2029
      Figure 50: Europe Superconducting Magnetic Resonance Instrument Market Value Share (%), By Segment 2, 2022 & 2029
      Figure 51: Europe Superconducting Magnetic Resonance Instrument Market Forecast (USD Billion), by Sub-Segment 1, 2018-2029
      Figure 52: Europe Superconducting Magnetic Resonance Instrument Market Forecast (USD Billion), by Sub-Segment 2, 2018-2029
      Figure 53: Europe Superconducting Magnetic Resonance Instrument Market Forecast (USD Billion), by Sub-Segment 3, 2018-2029
      Figure 54: Europe Superconducting Magnetic Resonance Instrument Market Forecast (USD Billion), by Others, 2018-2029
      Figure 55: Europe Superconducting Magnetic Resonance Instrument Market Value Share (%), By Segment 3, 2022 & 2029
      Figure 56: Europe Superconducting Magnetic Resonance Instrument Market Forecast (USD Billion), by Sub-Segment 1, 2018-2029
      Figure 57: Europe Superconducting Magnetic Resonance Instrument Market Forecast (USD Billion), by Sub-Segment 2, 2018-2029
      Figure 58: Europe Superconducting Magnetic Resonance Instrument Market Forecast (USD Billion), by Sub-Segment 3, 2018-2029
      Figure 59: Europe Superconducting Magnetic Resonance Instrument Market Forecast (USD Billion), by Others, 2018-2029
      Figure 60: Europe Superconducting Magnetic Resonance Instrument Market Forecast (USD Billion), by U.K., 2018-2029
      Figure 61: Europe Superconducting Magnetic Resonance Instrument Market Forecast (USD Billion), by Germany, 2018-2029
      Figure 62: Europe Superconducting Magnetic Resonance Instrument Market Forecast (USD Billion), by France, 2018-2029
      Figure 63: Europe Superconducting Magnetic Resonance Instrument Market Forecast (USD Billion), by Italy, 2018-2029
      Figure 64: Europe Superconducting Magnetic Resonance Instrument Market Forecast (USD Billion), by Spain, 2018-2029
      Figure 65: Europe Superconducting Magnetic Resonance Instrument Market Forecast (USD Billion), by Russia, 2018-2029
      Figure 66: Europe Superconducting Magnetic Resonance Instrument Market Forecast (USD Billion), by Rest of Europe, 2018-2029
      Figure 67: Asia Pacific Superconducting Magnetic Resonance Instrument Market Value Share (%), By Segment 1, 2022 & 2029
      Figure 68: Asia Pacific Superconducting Magnetic Resonance Instrument Market Forecast (USD Billion), by Sub-Segment 1, 2018-2029
      Figure 69: Asia Pacific Superconducting Magnetic Resonance Instrument Market Forecast (USD Billion), by Sub-Segment 2, 2018-2029
      Figure 70: Asia Pacific Superconducting Magnetic Resonance Instrument Market Value Share (%), By Segment 2, 2022 & 2029
      Figure 71: Asia Pacific Superconducting Magnetic Resonance Instrument Market Forecast (USD Billion), by Sub-Segment 1, 2018-2029
      Figure 72: Asia Pacific Superconducting Magnetic Resonance Instrument Market Forecast (USD Billion), by Sub-Segment 2, 2018-2029
      Figure 73: Asia Pacific Superconducting Magnetic Resonance Instrument Market Forecast (USD Billion), by Sub-Segment 3, 2018-2029
      Figure 74: Asia Pacific Superconducting Magnetic Resonance Instrument Market Forecast (USD Billion), by Others, 2018-2029
      Figure 75: Asia Pacific Superconducting Magnetic Resonance Instrument Market Value Share (%), By Segment 3, 2022 & 2029
      Figure 76: Asia Pacific Superconducting Magnetic Resonance Instrument Market Forecast (USD Billion), by Sub-Segment 1, 2018-2029
      Figure 77: Asia Pacific Superconducting Magnetic Resonance Instrument Market Forecast (USD Billion), by Sub-Segment 2, 2018-2029
      Figure 78: Asia Pacific Superconducting Magnetic Resonance Instrument Market Forecast (USD Billion), by Sub-Segment 3, 2018-2029
      Figure 79: Asia Pacific Superconducting Magnetic Resonance Instrument Market Forecast (USD Billion), by Others, 2018-2029
      Figure 80: Asia Pacific Superconducting Magnetic Resonance Instrument Market Forecast (USD Billion), by China, 2018-2029
      Figure 81: Asia Pacific Superconducting Magnetic Resonance Instrument Market Forecast (USD Billion), by India, 2018-2029
      Figure 82: Asia Pacific Superconducting Magnetic Resonance Instrument Market Forecast (USD Billion), by Japan, 2018-2029
      Figure 83: Asia Pacific Superconducting Magnetic Resonance Instrument Market Forecast (USD Billion), by Australia, 2018-2029
      Figure 84: Asia Pacific Superconducting Magnetic Resonance Instrument Market Forecast (USD Billion), by Southeast Asia, 2018-2029
      Figure 85: Asia Pacific Superconducting Magnetic Resonance Instrument Market Forecast (USD Billion), by Rest of Asia Pacific, 2018-2029
      Figure 86: Middle East & Africa Superconducting Magnetic Resonance Instrument Market Value Share (%), By Segment 1, 2022 & 2029
      Figure 87: Middle East & Africa Superconducting Magnetic Resonance Instrument Market Forecast (USD Billion), by Sub-Segment 1, 2018-2029
      Figure 88: Middle East & Africa Superconducting Magnetic Resonance Instrument Market Forecast (USD Billion), by Sub-Segment 2, 2018-2029
      Figure 89: Middle East & Africa Superconducting Magnetic Resonance Instrument Market Value Share (%), By Segment 2, 2022 & 2029
      Figure 90: Middle East & Africa Superconducting Magnetic Resonance Instrument Market Forecast (USD Billion), by Sub-Segment 1, 2018-2029
      Figure 91: Middle East & Africa Superconducting Magnetic Resonance Instrument Market Forecast (USD Billion), by Sub-Segment 2, 2018-2029
      Figure 92: Middle East & Africa Superconducting Magnetic Resonance Instrument Market Forecast (USD Billion), by Sub-Segment 3, 2018-2029
      Figure 93: Middle East & Africa Superconducting Magnetic Resonance Instrument Market Forecast (USD Billion), by Others, 2018-2029
      Figure 94: Middle East & Africa Superconducting Magnetic Resonance Instrument Market Value Share (%), By Segment 3, 2022 & 2029
      Figure 95: Middle East & Africa Superconducting Magnetic Resonance Instrument Market Forecast (USD Billion), by Sub-Segment 1, 2018-2029
      Figure 96: Middle East & Africa Superconducting Magnetic Resonance Instrument Market Forecast (USD Billion), by Sub-Segment 2, 2018-2029
      Figure 97: Middle East & Africa Superconducting Magnetic Resonance Instrument Market Forecast (USD Billion), by Sub-Segment 3, 2018-2029
      Figure 98: Middle East & Africa Superconducting Magnetic Resonance Instrument Market Forecast (USD Billion), by Others, 2018-2029
      Figure 99: Middle East & Africa Superconducting Magnetic Resonance Instrument Market Forecast (USD Billion), by GCC, 2018-2029
      Figure 100: Middle East & Africa Superconducting Magnetic Resonance Instrument Market Forecast (USD Billion), by South Africa, 2018-2029
      Figure 101: Middle East & Africa Superconducting Magnetic Resonance Instrument Market Forecast (USD Billion), by Rest of Middle East & Africa, 2018-2029 
      List of Tables
      Table 1: Global Superconducting Magnetic Resonance Instrument Market Revenue (USD Billion) Forecast, by Segment 1, 2018-2029
      Table 2: Global Superconducting Magnetic Resonance Instrument Market Revenue (USD Billion) Forecast, by Segment 2, 2018-2029
      Table 3: Global Superconducting Magnetic Resonance Instrument Market Revenue (USD Billion) Forecast, by Segment 3, 2018-2029
      Table 4: Global Superconducting Magnetic Resonance Instrument Market Revenue (USD Billion) Forecast, by Region, 2018-2029
      Table 5: North America Superconducting Magnetic Resonance Instrument Market Revenue (USD Billion) Forecast, by Segment 1, 2018-2029
      Table 6: North America Superconducting Magnetic Resonance Instrument Market Revenue (USD Billion) Forecast, by Segment 2, 2018-2029
      Table 7: North America Superconducting Magnetic Resonance Instrument Market Revenue (USD Billion) Forecast, by Segment 3, 2018-2029
      Table 8: North America Superconducting Magnetic Resonance Instrument Market Revenue (USD Billion) Forecast, by Country, 2018-2029
      Table 9: Europe Superconducting Magnetic Resonance Instrument Market Revenue (USD Billion) Forecast, by Segment 1, 2018-2029
      Table 10: Europe Superconducting Magnetic Resonance Instrument Market Revenue (USD Billion) Forecast, by Segment 2, 2018-2029
      Table 11: Europe Superconducting Magnetic Resonance Instrument Market Revenue (USD Billion) Forecast, by Segment 3, 2018-2029
      Table 12: Europe Superconducting Magnetic Resonance Instrument Market Revenue (USD Billion) Forecast, by Country, 2018-2029
      Table 13: Latin America Superconducting Magnetic Resonance Instrument Market Revenue (USD Billion) Forecast, by Segment 1, 2018-2029
      Table 14: Latin America Superconducting Magnetic Resonance Instrument Market Revenue (USD Billion) Forecast, by Segment 2, 2018-2029
      Table 15: Latin America Superconducting Magnetic Resonance Instrument Market Revenue (USD Billion) Forecast, by Segment 3, 2018-2029
      Table 16: Latin America Superconducting Magnetic Resonance Instrument Market Revenue (USD Billion) Forecast, by Country, 2018-2029
      Table 17: Asia Pacific Superconducting Magnetic Resonance Instrument Market Revenue (USD Billion) Forecast, by Segment 1, 2018-2029
      Table 18: Asia Pacific Superconducting Magnetic Resonance Instrument Market Revenue (USD Billion) Forecast, by Segment 2, 2018-2029
      Table 19: Asia Pacific Superconducting Magnetic Resonance Instrument Market Revenue (USD Billion) Forecast, by Segment 3, 2018-2029
      Table 20: Asia Pacific Superconducting Magnetic Resonance Instrument Market Revenue (USD Billion) Forecast, by Country, 2018-2029
      Table 21: Middle East & Africa Superconducting Magnetic Resonance Instrument Market Revenue (USD Billion) Forecast, by Segment 1, 2018-2029
      Table 22: Middle East & Africa Superconducting Magnetic Resonance Instrument Market Revenue (USD Billion) Forecast, by Segment 2, 2018-2029
      Table 23: Middle East & Africa Superconducting Magnetic Resonance Instrument Market Revenue (USD Billion) Forecast, by Segment 3, 2018-2029
      Table 24: Middle East & Africa Superconducting Magnetic Resonance Instrument Market Revenue (USD Billion) Forecast, by Country, 2018-2029
      Research Process

      Data Library Research are conducted by industry experts who offer insight on industry structure, market segmentations technology assessment and competitive landscape (CL), and penetration, as well as on emerging trends. Their analysis is based on primary interviews (~ 80%) and secondary research (~ 20%) as well as years of professional expertise in their respective industries. Adding to this, by analysing historical trends and current market positions, our analysts predict where the market will be headed for the next five years. Furthermore, the varying trends of segment & categories geographically presented are also studied and the estimated based on the primary & secondary research.

      In this particular report from the supply side Data Library Research has conducted primary surveys (interviews) with the key level executives (VP, CEO’s, Marketing Director, Business Development Manager and SOFT) of the companies that active & prominent as well as the midsized organization

      FIGURE 1: DLR RESEARH PROCESS

      research-methodology1

      Primary Research

      Extensive primary research was conducted to gain a deeper insight of the market and industry performance. The analysis is based on both primary and secondary research as well as years of professional expertise in the respective industries.

      In addition to analysing current and historical trends, our analysts predict where the market is headed over the next five years.

      It varies by segment for these categories geographically presented in the list of market tables. Speaking about this particular report we have conducted primary surveys (interviews) with the key level executives (VP, CEO’s, Marketing Director, Business Development Manager and many more) of the major players active in the market.

      Secondary Research

      Secondary research was mainly used to collect and identify information useful for the extensive, technical, market-oriented, and Friend’s study of the Global Extra Neutral Alcohol. It was also used to obtain key information about major players, market classification and segmentation according to the industry trends, geographical markets, and developments related to the market and technology perspectives. For this study, analysts have gathered information from various credible sources, such as annual reports, sec filings, journals, white papers, SOFT presentations, and company web sites.

      Market Size Estimation

      Both, top-down and bottom-up approaches were used to estimate and validate the size of the Global market and to estimate the size of various other dependent submarkets in the overall Extra Neutral Alcohol. The key players in the market were identified through secondary research and their market contributions in the respective geographies were determined through primary and secondary research.

      Forecast Model

      research-methodology2