Get Complete Analysis Of The Report - Download Updated Free Sample PDF
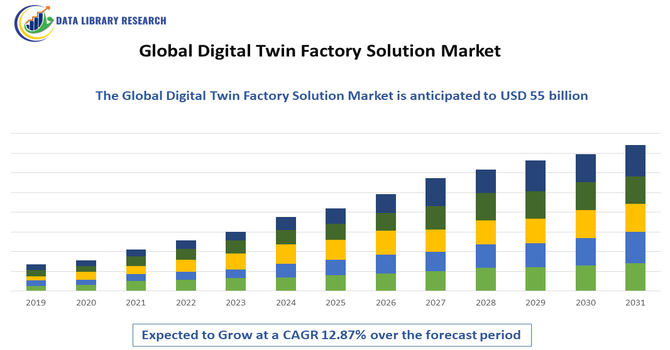
The Global Digital Twin Factory Solution Market is experiencing robust growth, primarily driven by the accelerating adoption of Industry 4.0, rising demand for smart manufacturing, and the growing need for real-time operational visibility and process optimization across industrial environments. Manufacturers are increasingly implementing digital twin factory solutions to simulate production workflows, reduce downtime, streamline maintenance, and improve product quality through predictive analytics and closed-loop feedback systems. The push toward automation, mass customization, and data-driven decision-making, coupled with the integration of IoT, AI, cloud computing, and advanced simulation technologies, is further strengthening market demand.
The Global Digital Twin Factory Solution Market is witnessing several emerging trends that are reshaping modern manufacturing ecosystems. One of the most notable trends is the rapid integration of AI-driven predictive analytics and machine learning models into digital twins, enabling factories to forecast equipment failures, optimize asset performance, and simulate production outcomes with higher accuracy. Another key trend is the growing adoption of cloud-based and hybrid deployment models, making digital twin infrastructure more scalable and accessible to mid-sized manufacturers while enabling remote monitoring and collaboration across global factory networks.
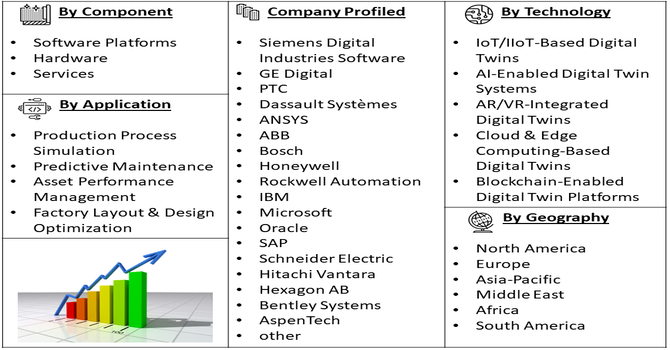
Segmentation: Global Digital Twin Factory Solution Market is segmented By Component (Software Platforms, Hardware, Services), Technology (IoT/IIoT-Based Digital Twins, AI-Enabled Digital Twin Systems, AR/VR-Integrated Digital Twins, Cloud & Edge Computing-Based Digital Twins, Blockchain-Enabled Digital Twin Platforms), Application (Production Process Simulation, Predictive Maintenance, Asset Performance Management, Factory Layout & Design Optimization), End-User Industry (Automotive & Transportation, Aerospace & Defense, Electronics & Semiconductor Manufacturing, Pharmaceuticals & Biotechnology), and Geography (North America, Europe, Asia-Pacific, Middle East and Africa, and South America). The report provides the value (in USD million) for the above segments.
For Detailed Market Segmentation - Get a Free Sample PDF
Market Drivers:
One of the major drivers accelerating the growth of the Global Digital Twin Factory Solution Market is the widespread adoption of Industry 4.0 and smart factory initiatives. As industries shift toward automation, real-time monitoring, and interconnected production systems, digital twins have become central to achieving operational intelligence.
Manufacturers are increasingly deploying digital twin solutions to simulate factory workflows, optimize production lines, and identify inefficiencies before real-world implementation. For instance, in April 2025, Critical Manufacturing partnered with Twinzo to integrate Twinzo’s real-time 3D digital twin platform with Critical Manufacturing’s MES, enabling live visualization of manufacturing operations in an intuitive, mobile 3D environment.
Another significant market driver is the increasing emphasis on improving asset reliability and operational efficiency through predictive maintenance. Traditional reactive and scheduled maintenance systems result in unnecessary downtime and high operational costs in industrial environments.
Digital twin solutions enable real-time monitoring of equipment performance by integrating sensor data, machine analytics, and AI-based prediction models to identify potential failures before they occur. For instance, in September 2025, BlueScope, saved approximately 2,000 hours of unplanned downtime across three years by using Siemens’ Senseye predictive maintenance technology. The platform prevented equipment failures, reduced production delays, and minimized waste across facilities in Australia, New Zealand, and Southeast Asia. This shift from reactive to predictive maintenance enhanced operational efficiency and positively impacted the above market by promoting proactive maintenance, optimizing tool life, reducing costs, and improving productivity in industrial cutting operations.
Market Restraints:
The growth of the Global Digital Twin Factory Solution Market is challenged by several restraints, with the most significant being the high implementation and integration cost, which often limits adoption, especially among small and medium-sized manufacturers. Establishing digital twin ecosystems requires investment in IoT devices, high-performance computing, advanced analytics platforms, and compatible manufacturing execution systems—making it financially burdensome for organizations with limited technological budgets. Additionally, complexity in system integration and lack of standardization creates compatibility issues when connecting legacy machines with modern digital twin platforms, slowing large-scale industrial deployment.
The global digital twin factory solution market has a significant socioeconomic impact by transforming manufacturing and industrial operations through virtual modeling of production systems. By simulating factory processes, companies can optimize production efficiency, reduce downtime, lower operational costs, and improve product quality, which enhances competitiveness and profitability. This market also fosters job creation in high-tech fields such as software development, data analytics, and systems engineering, while supporting workforce upskilling. Additionally, digital twin solutions contribute to sustainable manufacturing by minimizing waste and energy consumption, driving innovation, and enabling smarter resource management, ultimately promoting economic growth and technological advancement worldwide.
Segmental Analysis:
The Software Platforms segment within the Component category currently represents the most dominant and rapidly expanding area in the Global Digital Twin Factory Solution Market. This growth is primarily driven by the increasing need for centralized platforms that integrate simulation tools, IoT connectivity, real-time data analytics, and visualization modules, enabling manufacturers to replicate, monitor, and optimize factory operations digitally. Software-based digital twin ecosystems are becoming the backbone for smart factories, supporting seamless communication between physical assets and their virtual counterparts.
The IoT/IIoT-Based Digital Twins segment stands out as a key growth driver due to the widespread deployment of connected devices and industrial automation systems across manufacturing facilities. The ability to collect real-time machine data, monitor equipment health, and streamline decision-making through integrated IIoT sensors and cloud-based infrastructures is propelling demand for IoT-enabled digital twin frameworks. As more factories adopt connected machinery and industrial automation solutions, the role of IoT-based digital twins continues to expand significantly.
Predictive Maintenance is emerging as the most influential segment, fueled by the growing need to reduce downtime, optimize asset longevity, and improve cost efficiency in operational workflows. Digital twins provide advanced simulation and behavioral modeling to predict equipment failures in advance, enabling maintenance teams to shift from reactive approaches to proactive and strategic maintenance. This reduces operational disruptions and enhances production continuity, making this category especially appealing to industries running continuous or high-volume processes.
The Automotive & Transportation segment holds a leading position due to the rapid digitalization of vehicle manufacturing processes, increasing electric vehicle (EV) production, and the need for precision-driven assembly line optimization. Digital twin factory solutions are playing a crucial role in designing flexible manufacturing systems, monitoring robot-driven operations, and improving supply chain transparency, helping automotive OEMs and Tier-1 suppliers enhance both productivity and adaptability.
The North America region is expected to witness the highest growth over the forecast period in the Global Digital Twin Factory Solution Market, driven by the rapid adoption of Industry 4.0 transformation initiatives, strong investment in automation, and widespread integration of AI, IoT, and cloud-based manufacturing systems.
The presence of major technology innovators, advanced manufacturing clusters, and supportive government policies promoting smart factory digitization are further accelerating adoption across industries such as automotive, aerospace, electronics, and pharmaceuticals. For instance, in 2024, Schneider Electric and ETAP unveiled an advanced digital twin to design and simulate the power requirements of AI factories using NVIDIA Omniverse Blueprint. The solution integrated mechanical, thermal, networking, and electrical inputs to provide comprehensive operational insights. This collaboration enhanced predictive maintenance capabilities and operational efficiency, positively impacting the global digital twin factory solution market by enabling optimized energy management, improved reliability, and sustainable operations in complex, high-demand manufacturing environments.
Additionally, the region’s well-established digital infrastructure, growing use of predictive maintenance, and increasing demand for real-time production intelligence are contributing to significant momentum, positioning North America as a leading hub for digital twin deployment in factory environments.
| Report Matrics | Details |
| Market Size Value | USD 55 billion |
| Growth Rate | CAGR of 12.87 % |
| Forecast | 2026-2033 |
| Historical data | 2021-2024 |
| Base Year | 2025 |
| Report Coverage | Forecasted revenue, company rating, competitive environment, growth drivers, and trends |
| Segment Coverage | Type, Application, End-User, Geography |
| Regional Scope | North America, Europe, Asia Pacific, Middle East |
| Customized scope | Free customization of reports (With 3 months' analysis support) |
| To Learn More About This Report | Request a Free Sample Copy |
The competitive landscape of the Global Digital Twin Factory Solution Market is highly dynamic and technology-driven, featuring major industrial automation vendors, software platform providers, and niche simulation specialists competing on software integration, real-time analytics, IoT connectivity, and industry-specific solutions. Key differentiators include scalability, cloud/edge deployment options, AI/ML capabilities, and strong system-integration/service ecosystems.
Key Players:
Recent Development
Q1. What are the main growth-driving factors for this market?
The primary growth factor is the global push toward Industry 4.0 and smart manufacturing. Companies are investing heavily to increase operational efficiency, reduce costly downtime, and optimize complex processes. Digital twins enable predictive maintenance by creating virtual replicas of machinery, allowing factory managers to simulate operations and detect potential equipment failures before they occur in the real world.
Q2. What are the main restraining factors for this market?
The largest barrier is the high upfront cost and complexity of implementing these systems, which includes hardware like sensors and software platforms. Small and medium-sized enterprises (SMEs) often struggle with this initial investment. Additionally, the industry faces a significant shortage of experts skilled in integrating advanced technologies like IoT, AI, and complex simulation modeling into existing factory operations.
Q3. Which segment is expected to witness high growth?
The Predictive Maintenance application segment is expected to see the fastest growth. Factories use digital twins in this area to constantly monitor assets and anticipate maintenance needs. This capability minimizes unplanned stoppages, maximizes the life of expensive machinery, and delivers immediate cost savings, making it a highly valued and rapidly adopted solution across manufacturing sectors.
Q4. Who are the top major players for this market?
The market is dominated by major industrial and software giants that provide comprehensive platforms for manufacturing digitalization. Key players include Siemens, known for its extensive factory automation suite, GE Digital, Microsoft Corporation, IBM, and Dassault Systèmes. These companies offer robust solutions for modeling, simulation, and data analytics to support complex factory environments.
Q5. Which country is the largest player?
The United States, situated within the North America region, is currently the largest and most established market for Digital Twin Factory Solutions by current revenue. This leadership is due to its mature industrial infrastructure, its strong focus on technological innovation, and early, widespread adoption of advanced manufacturing practices across high-value sectors like aerospace and automotive.
Data Library Research are conducted by industry experts who offer insight on industry structure, market segmentations technology assessment and competitive landscape (CL), and penetration, as well as on emerging trends. Their analysis is based on primary interviews (~ 80%) and secondary research (~ 20%) as well as years of professional expertise in their respective industries. Adding to this, by analysing historical trends and current market positions, our analysts predict where the market will be headed for the next five years. Furthermore, the varying trends of segment & categories geographically presented are also studied and the estimated based on the primary & secondary research.
In this particular report from the supply side Data Library Research has conducted primary surveys (interviews) with the key level executives (VP, CEO’s, Marketing Director, Business Development Manager and SOFT) of the companies that active & prominent as well as the midsized organization
FIGURE 1: DLR RESEARH PROCESS
Extensive primary research was conducted to gain a deeper insight of the market and industry performance. The analysis is based on both primary and secondary research as well as years of professional expertise in the respective industries.
In addition to analysing current and historical trends, our analysts predict where the market is headed over the next five years.
It varies by segment for these categories geographically presented in the list of market tables. Speaking about this particular report we have conducted primary surveys (interviews) with the key level executives (VP, CEO’s, Marketing Director, Business Development Manager and many more) of the major players active in the market.
Secondary ResearchSecondary research was mainly used to collect and identify information useful for the extensive, technical, market-oriented, and Friend’s study of the Global Extra Neutral Alcohol. It was also used to obtain key information about major players, market classification and segmentation according to the industry trends, geographical markets, and developments related to the market and technology perspectives. For this study, analysts have gathered information from various credible sources, such as annual reports, sec filings, journals, white papers, SOFT presentations, and company web sites.
Market Size EstimationBoth, top-down and bottom-up approaches were used to estimate and validate the size of the Global market and to estimate the size of various other dependent submarkets in the overall Extra Neutral Alcohol. The key players in the market were identified through secondary research and their market contributions in the respective geographies were determined through primary and secondary research.
Forecast Model