Grid-scale Lithium-ion Battery Market Overview and Analysis:
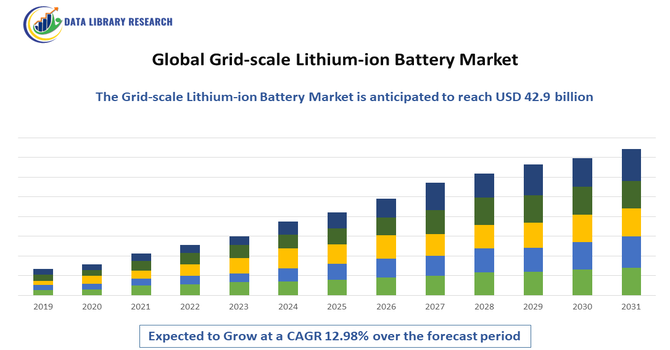
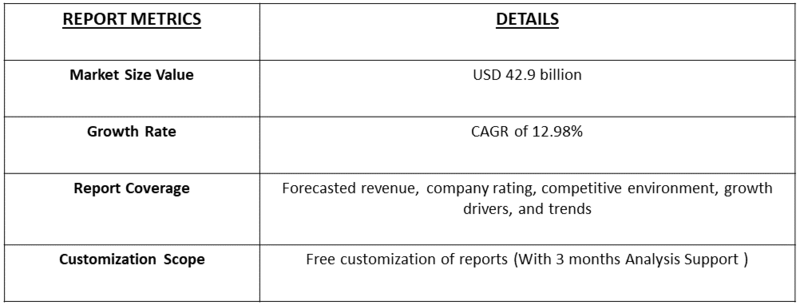
- The global grid-scale lithium-ion battery market is undergoing explosive growth, projected to rise from approximately USD 11.7 billion in 2025 to around USD 42.9 billion by 2032, growing with a CAGR of 12.98% from 2025 to 2032.
Get Complete Analysis Of The Report - Download Updated Free Sample PDF
The Global Grid-Scale Lithium-ion Battery Market growth is driven by the accelerating global transition toward renewable energy integration, rising demand for large-scale energy storage solutions, and growing emphasis on grid stability and resilience. As solar and wind energy generation expands, the need for reliable storage systems to manage intermittent power supply and balance grid demand has become critical. Lithium-ion batteries are increasingly favored for grid-scale applications due to their high energy density, long cycle life, and rapid response capabilities compared to traditional energy storage technologies.
Grid-scale Lithium-ion Battery Market Latest Trends:
The Global Grid-Scale Lithium-Ion Battery market is currently being shaped by several key trends: one major trend is the rapid cost reduction and material-chemistry optimization, where costs for lithium-ion systems continue to fall and lithium-iron-phosphate (LFP) chemistry has gained dominant market share due to its safety, cycle life and lower cost. Another trend is the increasing integration of grid-scale storage with renewable energy systems and ancillary services, enabling utilities to manage intermittency, provide frequency regulation, and support peak-shaving and time-shifting operations.
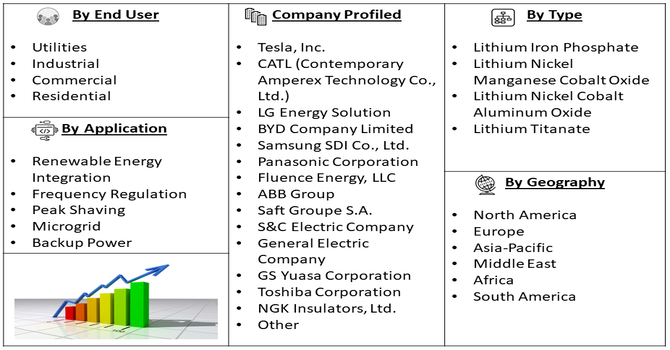
Segmentation: Global Grid-scale Lithium-ion Battery Market is segmented by Battery Type (Lithium Iron Phosphate, Lithium Nickel Manganese Cobalt Oxide, Lithium Nickel Cobalt Aluminum Oxide, and Lithium Titanate), Application (Renewable Energy Integration, Frequency Regulation, Peak Shaving, Microgrid, Backup Power), End User (Utilities, Industrial & Commercial, and Residential), and Geography (North America, Europe, Asia-Pacific, Middle East and Africa, and South America). The report provides the value (in USD million) for the above segments.
For Detailed Market Segmentation - Get a Free Sample PDF
Market Drivers:
- Growing Adoption of Renewable Energy and Grid Modernization
A primary driver of the Global Grid-Scale Lithium-ion Battery Market is the increasing penetration of renewable energy sources, such as solar and wind, into power grids worldwide. Renewable energy generation is inherently intermittent and variable, creating challenges for grid stability and reliability. For instance, in 2025, Indian Ministry of Renewable Energy reported, India’s renewable energy sector has entered a pivotal phase, shifting focus from rapid capacity expansion to building a stable, resilient, and efficient clean energy system. After a decade of record growth, efforts now prioritize creating a robust grid capable of integrating variable renewable sources, supporting the nation’s 500 GW non-fossil target by 2030. This evolution toward stronger, more reliable infrastructure is driving the growing adoption of renewable energy, accelerating grid modernization efforts, and boosting demand for grid-scale lithium-ion batteries to provide storage, flexibility, and stability in India and globally.
- Declining Battery Costs and Technological Advancements
Another significant market driver is the continuous decline in lithium-ion battery costs and rapid advancements in battery technology. Economies of scale in battery manufacturing, improvements in electrode materials, and optimized cell chemistries—such as Lithium Iron Phosphate (LFP) and Nickel Manganese Cobalt (NMC)—have lowered the overall cost per kilowatt-hour, making grid-scale deployments economically viable. Technological enhancements, including longer cycle life, faster charge/discharge capabilities, and higher energy density, further increase the attractiveness of lithium-ion batteries for large-scale storage projects. These improvements allow utilities and commercial end-users to achieve a higher return on investment, improve system reliability, and support long-term sustainability goals, thereby propelling the market forward.
Market Restraints:
- High Initial Capital Investment
One of the key challenges is the high initial capital investment required for large-scale lithium-ion battery installations, including costs for battery packs, inverters, control systems, and integration with existing grid infrastructure. This high upfront expenditure can be a barrier, particularly for utilities and industrial users in developing regions.
Moreover, the high upfront costs often make financing and project approval challenging, slowing down adoption rates. Smaller utilities and industrial users may struggle to justify the investment despite long-term savings from energy efficiency and peak-shaving benefits. In developing regions, limited access to credit and government incentives further exacerbates the issue, delaying large-scale deployment. This financial barrier restricts market growth and encourages reliance on traditional, less expensive energy storage alternatives, limiting the pace at which lithium-ion battery installations can expand globally.
Socio Economic Impact on Grid-scale Lithium-ion Battery Market
The burgeoning grid-scale lithium-ion battery market acts as a powerful catalyst for socioeconomic change, most notably through significant job creation across the manufacturing, engineering, and installation sectors, fostering a skilled "green economy" workforce. Economically, these systems dramatically improve grid resilience and efficiency, helping utilities better manage supply fluctuations from renewables, which ultimately stabilizes and potentially lowers long-term electricity costs for both consumers and industries. Socially, the batteries enable greater energy independence by reducing reliance on imported fossil fuels, and critically, they improve energy access and reliability in remote or underserved areas, which supports local economic development and ensures essential services are maintained during major grid outages or natural disasters.
Segmental Analysis:
- Lithium Iron Phosphate segment is expected to witness highest growth over the forecast period
The Lithium Iron Phosphate (LFP) segment is expected to dominate the market over the forecast period due to its superior safety profile, longer cycle life, and cost-effectiveness for large-scale energy storage. LFP batteries are increasingly preferred for grid-scale applications as they provide reliable performance for renewable energy integration, frequency regulation, and backup power, while reducing fire risks compared to other lithium-ion chemistries.
- Renewable Energy Integration segment is expected to witness highest growth over the forecast period
The Renewable Energy Integration segment holds the largest share, driven by the growing deployment of solar and wind energy projects worldwide. Lithium-ion batteries are crucial for storing excess energy generated during peak production periods and supplying power during low generation, ensuring grid stability and uninterrupted electricity supply. This application is particularly critical as countries transition toward cleaner energy and reduce dependence on fossil fuels.
- Utilities segment is expected to witness highest growth over the forecast period
The Utilities segment leads the market due to the need for large-scale storage solutions to manage grid demand, provide ancillary services, and integrate distributed energy resources. Utilities deploy grid-scale lithium-ion batteries to enhance grid reliability, perform peak shaving, and support microgrid operations, benefiting from long-term cost savings and improved operational efficiency.
- Asia-Pacific region is expected to witness highest growth over the forecast period
The Asia-Pacific (APAC) region is projected to register the highest growth in the global grid-scale lithium-ion battery market, fueled by unprecedented energy demand and aggressive renewable energy integration goals. Rapid industrialization and electrification across key economies like China, India, Japan, and Australia necessitate stable, reliable power.
China, in particular, drives this momentum with state-backed mandates and massive solar and wind installations that require significant storage capacity for grid balancing. For instance, in November 2024, Stellantis N.V. and Zeta Energy Corp. announced a joint development agreement to advance lithium-sulfur battery technology for electric vehicles. The collaboration aimed to create lighter battery packs with the same usable energy as current lithium-ion batteries, offering longer range, better handling, and enhanced performance. The technology also promised up to 50% faster charging and was projected to cost less than half per kWh compared to traditional lithium-ion batteries, potentially transforming EV efficiency and affordability.
Furthermore, APAC holds a crucial strategic advantage: it is home to the world’s largest battery manufacturers, including CATL and LG Energy Solution. This localized supply chain dominance results in lower procurement costs and faster project deployment, cementing the region's position as the primary engine for market expansion over the forecast period.
To Learn More About This Report - Request a Free Sample Copy
Grid-scale Lithium-ion Battery Market Competitive Landscape:
The competitive landscape of the Global Grid Scale Lithium Ion Battery market is robust and rapidly evolving, featuring a mix of large battery manufacturers, energy system integrators, and specialist storage solution providers. Key competitive factors include manufacturing scale, battery chemistry innovation, turnkey system integration, supply chain control, and global deployment capabilities. According to industry sources, companies are actively engaging in contracts, expansions, partnerships and product launches to capture the growing demand for large scale energy storage.
Key Players:
- Tesla, Inc.
- CATL (Contemporary Amperex Technology Co., Ltd.)
- LG Energy Solution
- BYD Company Limited
- Samsung SDI Co., Ltd.
- Panasonic Corporation
- Fluence Energy, LLC
- ABB Group
- Saft Groupe S.A.
- S&C Electric Company
- General Electric Company
- GS Yuasa Corporation
- Toshiba Corporation
- NGK Insulators, Ltd.
- Northvolt AB
- Microvast Holdings, Inc.
- Envision AESC
- Leclanché S.A.
- SK Innovation Co., Ltd.
- EVE Energy Co., Ltd.
Recent Development
- In July 2025, Panasonic Energy began mass production at its new automotive lithium-ion battery facility in Kansas, targeting an annual capacity of 32 GWh. This expansion strengthens local U.S. production, supporting faster deployment of large-scale energy storage systems. The increased battery supply enhances grid modernization efforts by enabling more reliable integration of renewable energy sources, improving energy security, and supporting peak-load management. Globally, such large-scale manufacturing boosts the grid-scale lithium-ion battery market, driving down costs and accelerating adoption of energy storage solutions worldwide.
- In March 2025, Renesas Electronics launched its R-BMS F (Ready Battery Management System with Fixed Firmware), offering all-in-one solutions for managing lithium-ion battery packs in devices like e-bikes, robotics, and drones. By providing pre-validated firmware and integrated components, the system simplifies and accelerates the development of safe, efficient battery management systems. This innovation supports grid modernization by enabling reliable energy storage integration and efficient battery utilization. Globally, it strengthens the grid-scale lithium-ion battery market by promoting faster deployment, improved performance, and reduced development barriers for large-scale energy storage solutions.
Frequently Asked Questions (FAQ) :
Q1. What are the main growth-driving factors for this market?
The primary driver is the explosive growth of intermittent renewable energy sources like solar and wind power, which require storage to ensure stable electricity grids. Governments worldwide are enacting favorable energy storage mandates and incentives. Furthermore, the decreasing manufacturing cost of lithium-ion batteries, driven by the electric vehicle (EV) sector's mass production scale, makes grid-scale deployment financially viable for utilities.
Q2. What are the main restraining factors for this market?
A key constraint is the high initial capital expenditure required for large-scale battery projects, despite falling unit costs. Concerns over safety and thermal runaway (fire risk) require expensive, complex containment systems. Finally, the market faces increasing supply chain pressure and price volatility due to limited global reserves of raw materials like lithium, cobalt, and nickel, which can slow down large deployments.
Q3. Which segment is expected to witness high growth?
The Utility-Scale Storage Segment is projected to witness the highest growth. This involves massive battery farms owned by power generators and utilities, used for peak shaving, frequency regulation, and integrating renewable energy. As governments enforce stricter grid reliability rules and commit to carbon reduction targets, the demand for large, multi-megawatt storage projects that serve millions of homes will surge, driving segment leadership.
Q4. Who are the top major players for this market?
The market is dominated by Asian battery manufacturers and global energy integrators. Top major players include CATL, LG Energy Solution, Samsung SDI, and Tesla. These companies control the supply chain and manufacturing capacity. Competition centers on offering better energy density, longer cycle life, and enhanced safety features, often through bundled solutions that combine battery hardware with specialized power conversion and management software.
Q5. Which country is the largest player?
China is the largest country player, both in manufacturing capacity and domestic deployment. China benefits from a powerful government-backed industrial strategy that dominates raw material processing and battery production globally. Furthermore, China is aggressively deploying grid-scale projects to meet its vast energy demand and carbon neutrality goals, establishing it as the global leader in both supply and installation volume.
List of Figures
Figure 1: Global Grid-scale Lithium-ion Battery Market Revenue Breakdown (USD Billion, %) by Region, 2022 & 2029
Figure 2: Global Grid-scale Lithium-ion Battery Market Value Share (%), By Segment 1, 2022 & 2029
Figure 3: Global Grid-scale Lithium-ion Battery Market Forecast (USD Billion), by Sub-Segment 1, 2018-2029
Figure 4: Global Grid-scale Lithium-ion Battery Market Forecast (USD Billion), by Sub-Segment 2, 2018-2029
Figure 5: Global Grid-scale Lithium-ion Battery Market Value Share (%), By Segment 2, 2022 & 2029
Figure 6: Global Grid-scale Lithium-ion Battery Market Forecast (USD Billion), by Sub-Segment 1, 2018-2029
Figure 7: Global Grid-scale Lithium-ion Battery Market Forecast (USD Billion), by Sub-Segment 2, 2018-2029
Figure 8: Global Grid-scale Lithium-ion Battery Market Forecast (USD Billion), by Sub-Segment 3, 2018-2029
Figure 9: Global Grid-scale Lithium-ion Battery Market Forecast (USD Billion), by Others, 2018-2029
Figure 10: Global Grid-scale Lithium-ion Battery Market Value Share (%), By Segment 3, 2022 & 2029
Figure 11: Global Grid-scale Lithium-ion Battery Market Forecast (USD Billion), by Sub-Segment 1, 2018-2029
Figure 12: Global Grid-scale Lithium-ion Battery Market Forecast (USD Billion), by Sub-Segment 2, 2018-2029
Figure 13: Global Grid-scale Lithium-ion Battery Market Forecast (USD Billion), by Sub-Segment 3, 2018-2029
Figure 14: Global Grid-scale Lithium-ion Battery Market Forecast (USD Billion), by Others, 2018-2029
Figure 15: Global Grid-scale Lithium-ion Battery Market Value (USD Billion), by Region, 2022 & 2029
Figure 16: North America Grid-scale Lithium-ion Battery Market Value Share (%), By Segment 1, 2022 & 2029
Figure 17: North America Grid-scale Lithium-ion Battery Market Forecast (USD Billion), by Sub-Segment 1, 2018-2029
Figure 18: North America Grid-scale Lithium-ion Battery Market Forecast (USD Billion), by Sub-Segment 2, 2018-2029
Figure 19: North America Grid-scale Lithium-ion Battery Market Value Share (%), By Segment 2, 2022 & 2029
Figure 20: North America Grid-scale Lithium-ion Battery Market Forecast (USD Billion), by Sub-Segment 1, 2018-2029
Figure 21: North America Grid-scale Lithium-ion Battery Market Forecast (USD Billion), by Sub-Segment 2, 2018-2029
Figure 22: North America Grid-scale Lithium-ion Battery Market Forecast (USD Billion), by Sub-Segment 3, 2018-2029
Figure 23: North America Grid-scale Lithium-ion Battery Market Forecast (USD Billion), by Others, 2018-2029
Figure 24: North America Grid-scale Lithium-ion Battery Market Value Share (%), By Segment 3, 2022 & 2029
Figure 25: North America Grid-scale Lithium-ion Battery Market Forecast (USD Billion), by Sub-Segment 1, 2018-2029
Figure 26: North America Grid-scale Lithium-ion Battery Market Forecast (USD Billion), by Sub-Segment 2, 2018-2029
Figure 27: North America Grid-scale Lithium-ion Battery Market Forecast (USD Billion), by Sub-Segment 3, 2018-2029
Figure 28: North America Grid-scale Lithium-ion Battery Market Forecast (USD Billion), by Others, 2018-2029
Figure 29: North America Grid-scale Lithium-ion Battery Market Forecast (USD Billion), by U.S., 2018-2029
Figure 30: North America Grid-scale Lithium-ion Battery Market Forecast (USD Billion), by Canada, 2018-2029
Figure 31: Latin America Grid-scale Lithium-ion Battery Market Value Share (%), By Segment 1, 2022 & 2029
Figure 32: Latin America Grid-scale Lithium-ion Battery Market Forecast (USD Billion), by Sub-Segment 1, 2018-2029
Figure 33: Latin America Grid-scale Lithium-ion Battery Market Forecast (USD Billion), by Sub-Segment 2, 2018-2029
Figure 34: Latin America Grid-scale Lithium-ion Battery Market Value Share (%), By Segment 2, 2022 & 2029
Figure 35: Latin America Grid-scale Lithium-ion Battery Market Forecast (USD Billion), by Sub-Segment 1, 2018-2029
Figure 36: Latin America Grid-scale Lithium-ion Battery Market Forecast (USD Billion), by Sub-Segment 2, 2018-2029
Figure 37: Latin America Grid-scale Lithium-ion Battery Market Forecast (USD Billion), by Sub-Segment 3, 2018-2029
Figure 38: Latin America Grid-scale Lithium-ion Battery Market Forecast (USD Billion), by Others, 2018-2029
Figure 39: Latin America Grid-scale Lithium-ion Battery Market Value Share (%), By Segment 3, 2022 & 2029
Figure 40: Latin America Grid-scale Lithium-ion Battery Market Forecast (USD Billion), by Sub-Segment 1, 2018-2029
Figure 41: Latin America Grid-scale Lithium-ion Battery Market Forecast (USD Billion), by Sub-Segment 2, 2018-2029
Figure 42: Latin America Grid-scale Lithium-ion Battery Market Forecast (USD Billion), by Sub-Segment 3, 2018-2029
Figure 43: Latin America Grid-scale Lithium-ion Battery Market Forecast (USD Billion), by Others, 2018-2029
Figure 44: Latin America Grid-scale Lithium-ion Battery Market Forecast (USD Billion), by Brazil, 2018-2029
Figure 45: Latin America Grid-scale Lithium-ion Battery Market Forecast (USD Billion), by Mexico, 2018-2029
Figure 46: Latin America Grid-scale Lithium-ion Battery Market Forecast (USD Billion), by Rest of Latin America, 2018-2029
Figure 47: Europe Grid-scale Lithium-ion Battery Market Value Share (%), By Segment 1, 2022 & 2029
Figure 48: Europe Grid-scale Lithium-ion Battery Market Forecast (USD Billion), by Sub-Segment 1, 2018-2029
Figure 49: Europe Grid-scale Lithium-ion Battery Market Forecast (USD Billion), by Sub-Segment 2, 2018-2029
Figure 50: Europe Grid-scale Lithium-ion Battery Market Value Share (%), By Segment 2, 2022 & 2029
Figure 51: Europe Grid-scale Lithium-ion Battery Market Forecast (USD Billion), by Sub-Segment 1, 2018-2029
Figure 52: Europe Grid-scale Lithium-ion Battery Market Forecast (USD Billion), by Sub-Segment 2, 2018-2029
Figure 53: Europe Grid-scale Lithium-ion Battery Market Forecast (USD Billion), by Sub-Segment 3, 2018-2029
Figure 54: Europe Grid-scale Lithium-ion Battery Market Forecast (USD Billion), by Others, 2018-2029
Figure 55: Europe Grid-scale Lithium-ion Battery Market Value Share (%), By Segment 3, 2022 & 2029
Figure 56: Europe Grid-scale Lithium-ion Battery Market Forecast (USD Billion), by Sub-Segment 1, 2018-2029
Figure 57: Europe Grid-scale Lithium-ion Battery Market Forecast (USD Billion), by Sub-Segment 2, 2018-2029
Figure 58: Europe Grid-scale Lithium-ion Battery Market Forecast (USD Billion), by Sub-Segment 3, 2018-2029
Figure 59: Europe Grid-scale Lithium-ion Battery Market Forecast (USD Billion), by Others, 2018-2029
Figure 60: Europe Grid-scale Lithium-ion Battery Market Forecast (USD Billion), by U.K., 2018-2029
Figure 61: Europe Grid-scale Lithium-ion Battery Market Forecast (USD Billion), by Germany, 2018-2029
Figure 62: Europe Grid-scale Lithium-ion Battery Market Forecast (USD Billion), by France, 2018-2029
Figure 63: Europe Grid-scale Lithium-ion Battery Market Forecast (USD Billion), by Italy, 2018-2029
Figure 64: Europe Grid-scale Lithium-ion Battery Market Forecast (USD Billion), by Spain, 2018-2029
Figure 65: Europe Grid-scale Lithium-ion Battery Market Forecast (USD Billion), by Russia, 2018-2029
Figure 66: Europe Grid-scale Lithium-ion Battery Market Forecast (USD Billion), by Rest of Europe, 2018-2029
Figure 67: Asia Pacific Grid-scale Lithium-ion Battery Market Value Share (%), By Segment 1, 2022 & 2029
Figure 68: Asia Pacific Grid-scale Lithium-ion Battery Market Forecast (USD Billion), by Sub-Segment 1, 2018-2029
Figure 69: Asia Pacific Grid-scale Lithium-ion Battery Market Forecast (USD Billion), by Sub-Segment 2, 2018-2029
Figure 70: Asia Pacific Grid-scale Lithium-ion Battery Market Value Share (%), By Segment 2, 2022 & 2029
Figure 71: Asia Pacific Grid-scale Lithium-ion Battery Market Forecast (USD Billion), by Sub-Segment 1, 2018-2029
Figure 72: Asia Pacific Grid-scale Lithium-ion Battery Market Forecast (USD Billion), by Sub-Segment 2, 2018-2029
Figure 73: Asia Pacific Grid-scale Lithium-ion Battery Market Forecast (USD Billion), by Sub-Segment 3, 2018-2029
Figure 74: Asia Pacific Grid-scale Lithium-ion Battery Market Forecast (USD Billion), by Others, 2018-2029
Figure 75: Asia Pacific Grid-scale Lithium-ion Battery Market Value Share (%), By Segment 3, 2022 & 2029
Figure 76: Asia Pacific Grid-scale Lithium-ion Battery Market Forecast (USD Billion), by Sub-Segment 1, 2018-2029
Figure 77: Asia Pacific Grid-scale Lithium-ion Battery Market Forecast (USD Billion), by Sub-Segment 2, 2018-2029
Figure 78: Asia Pacific Grid-scale Lithium-ion Battery Market Forecast (USD Billion), by Sub-Segment 3, 2018-2029
Figure 79: Asia Pacific Grid-scale Lithium-ion Battery Market Forecast (USD Billion), by Others, 2018-2029
Figure 80: Asia Pacific Grid-scale Lithium-ion Battery Market Forecast (USD Billion), by China, 2018-2029
Figure 81: Asia Pacific Grid-scale Lithium-ion Battery Market Forecast (USD Billion), by India, 2018-2029
Figure 82: Asia Pacific Grid-scale Lithium-ion Battery Market Forecast (USD Billion), by Japan, 2018-2029
Figure 83: Asia Pacific Grid-scale Lithium-ion Battery Market Forecast (USD Billion), by Australia, 2018-2029
Figure 84: Asia Pacific Grid-scale Lithium-ion Battery Market Forecast (USD Billion), by Southeast Asia, 2018-2029
Figure 85: Asia Pacific Grid-scale Lithium-ion Battery Market Forecast (USD Billion), by Rest of Asia Pacific, 2018-2029
Figure 86: Middle East & Africa Grid-scale Lithium-ion Battery Market Value Share (%), By Segment 1, 2022 & 2029
Figure 87: Middle East & Africa Grid-scale Lithium-ion Battery Market Forecast (USD Billion), by Sub-Segment 1, 2018-2029
Figure 88: Middle East & Africa Grid-scale Lithium-ion Battery Market Forecast (USD Billion), by Sub-Segment 2, 2018-2029
Figure 89: Middle East & Africa Grid-scale Lithium-ion Battery Market Value Share (%), By Segment 2, 2022 & 2029
Figure 90: Middle East & Africa Grid-scale Lithium-ion Battery Market Forecast (USD Billion), by Sub-Segment 1, 2018-2029
Figure 91: Middle East & Africa Grid-scale Lithium-ion Battery Market Forecast (USD Billion), by Sub-Segment 2, 2018-2029
Figure 92: Middle East & Africa Grid-scale Lithium-ion Battery Market Forecast (USD Billion), by Sub-Segment 3, 2018-2029
Figure 93: Middle East & Africa Grid-scale Lithium-ion Battery Market Forecast (USD Billion), by Others, 2018-2029
Figure 94: Middle East & Africa Grid-scale Lithium-ion Battery Market Value Share (%), By Segment 3, 2022 & 2029
Figure 95: Middle East & Africa Grid-scale Lithium-ion Battery Market Forecast (USD Billion), by Sub-Segment 1, 2018-2029
Figure 96: Middle East & Africa Grid-scale Lithium-ion Battery Market Forecast (USD Billion), by Sub-Segment 2, 2018-2029
Figure 97: Middle East & Africa Grid-scale Lithium-ion Battery Market Forecast (USD Billion), by Sub-Segment 3, 2018-2029
Figure 98: Middle East & Africa Grid-scale Lithium-ion Battery Market Forecast (USD Billion), by Others, 2018-2029
Figure 99: Middle East & Africa Grid-scale Lithium-ion Battery Market Forecast (USD Billion), by GCC, 2018-2029
Figure 100: Middle East & Africa Grid-scale Lithium-ion Battery Market Forecast (USD Billion), by South Africa, 2018-2029
Figure 101: Middle East & Africa Grid-scale Lithium-ion Battery Market Forecast (USD Billion), by Rest of Middle East & Africa, 2018-2029
List of Tables
Table 1: Global Grid-scale Lithium-ion Battery Market Revenue (USD Billion) Forecast, by Segment 1, 2018-2029
Table 2: Global Grid-scale Lithium-ion Battery Market Revenue (USD Billion) Forecast, by Segment 2, 2018-2029
Table 3: Global Grid-scale Lithium-ion Battery Market Revenue (USD Billion) Forecast, by Segment 3, 2018-2029
Table 4: Global Grid-scale Lithium-ion Battery Market Revenue (USD Billion) Forecast, by Region, 2018-2029
Table 5: North America Grid-scale Lithium-ion Battery Market Revenue (USD Billion) Forecast, by Segment 1, 2018-2029
Table 6: North America Grid-scale Lithium-ion Battery Market Revenue (USD Billion) Forecast, by Segment 2, 2018-2029
Table 7: North America Grid-scale Lithium-ion Battery Market Revenue (USD Billion) Forecast, by Segment 3, 2018-2029
Table 8: North America Grid-scale Lithium-ion Battery Market Revenue (USD Billion) Forecast, by Country, 2018-2029
Table 9: Europe Grid-scale Lithium-ion Battery Market Revenue (USD Billion) Forecast, by Segment 1, 2018-2029
Table 10: Europe Grid-scale Lithium-ion Battery Market Revenue (USD Billion) Forecast, by Segment 2, 2018-2029
Table 11: Europe Grid-scale Lithium-ion Battery Market Revenue (USD Billion) Forecast, by Segment 3, 2018-2029
Table 12: Europe Grid-scale Lithium-ion Battery Market Revenue (USD Billion) Forecast, by Country, 2018-2029
Table 13: Latin America Grid-scale Lithium-ion Battery Market Revenue (USD Billion) Forecast, by Segment 1, 2018-2029
Table 14: Latin America Grid-scale Lithium-ion Battery Market Revenue (USD Billion) Forecast, by Segment 2, 2018-2029
Table 15: Latin America Grid-scale Lithium-ion Battery Market Revenue (USD Billion) Forecast, by Segment 3, 2018-2029
Table 16: Latin America Grid-scale Lithium-ion Battery Market Revenue (USD Billion) Forecast, by Country, 2018-2029
Table 17: Asia Pacific Grid-scale Lithium-ion Battery Market Revenue (USD Billion) Forecast, by Segment 1, 2018-2029
Table 18: Asia Pacific Grid-scale Lithium-ion Battery Market Revenue (USD Billion) Forecast, by Segment 2, 2018-2029
Table 19: Asia Pacific Grid-scale Lithium-ion Battery Market Revenue (USD Billion) Forecast, by Segment 3, 2018-2029
Table 20: Asia Pacific Grid-scale Lithium-ion Battery Market Revenue (USD Billion) Forecast, by Country, 2018-2029
Table 21: Middle East & Africa Grid-scale Lithium-ion Battery Market Revenue (USD Billion) Forecast, by Segment 1, 2018-2029
Table 22: Middle East & Africa Grid-scale Lithium-ion Battery Market Revenue (USD Billion) Forecast, by Segment 2, 2018-2029
Table 23: Middle East & Africa Grid-scale Lithium-ion Battery Market Revenue (USD Billion) Forecast, by Segment 3, 2018-2029
Table 24: Middle East & Africa Grid-scale Lithium-ion Battery Market Revenue (USD Billion) Forecast, by Country, 2018-2029
Research Process
Data Library Research are conducted by industry experts who offer insight on
industry structure, market segmentations technology assessment and competitive landscape (CL), and penetration, as well as on emerging trends. Their analysis is based on primary interviews (~ 80%) and secondary research (~ 20%) as well as years of professional expertise in their respective industries. Adding to this, by analysing historical trends and current market positions, our analysts predict where the market will be headed for the next five years. Furthermore, the varying trends of segment & categories geographically presented are also studied and the estimated based on the primary & secondary research.
In this particular report from the supply side Data Library Research has conducted primary surveys (interviews) with the key level executives (VP, CEO’s, Marketing Director, Business Development Manager
and SOFT) of the companies that active & prominent as well as the midsized organization
FIGURE 1: DLR RESEARH PROCESS
![research-methodology1]()
Primary Research
Extensive primary research was conducted to gain a deeper insight of the market and industry performance. The analysis is based on both primary and secondary research as well as years of professional expertise in the respective industries.
In addition to analysing current and historical trends, our analysts predict where the market is headed over the next five years.
It varies by segment for these categories geographically presented in the list of market tables. Speaking about this particular report we have conducted primary surveys (interviews) with the key level executives (VP, CEO’s, Marketing Director, Business Development Manager and many more) of the major players active in the market.
Secondary Research
Secondary research was mainly used to collect and identify information useful for the extensive, technical, market-oriented, and Friend’s study of the Global Extra Neutral Alcohol. It was also used to obtain key information about major players, market classification and segmentation according to the industry trends, geographical markets, and developments related to the market and technology perspectives. For this study, analysts have gathered information from various credible sources, such as annual reports, sec filings, journals, white papers, SOFT presentations, and company web sites.
Market Size Estimation
Both, top-down and bottom-up approaches were used to estimate and validate the size of the Global market and to estimate the size of various other dependent submarkets in the overall Extra Neutral Alcohol. The key players in the market were identified through secondary research and their market contributions in the respective geographies were determined through primary and secondary research.
Forecast Model
![research-methodology2]()